


Experiment metrics
Contents
Once you've created your experiment, you can assign metrics to let you evaluate your experiment's impact and determine if the observed results are statistically significant. For all metric types, only events that occur after a user's exposure to the experiment are included in calculations.
Metric types
PostHog supports four types of metrics to measure different aspects of your experiment's impact. Choose the metric type that best aligns with your hypothesis.
Funnel
Use funnel metrics to measure conversion rates through multi-step processes. This is ideal for tracking user journeys like onboarding flows, checkout processes, or feature adoption paths.
How it works:
- Define a series of events that users must complete in sequence (or any order if using unordered funnels)
- Each user either completes all steps (success) or drops off somewhere (failure)
- We calculate the conversion rate from the first step (the exposure event) to the last step for each variant
- Statistical significance is determined using the difference in conversion rates between variants
In experiment funnels, the first step is always the exposure event (by default the $feature_flag_called event, but can be customized in the exposure settings). This differs from product analytics funnels where you explicitly define all steps.
When defining your funnel metric, you only specify the events that should occur after the exposure. For example, if you want to measure a two-step funnel from exposure to purchase, you only need to add the purchase event - the exposure event is automatically included as the first step.
Learn more about exposures and how they determine which users are included in your experiment.
Mean
Use this to track metrics like total event count or summed values (e.g., revenue). Here's how it works:
- We aggregate the chosen value for each user using your selected method (count, sum, or average).
- We then compute the mean of those values for each variant.
- This mean is used to determine the statistical difference between variants.
For example:
- If you choose sum of revenue, we calculate total revenue per user, then take the mean across users.
- If you select average revenue, we first compute each user's average (total revenue / number of events), then average those values across users.
You can also use custom HogQL expressions as the aggregation method. This supports both numeric functions like sum() and avg() as well as non-numeric functions like uniqExact() and count(). For example, uniqExact(properties.category) counts the number of unique category values per user, even when the property contains strings.
Ratio
Use ratio metrics to calculate the relationship between two different metrics. This is useful when you want to measure metrics like revenue per user, items per order, or conversion rate with a custom denominator (different from the users exposed to the experiment).
How it works:
- We calculate the numerator value for each user (e.g., total revenue)
- We calculate the denominator value for each user (e.g., number of purchases)
- We compute the ratio between these aggregated values for each variant
- Statistical significance is calculated using the delta method for ratio estimation
Common use cases:
- Revenue per purchase: Track average order value by dividing total revenue by number of purchases
- Items per session: Measure engagement by dividing total interactions by unique sessions
- Custom conversion rates: Calculate conversions with a denominator other than exposed users (e.g., conversions per active user)
Both the numerator and denominator support all aggregation methods (count, sum, average, unique values). You can even use the same event with different properties for each part of the ratio, such as dividing total revenue by total quantity sold from purchase events.
Ratio metrics also support outlier handling for both the numerator and denominator independently, each with its own percentile bounds.
Retention
Use retention metrics to measure if users come back to perform a specific action within a defined time window after an initial action. This helps you measure engagement patterns, feature stickiness, and long-term user behavior.
Retention metrics track two events and a time window:
| Event | Description | Examples |
|---|---|---|
| Start event | The initial action that begins tracking | Signup, complete onboarding, first purchase |
| Completion event | The action you want users to return for | Login, feature use, make another purchase |
| Retention window | When the completion event should occur | Between 1 and 7 days after start event |
PostHog calculates the retention rate by measuring what proportion of users performed the completion event within the window. Statistical significance is determined using the difference in retention rates between variants.
The retention window defines when completion events count. A "1 to 7 days" window means the completion event must occur at least 1 full day after the start event, up to and including day 7. PostHog compares calendar days rather than exact 24-hour periods, so a "7 days" window includes any completion event on the 7th calendar day. Hour-based windows work the same way.
For start handling, you can choose:
- First seen: Uses the first occurrence of the start event, ideal for one-time actions like signup
- Last seen: Uses the last occurrence of the start event, useful for recurring actions
Common use cases:
- Onboarding effectiveness: Track if users who complete onboarding return within 7 days
- Feature stickiness: Measure if users who try a new feature come back to use it again
- Re-engagement: Test if marketing campaigns bring back dormant users
- Churn reduction: Measure if changes reduce the time until users return
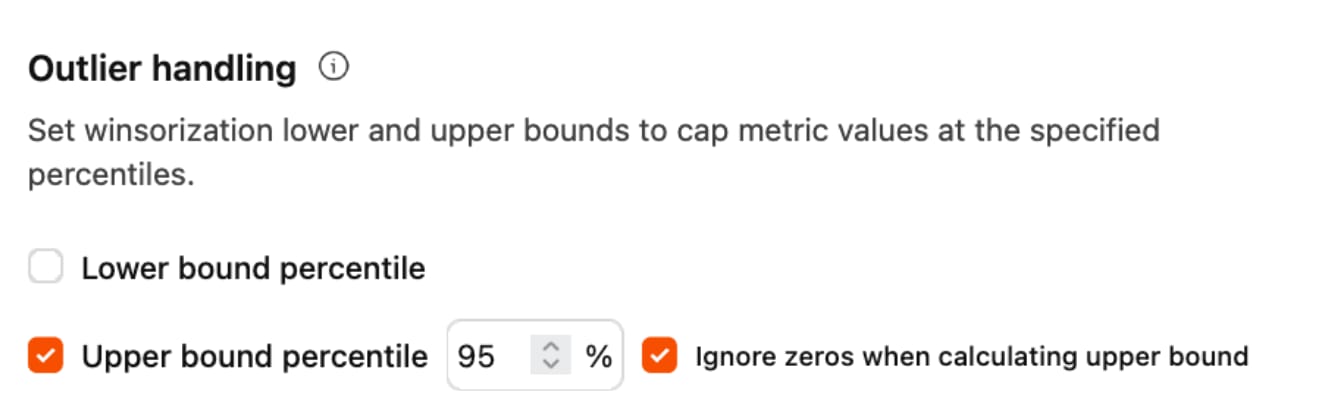
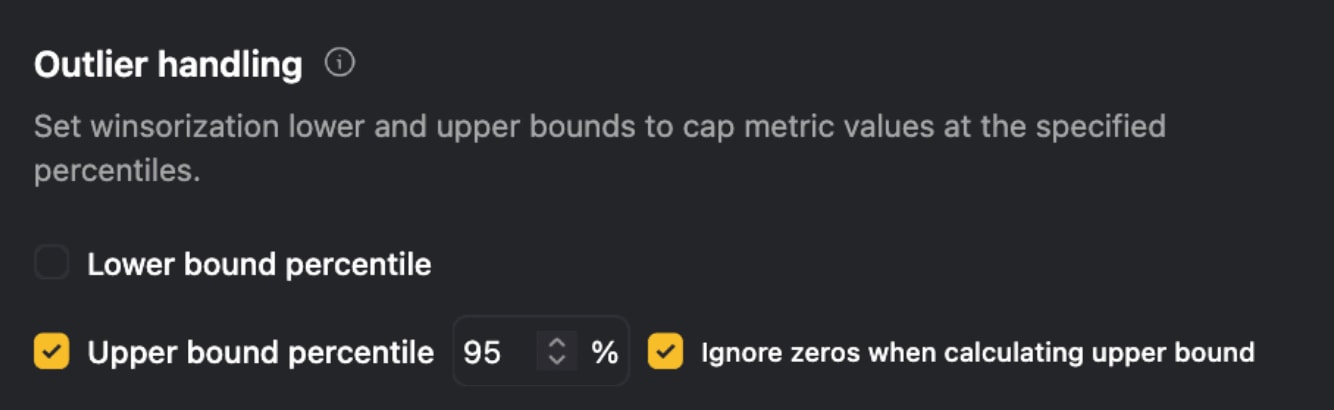
Outlier handling
You can limit the impact of extreme values by clamping metric data at specified percentile thresholds using configurable lower and upper bounds. Values below the lower bound are replaced with the lower bound value, and values above the upper bound are replaced with the upper bound value. No data is excluded, and all users remain in the calculation. This is available for mean, funnel, and ratio metrics.
This technique is commonly known as Winsorization and is especially useful for metrics with highly skewed distributions, such as revenue or total event counts, where a small subset of users can produce unusually high values that distort overall results.
Ratio metric outlier handling
For ratio metrics, the numerator and denominator are capped independently, each with its own percentile bounds and threshold computed over the pooled experiment population. This allows you to, for example, cap revenue at the 99th percentile while leaving order count uncapped.
To leave a component uncapped, leave its outlier handling configuration unset. When a breakdown is applied, thresholds are computed separately for each breakdown group.
Ignoring zeros in percentile calculations
When calculating the upper bound percentile, you can choose to ignore zero values. This is particularly useful when a large number of participants in your experiment don't have the event at all (resulting in a value of 0). By excluding these zeros from the percentile calculation, you can more accurately tune the upper bound to focus on the distribution of actual positive values, making it easier to identify and handle true outliers among participants who did engage with the feature.
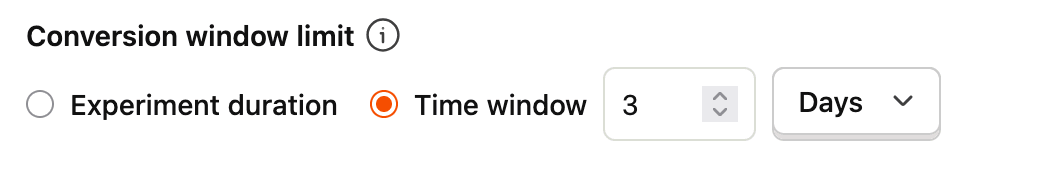
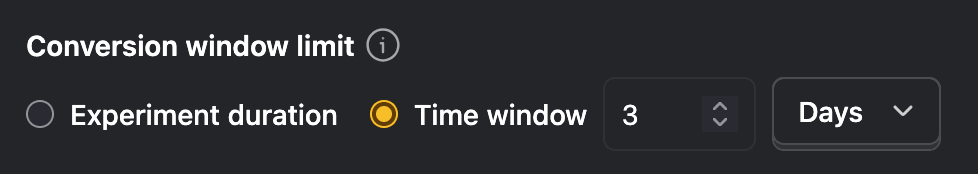
Conversion windows
Conversion windows restrict metric events to those that occur within a defined time window following a user's initial exposure to the experiment. Metric events outside of the conversion window aren't included in experiment calculations.
This ensures that only relevant, post-exposure behavior is included in the analysis.
Primary and secondary metrics
Each metric can be set as either a primary or secondary metric. This is just a way of organizing metrics - primary and secondary metrics work the same way.
Primary metrics represent the main goal of your experiment. They directly measure if your hypothesis was successful and are the key factor in deciding if the test achieved its primary objective.
Secondary metrics provide more context for your experiment. They can help you understand the impact of your primary metric and ensure your experiment didn't have negative side effects.
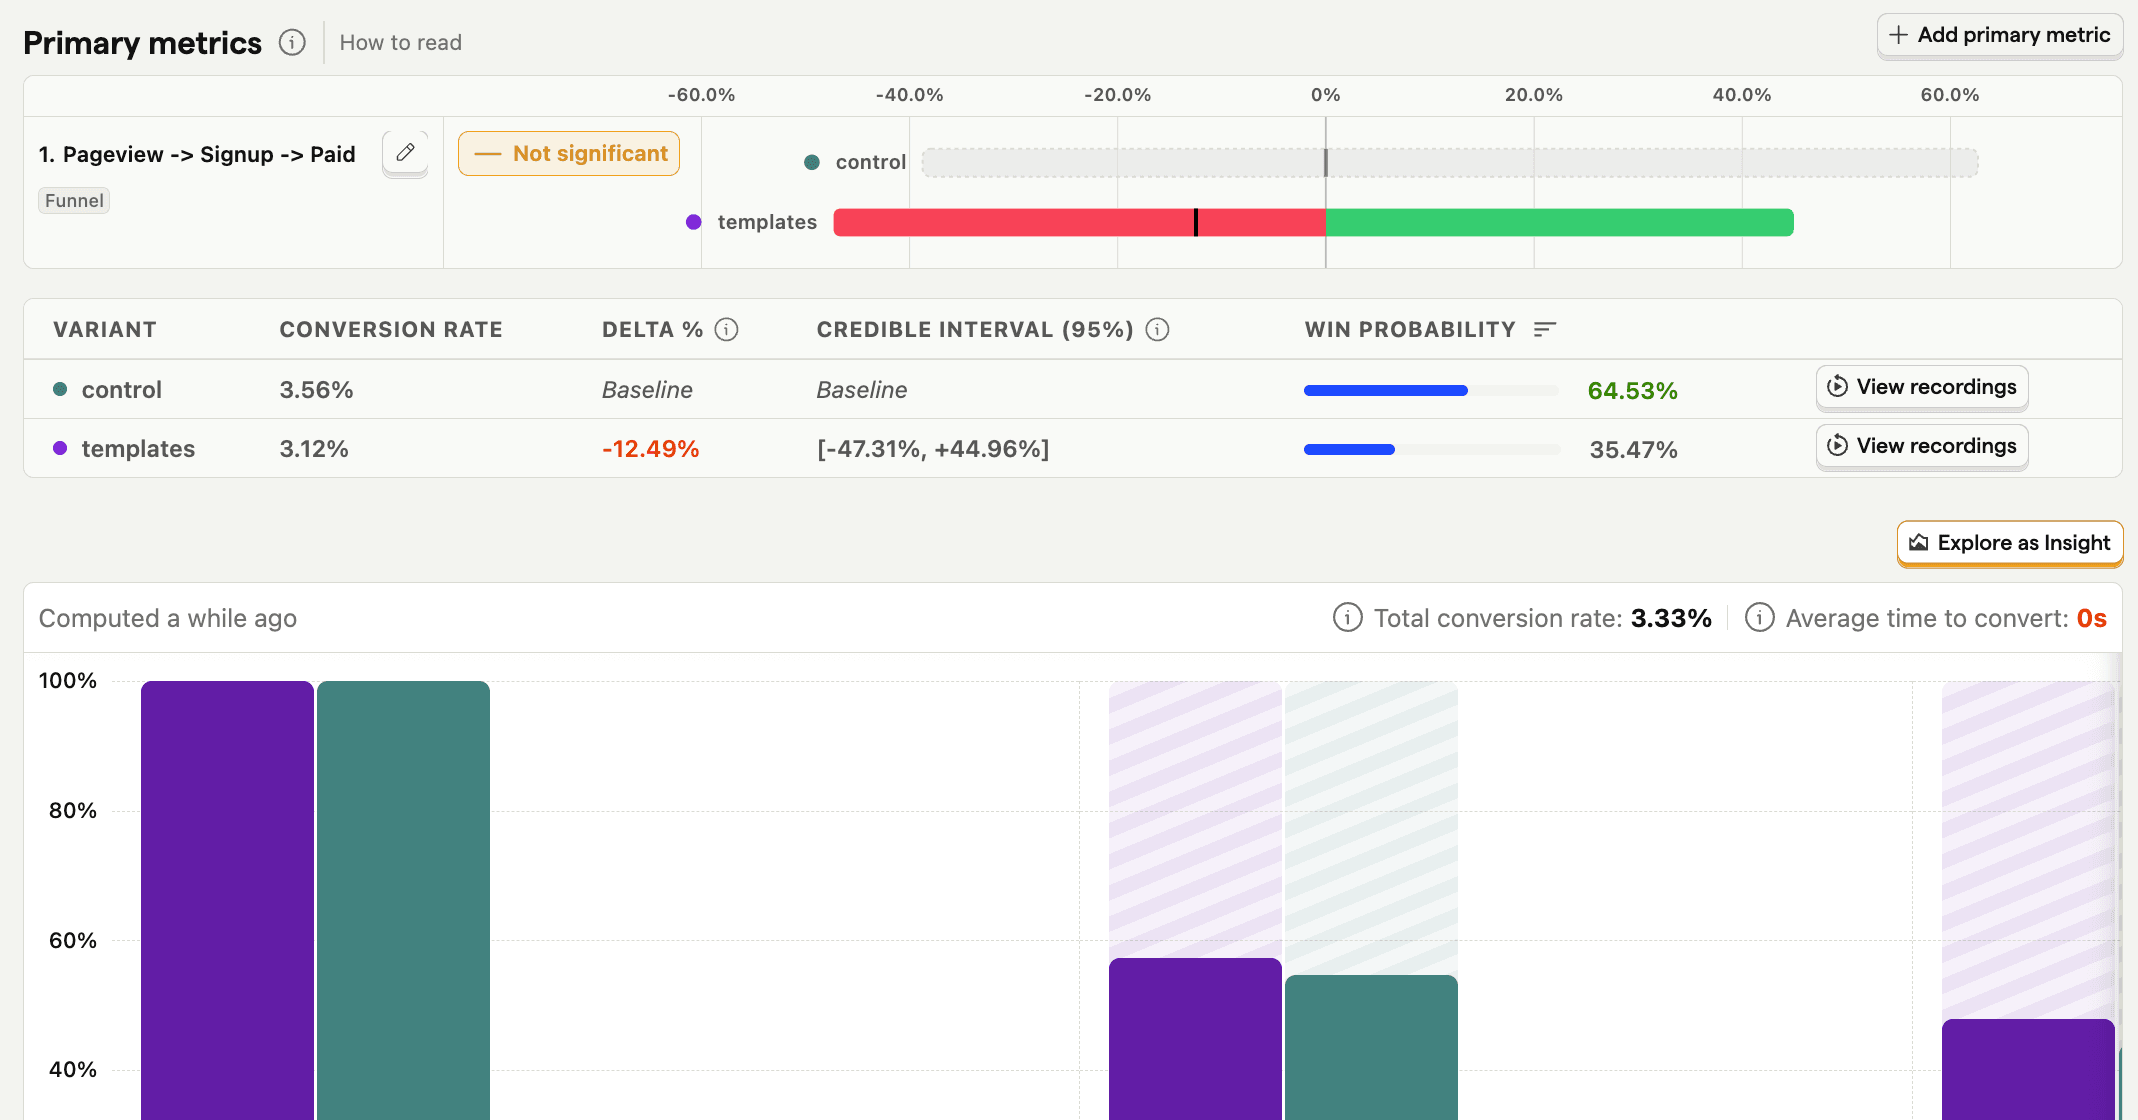
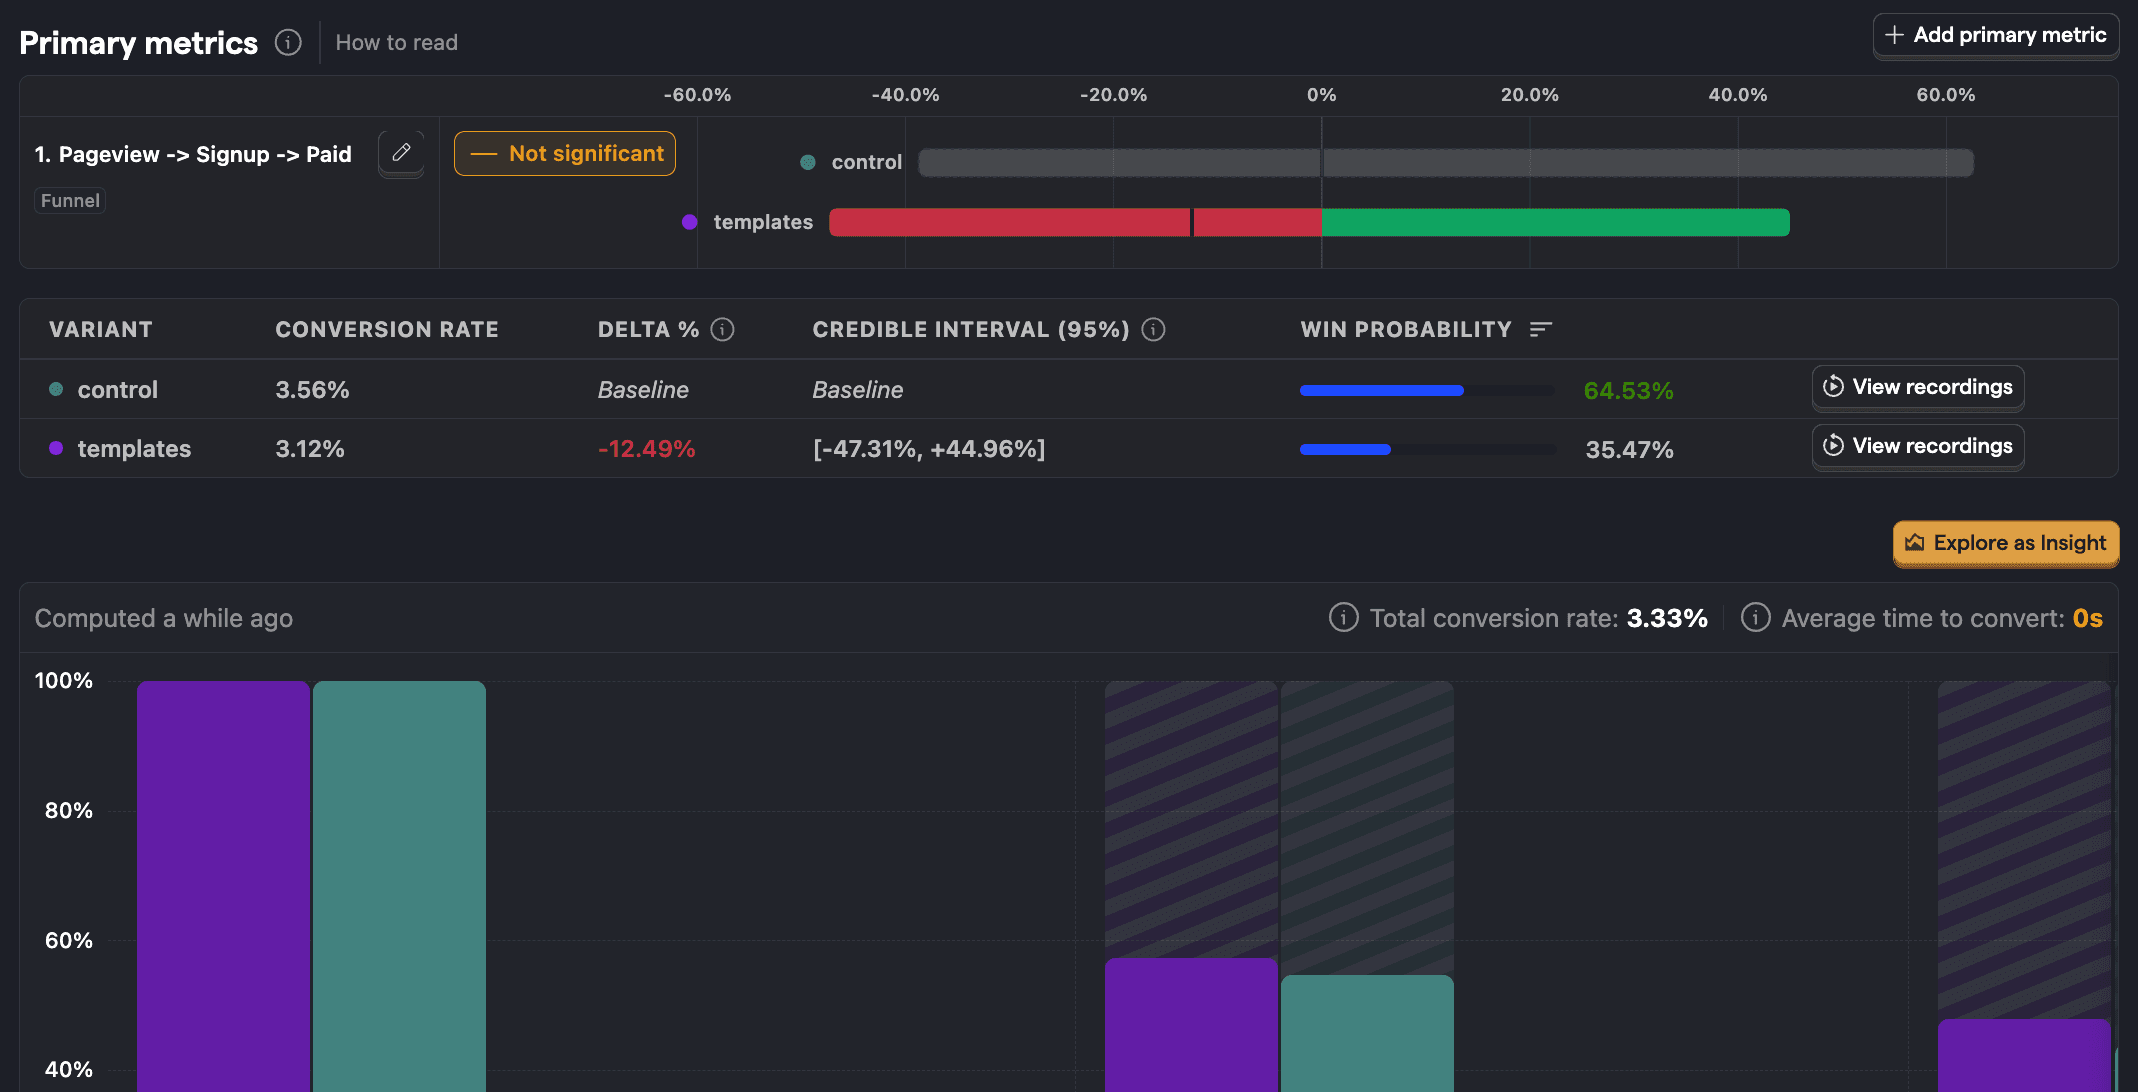
Once added and data starts being collected, we show the results as a credible interval bar chart along with details about significance, win probability, and delta between variants.
How to read credible interval bar charts
Each bar shows how a variant is performing compared to the control (the gray bar) for the metric, using a 95% credible interval. That means there's a 95% chance the true difference for that variant falls within this range. The vertical "0%" line is your baseline:
- To the right (green): The metric is higher (an improvement).
- To the left (red): The metric is lower (a decrease).
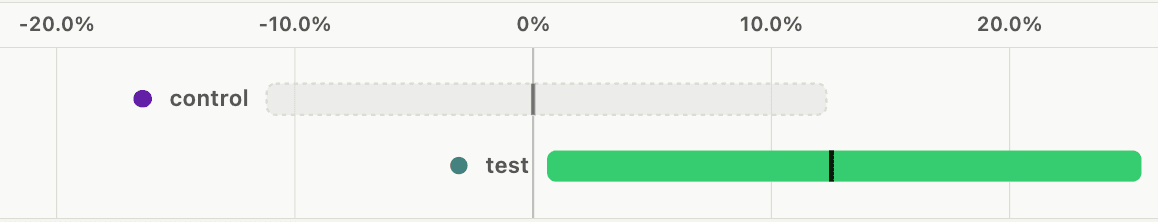
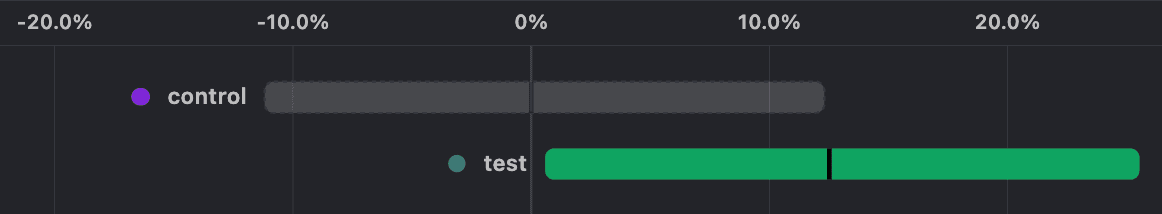
The width of the bar represents uncertainty. A narrower bar means we're more confident in that result, while a wider bar means it could shift either way.
The control (baseline) is always shown in gray. Other bars will be green or red—or even a mix—depending on whether the change is positive or negative.
What "sum" actually computes
When you select an event property and choose "sum" as the aggregation, PostHog computes the mean of per-user totals, not a raw sum across all events. For example, if user A has $50 in revenue and user B has $10, the result is ($50 + $10) / 2 = $30, not $60.
Experiments always compare per-user values between variants, so there's no raw total view. If you need raw totals, use a trends insight outside the experiment.
Set an explicit conversion window
If you don't set a conversion window, trend metrics count conversions from exposure through the experiment end date with no upper bound. This means a user who converts 45 days after exposure is counted the same as one who converts in 5 minutes. Set a window that matches your product's natural conversion cycle. If users typically convert within a week, use a 7-day window.
Two other behaviors to know:
- Conversions count from first exposure. Metric events are only counted if they happen after the user's first exposure. If a user is re-exposed later (e.g., flag evaluated from both web and server SDK), the end of the window extends from that later exposure, but earlier conversions are still included.
- The window extends past the experiment end date. A 7-day window on an experiment ending March 1 counts conversions through March 8 for users exposed on March 1.
Shared metrics
Create a shared metric to easily reuse a funnel or a trend metric across experiments. This is ideal for key company metrics like conversion, revenue, churn, and more.
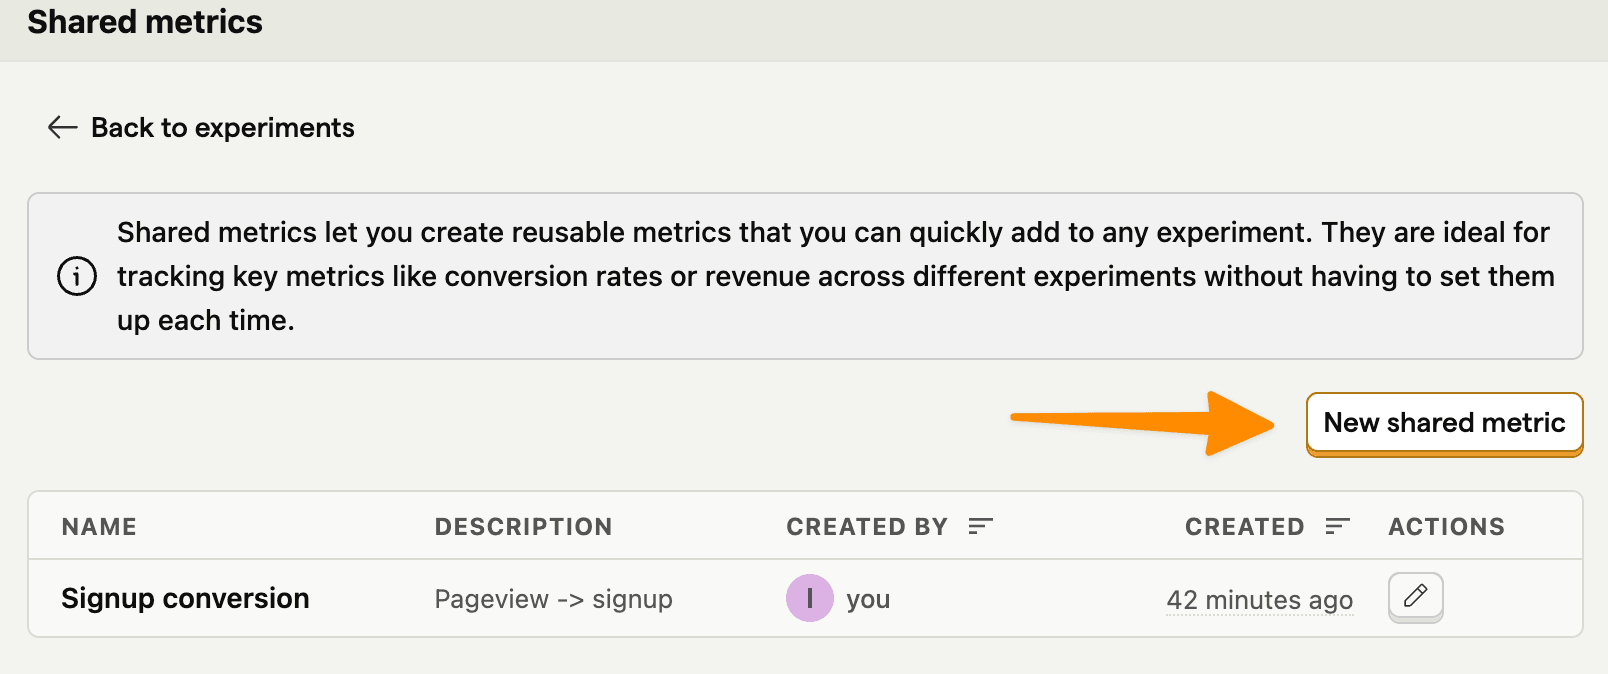
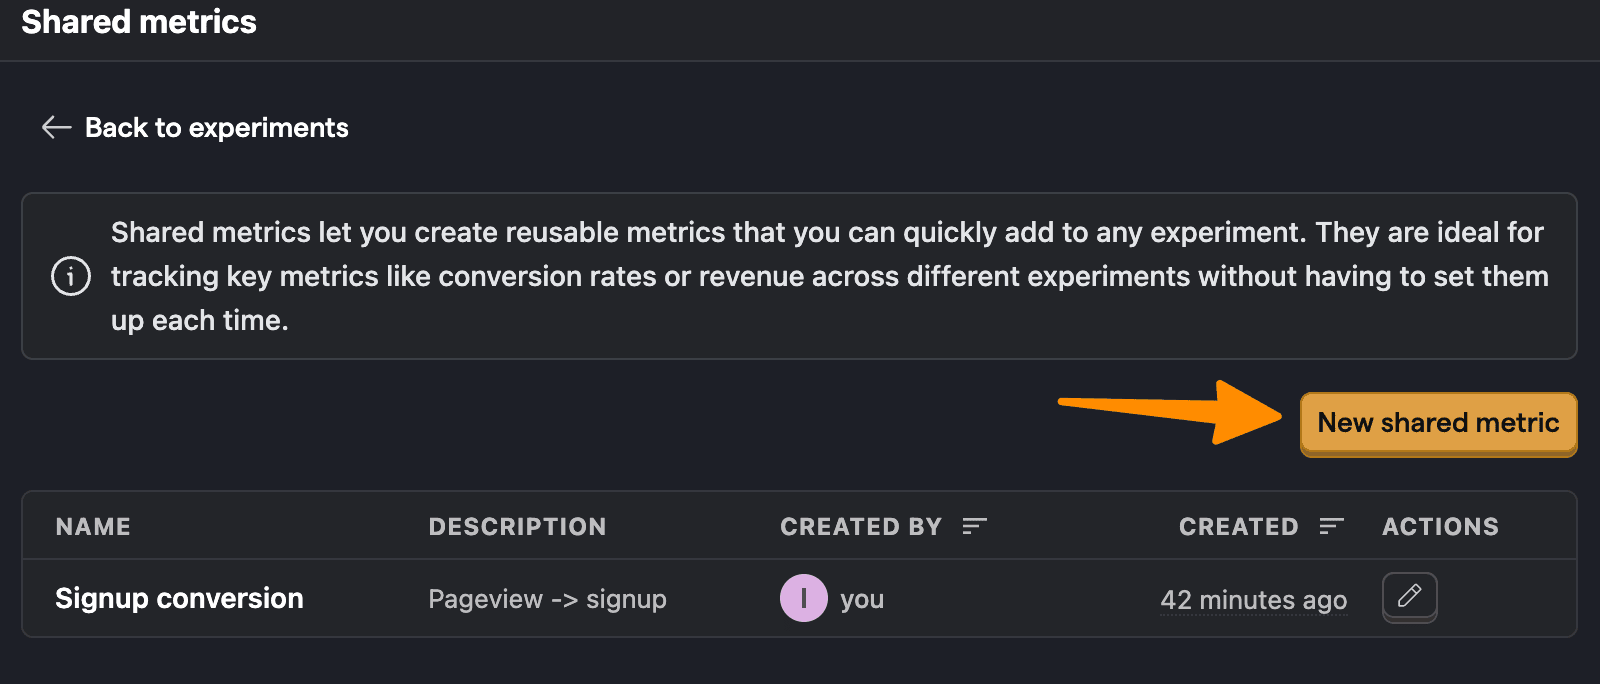
To create one, go to the shared metrics tab and click New shared metric. From here, they are created the same way as single-use metrics.
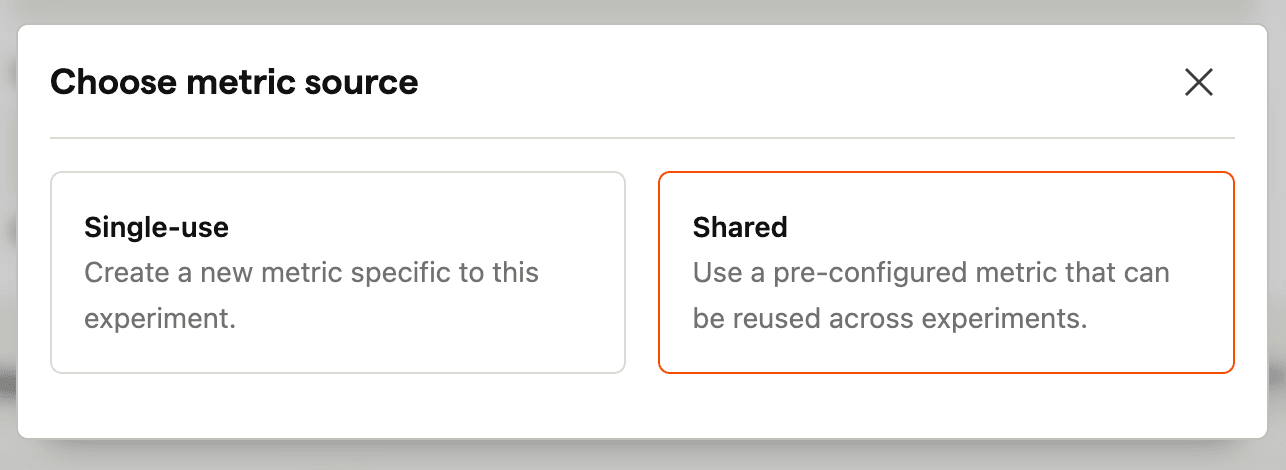
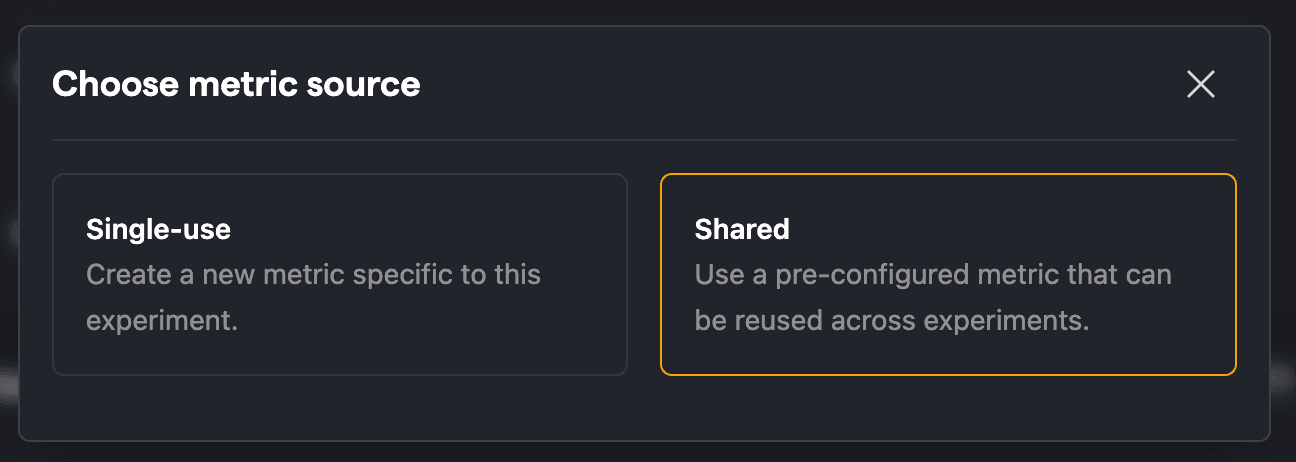
Once created, choose Shared as a metric source when adding a primary or secondary metric to an experiment and then select the shared metric(s) you want to use.
Both the shared metrics list and the selection modal include a search bar that filters metrics by name, description, or tags. You can also add and edit tags inline directly from either view, making it easy to organize and find metrics at scale. If you add tags to your shared metrics, you can quickly select all of the metrics associated with a specific tag.
Duplicating a shared metric as single-use
When you duplicate a shared metric from the metric actions menu, a dialog presents two options:
- Duplicate as single-use metric – Creates an inline copy of the metric that belongs only to the current experiment. You can then edit it freely without affecting the original shared metric or any other experiment that uses it.
- Duplicate as shared metric – Opens the shared metric form so you can customize and save a new shared metric, available to all experiments.
This is useful when you want to use a shared metric as a starting template and tweak it for a specific experiment without creating another shared metric. The copy includes (copy) in its name, and any breakdowns configured on the shared metric are automatically carried over to the new inline copy.