


Running time and sample size
Contents
Before running an experiment, you'll want to know how long it needs to run to get reliable results. The running time calculator helps you estimate this based on your traffic and the size of effect you want to detect.
Finding the calculator
The running time indicator appears on your experiment page, showing the estimated remaining time and a progress indicator:
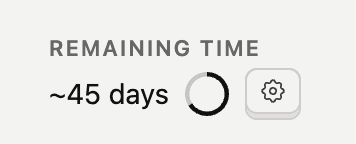
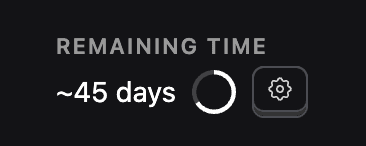
Click the gear icon next to the time estimate to open the configuration modal:


Calculation modes
The calculator offers two modes: automatic and manual:
- Automatic is the default mode for launched experiments and provides more accurate results.
- Manual mode is default for draft experiments, and optional for launched experiments.
Automatic mode
Automatic mode uses real data from your running experiment to calculate estimates. It looks at:
- Your primary metric: The calculator uses your first primary metric to determine the baseline value and variance
- Current exposures: How many users have entered the experiment so far
- Daily exposure rate: Calculated from your actual traffic since the experiment started
This mode requires at least 1 day of runtime and 100 exposures before estimates appear. Until then, you'll see "Pending" in the running time indicator.
Automatic mode is only available after launching your experiment since it requires real data. For draft experiments, use manual mode to estimate running time before launch.
Once you have enough data, automatic mode shows:
- Remaining time: How many more days until you reach the recommended sample size
- Progress: Current exposures vs. target sample size
- Rate: Your observed daily exposure rate
Manual mode
Manual mode lets you estimate running time using your own inputs rather than real data. Use it when you know your approximate traffic numbers and baseline metrics.


To use manual mode:
Select your metric type:
- Funnel: For conversion rate metrics (e.g., "percentage of users who complete checkout")
- Count: For event frequency metrics (e.g., "number of purchases per user")
- Sum/Avg: For property value metrics (e.g., "revenue per user" or "average session duration")
Enter your baseline value:
- For funnels: Your current conversion rate as a percentage (e.g., 5 for 5%)
- For count: Average events per user (e.g., 3.2 purchases per user)
- For sum/avg: Average property value per user (e.g., $47 revenue per user)
Set the minimum detectable effect (see section below)
Enter expected exposures per day: Total users entering the experiment daily across all variants
The calculator shows your recommended sample size and estimated running time based on these inputs.
Minimum detectable effect (MDE)
The minimum detectable effect is the smallest change you want your experiment to reliably detect. Think of it as your sensitivity setting.
- Lower MDE (e.g., 5%): Detects smaller changes but requires more data and longer runtime
- Higher MDE (e.g., 50%): Detects only large changes but needs less data
The default is 30%, which is a reasonable starting point for most experiments.
How to choose your MDE:
- If your baseline conversion is 10% and you set MDE to 20%, you're looking for a change to at least 12% (or down to 8%)
- Consider what change would actually matter to your business. A 1% improvement on a high-traffic page might be worth detecting, while the same improvement on a low-traffic feature might not justify the longer experiment runtime
- If you're unsure, start with 30% and adjust based on your sample size constraints
The MDE setting is shared between automatic and manual modes—changing it in one place updates it everywhere.
Understanding the results
The calculator outputs the following results:
- Recommended sample size: Total number of exposures needed across all variants
- Estimated running time: Days to reach the sample size at your current (or expected) exposure rate
- Progress: How close you are to the target (automatic mode only)
When you've collected enough data, the indicator shows "Complete" with a checkmark, meaning you have sufficient statistical power to detect the effect size you specified.
Note: "Complete" means you have enough data for your specified MDE. You should still check if your results are statistically significant before making decisions. Having enough sample size doesn't guarantee you'll see a significant result – it means if there is a real effect of that size, you're likely to detect it.
How the sample size formula works
The calculator uses a standard statistical power analysis formula:
Where:
- N is the sample size per variant
- 16 comes from achieving 80% statistical power at 95% confidence (this is the standard threshold for experiments)
- variance depends on your metric type
- d is the absolute effect size (MDE × baseline value)
The total sample size is then multiplied by the number of variants in your experiment.
Variance by metric type:
| Metric type | Variance formula |
|---|---|
| Funnel | p × (1 - p), where p is the conversion rate |
| Count | 2 × baseline |
| Sum/Avg | 0.25 × baseline² |
For example, with a 10% conversion rate (p = 0.1) and 20% MDE:
- Variance = 0.1 × 0.9 = 0.09
- Absolute effect d = 0.2 × 0.1 = 0.02
- Sample size per variant = (16 × 0.09) / 0.02² = 3,600
- For a 2-variant experiment: 7,200 total exposures needed
Tips for accurate estimates
Use automatic mode when possible: Real data is more reliable than estimates. Once your experiment has been running for a day with 100+ exposures, automatic mode gives you the most accurate projections.
Be realistic with manual estimates: If you're planning an experiment, use actual historical data for your baseline values and traffic numbers rather than optimistic guesses.
Consider your MDE carefully: Setting MDE too low means waiting longer for results. Setting it too high means you might miss meaningful improvements. Find the balance that makes sense for your specific situation.
Check progress regularly: The remaining time estimate updates as more data comes in. Early estimates may shift as the calculator gets a better picture of your actual traffic patterns.