


Insight tips and advanced features
Contents
Using the persons modal
Clicking on a data point in a trends insight opens the persons modal, which shows you a list of users/groups that performed it during the selected time period.
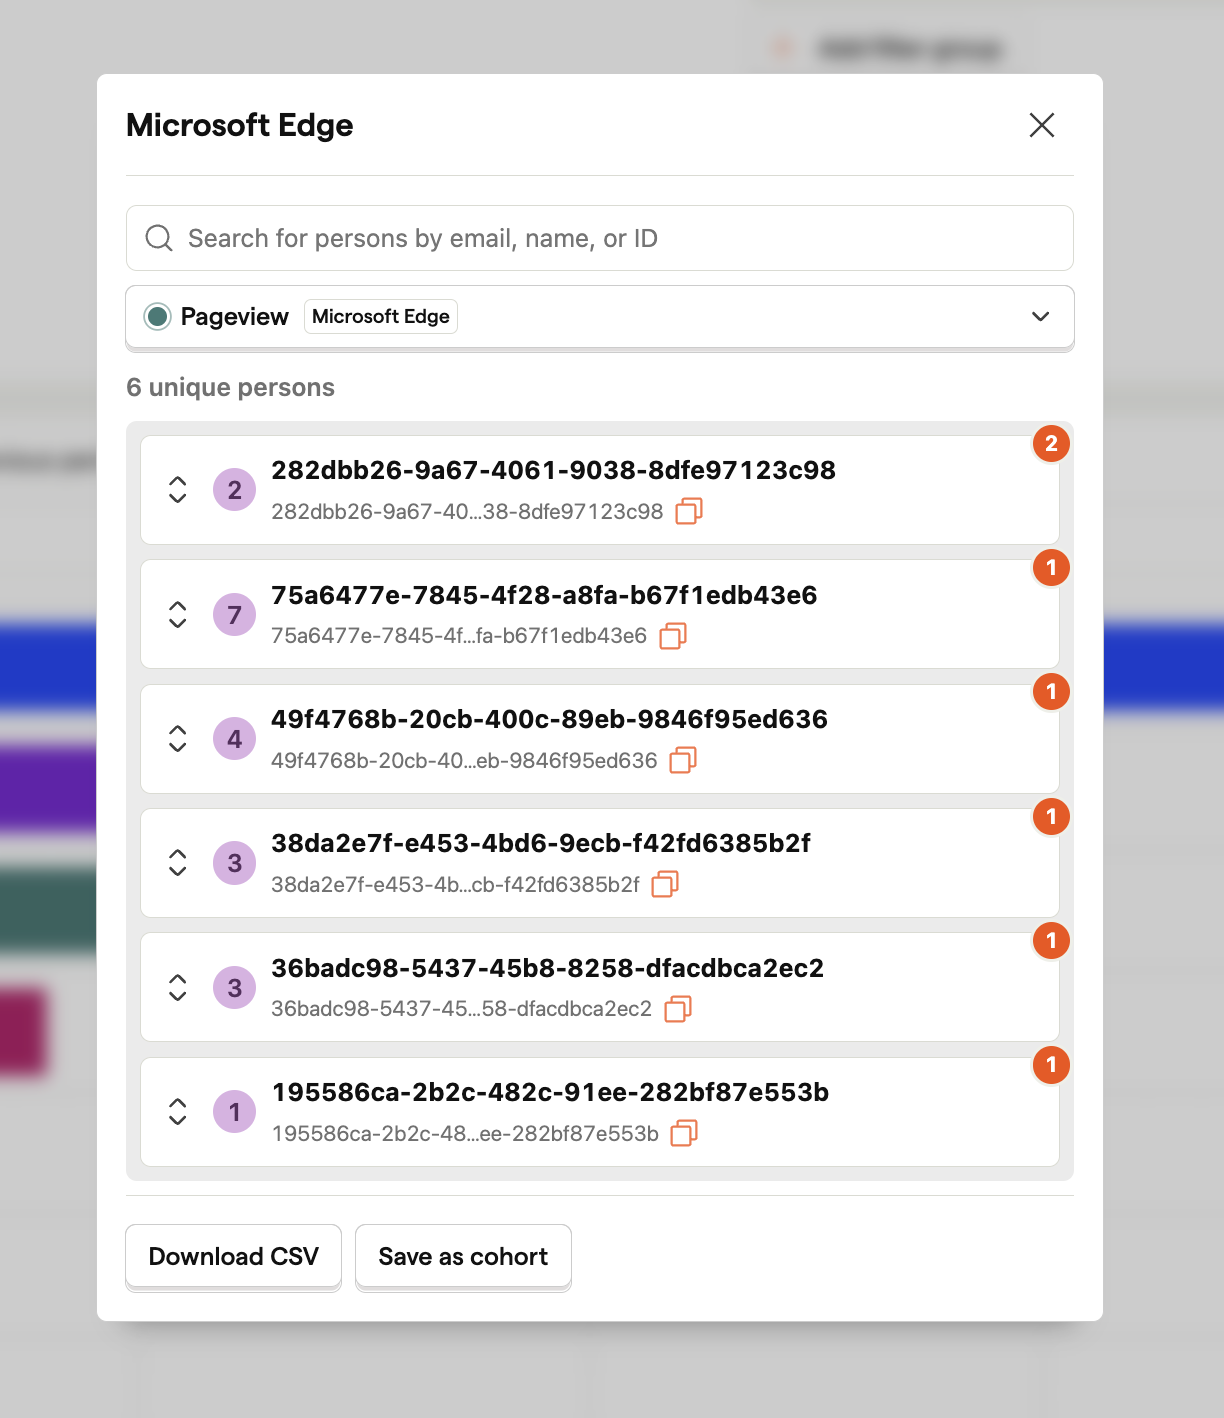
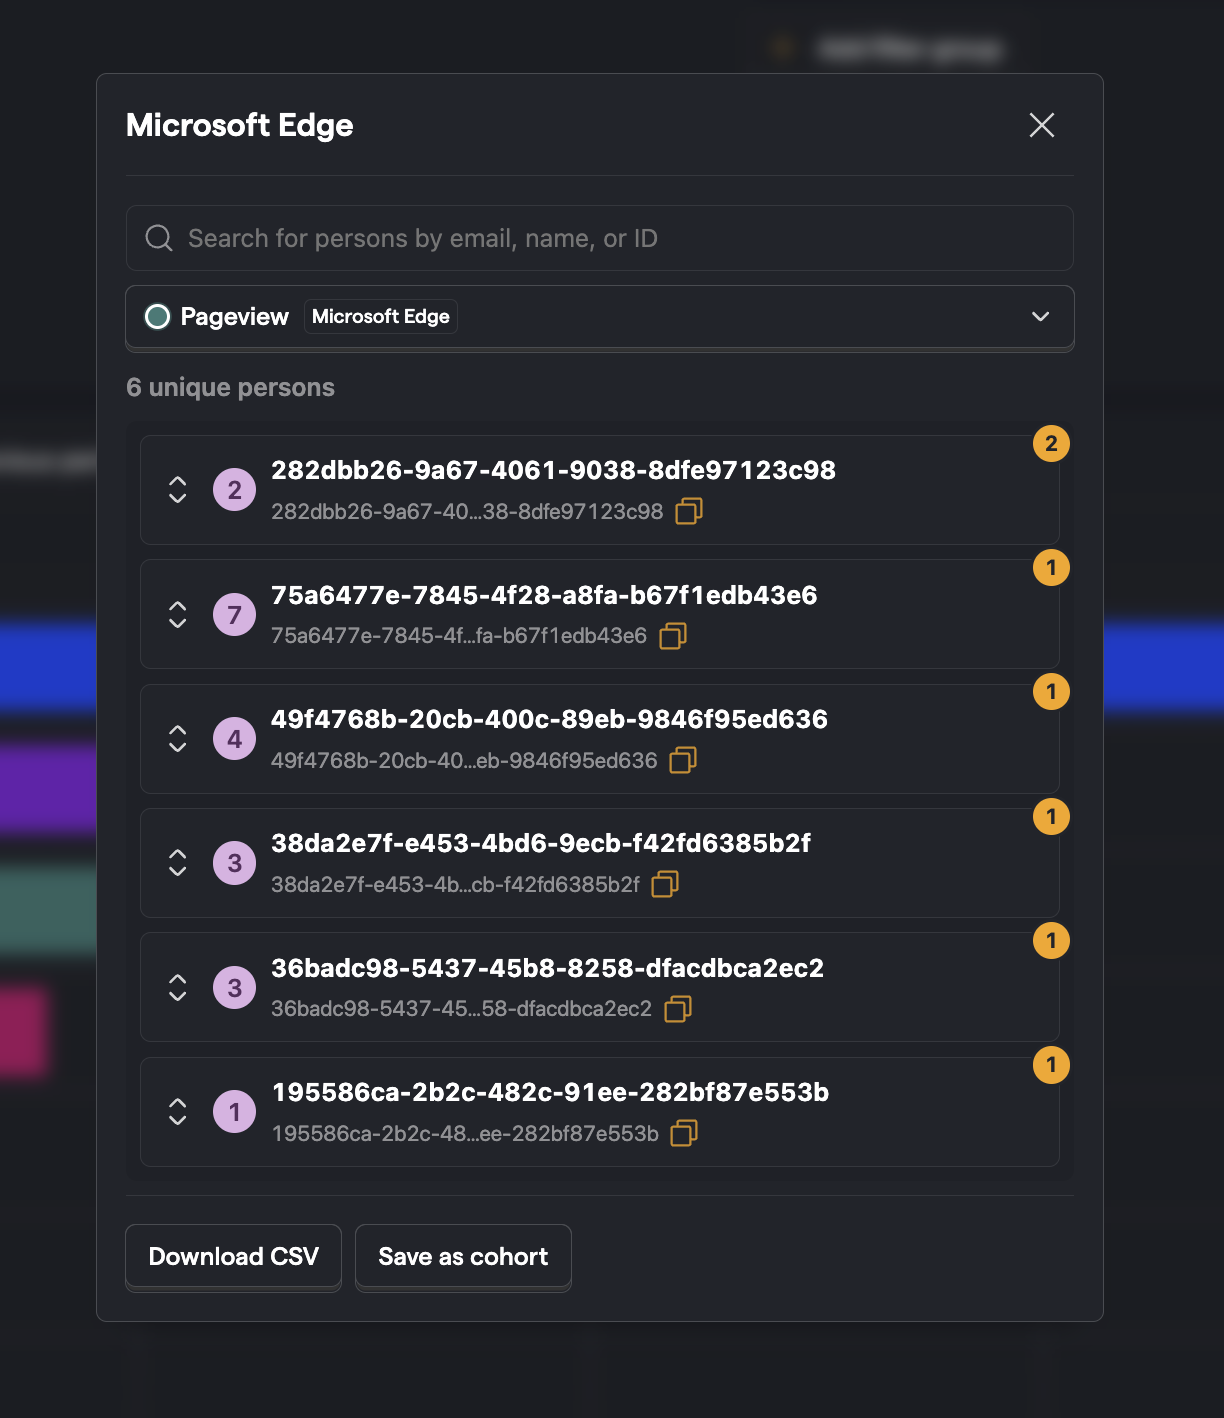
From this menu, you can:
- Watch specific session replays where the user performed the selected event
- Dive deep into the properties of each individual user
- Save the entire list of users as a cohort
- Export the list of users to a CSV for further analysis
Creating insights in notebooks
You can create all of PostHog's insight types natively in Notebooks. These include trends, funnels, retention, paths, stickiness, lifecycle, and SQL.
Each of them can be completely customized within notebooks like you would in insights. To do this, click the three-line reverse pyramid icon.
You can also add insights from the insights list by clicking, holding, and dragging the title onto the right-side popover.
Add units / custom prefixes and postfixes
You can change the unit of any trends insights, or add custom prefixes/postfixes - e.g. with a prefix of $, 123.45 will be displayed as "$123.45".
Units include duration (seconds or milliseconds), percentage, currency, and short number. The short number format displays large numbers in compact form (e.g., 1,200 as "1.2K", 1,500,000 as "1.5M").
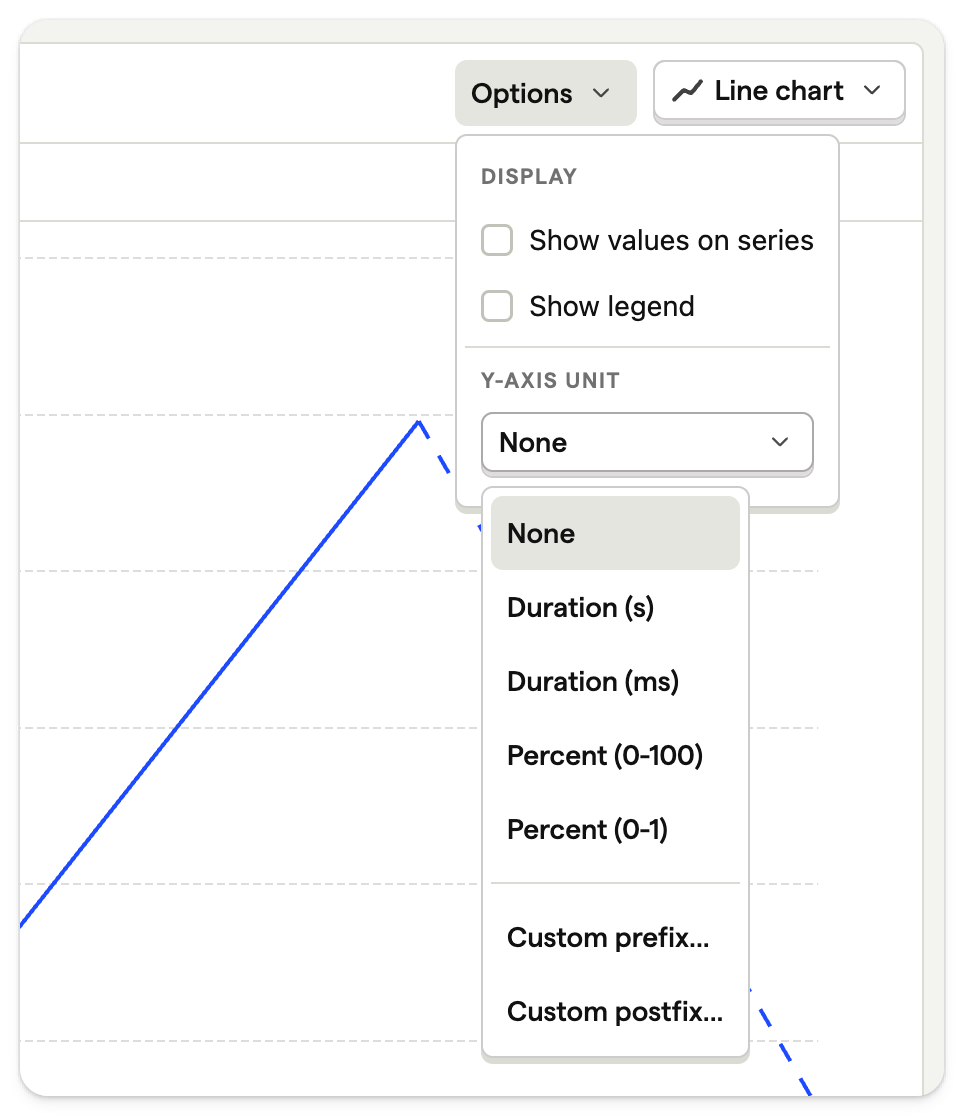
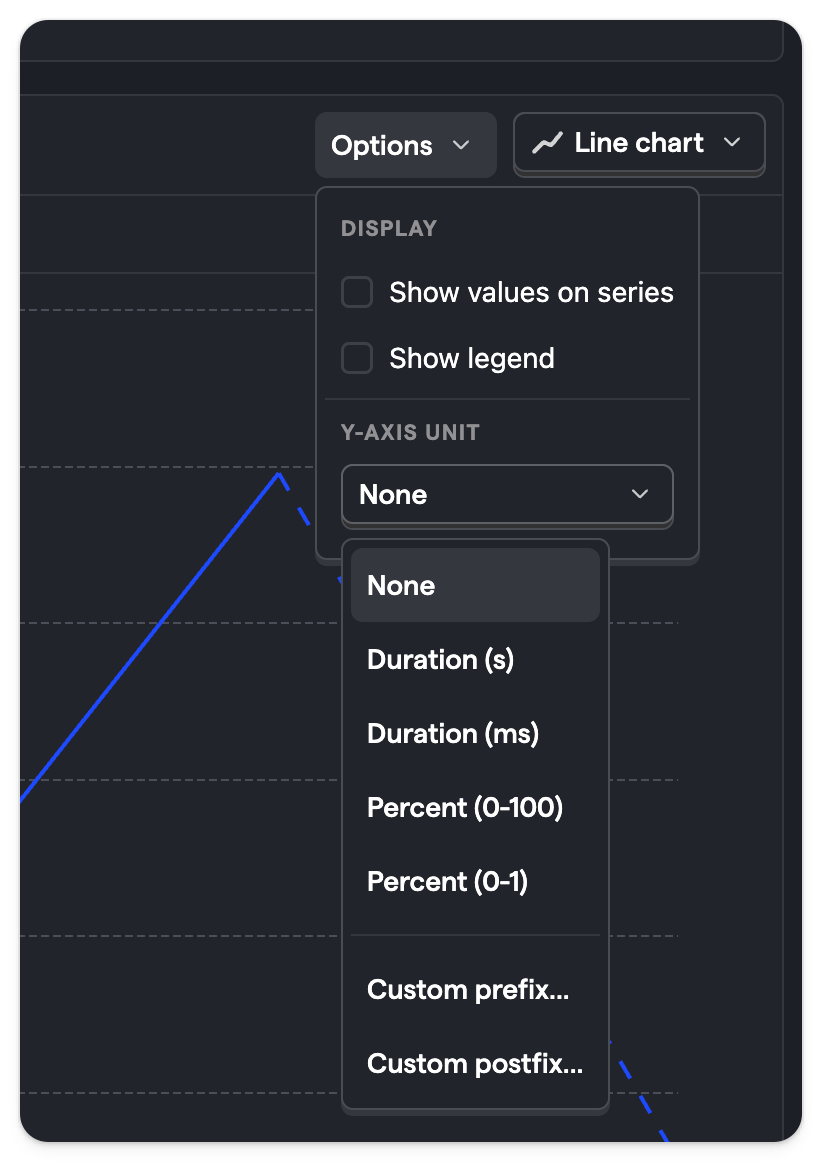
To do so, click on 'Options' dropdown next to the chart type and select the one you want.
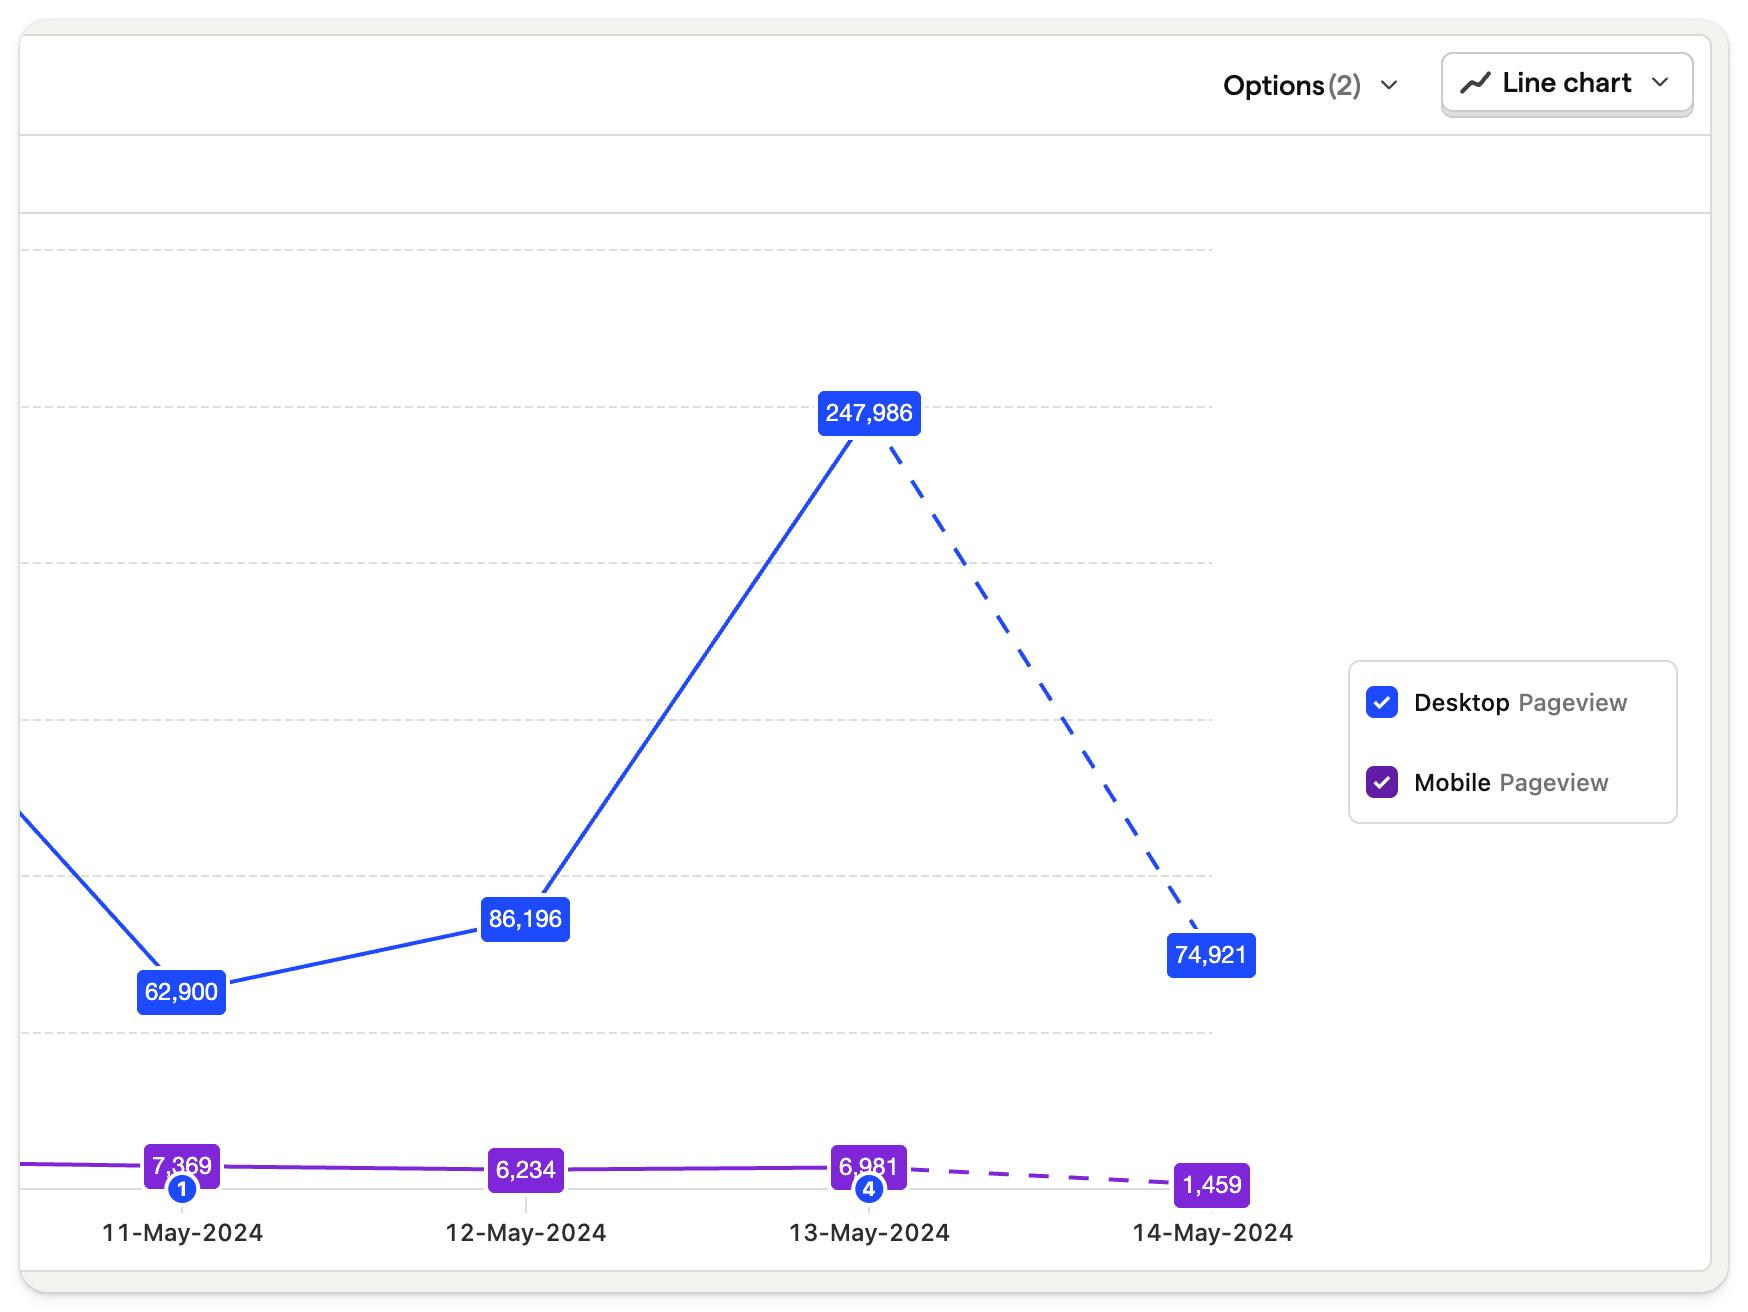
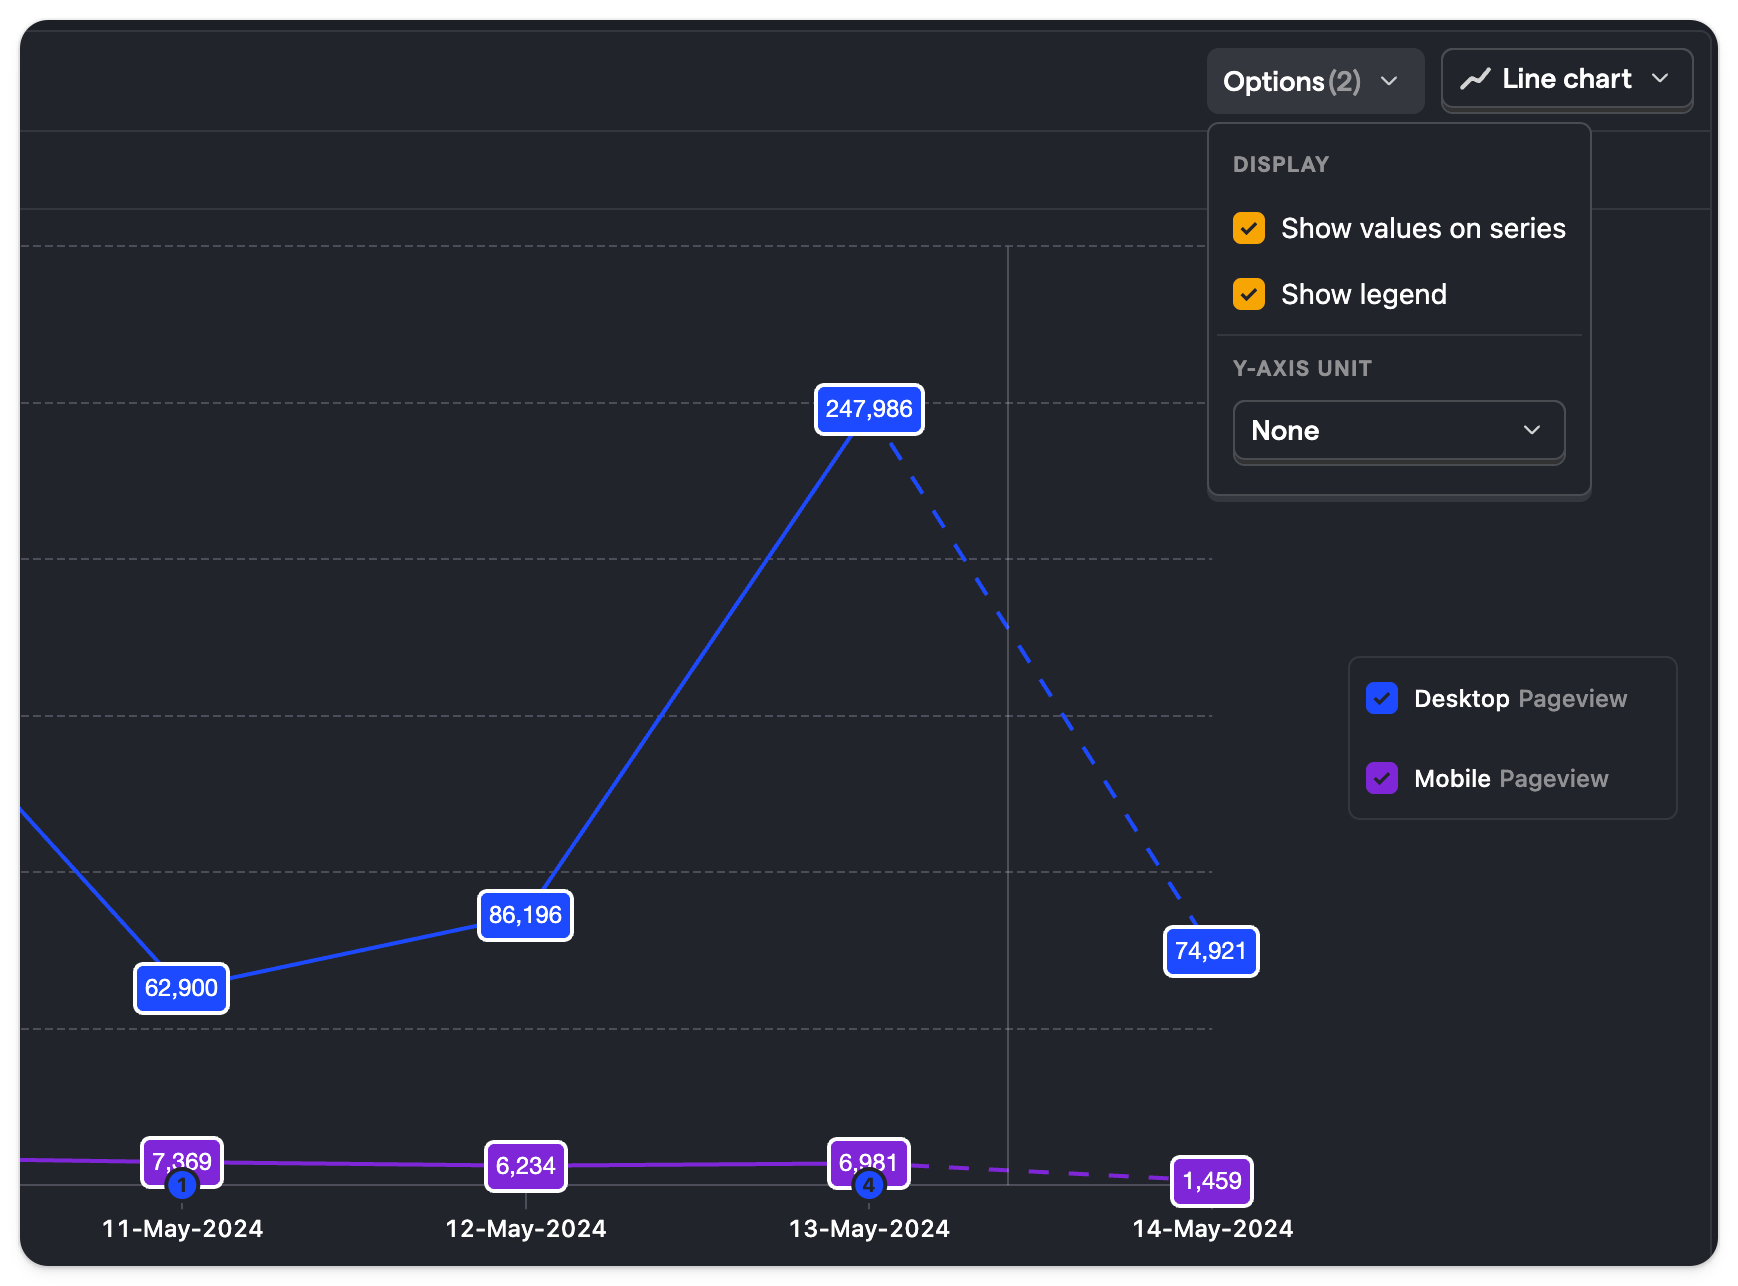
Also under the 'Options' dropdown is the ability to enable values on trends, and the legend, like in the screenshot above.
Toggle series visibility in the legend
When the legend is enabled, you can click the checkbox next to any series to toggle its visibility on the chart.
For charts with many series, right-click on a legend item to open a context menu with additional options:
- Hide other series – hides all other series and isolates the one you right-clicked
- Show all series – makes all series visible again
- Hide all series – hides every series on the chart
Hide weekend data
You can hide Saturday and Sunday data points from time series charts. This is useful for B2B products where weekend traffic is noise and obscures weekday patterns.
To enable it, click the Options dropdown next to the chart type, then check Hide weekend data under the Display section. When enabled, weekend events are excluded from the query and the corresponding date buckets are removed from the chart's x-axis. A "Weekend data excluded" badge appears below the insight to confirm filtering is active.
This works with day-level intervals. For hour, minute, week, or month intervals, weekend filtering is not applied since those buckets span multiple days or would lose all data on weekend days.
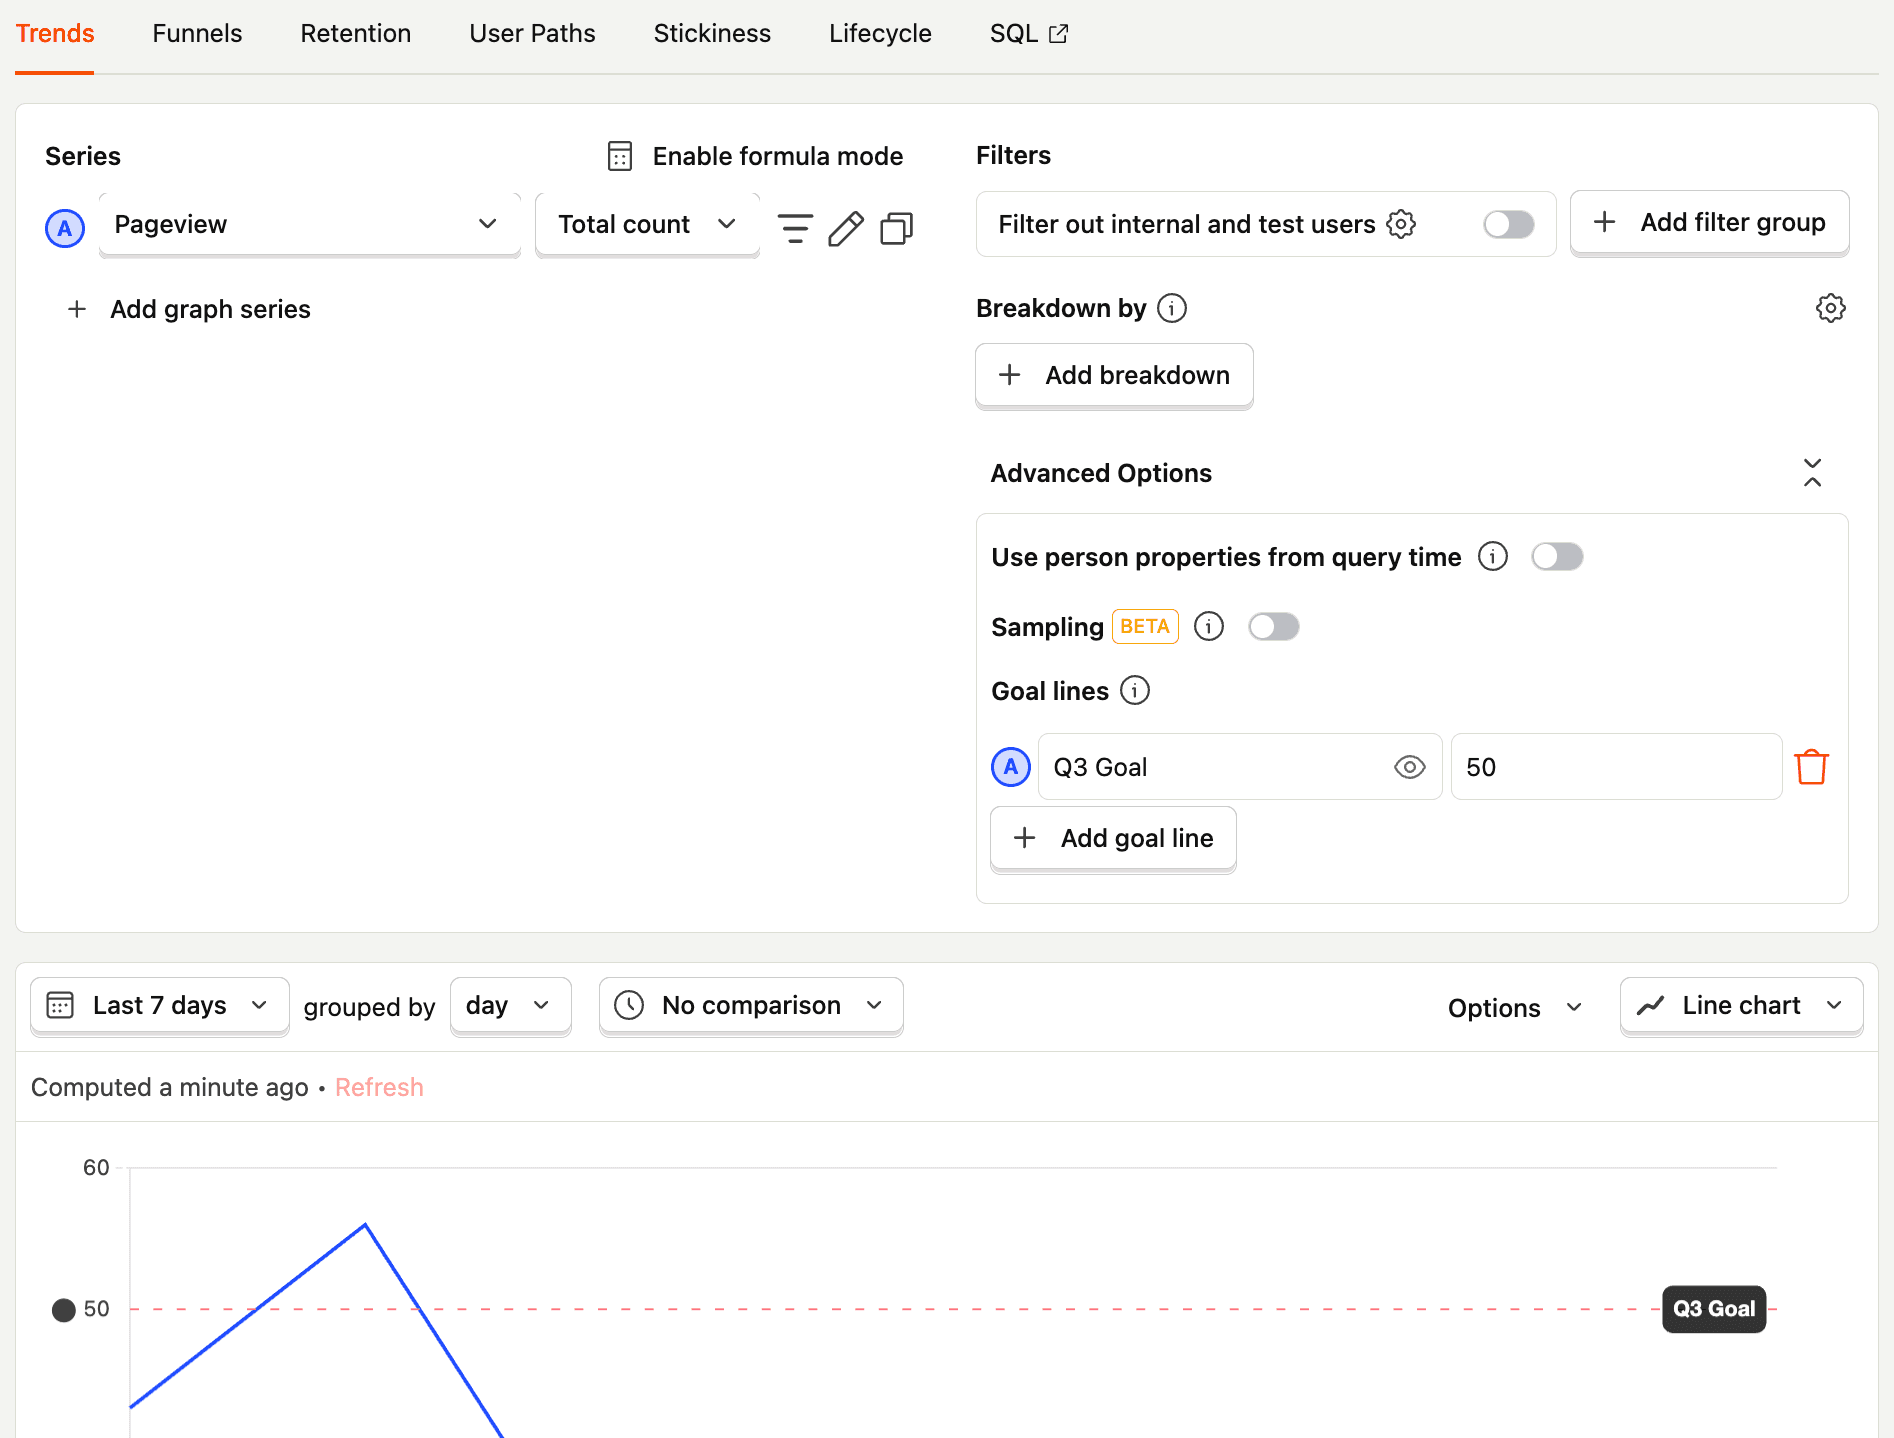
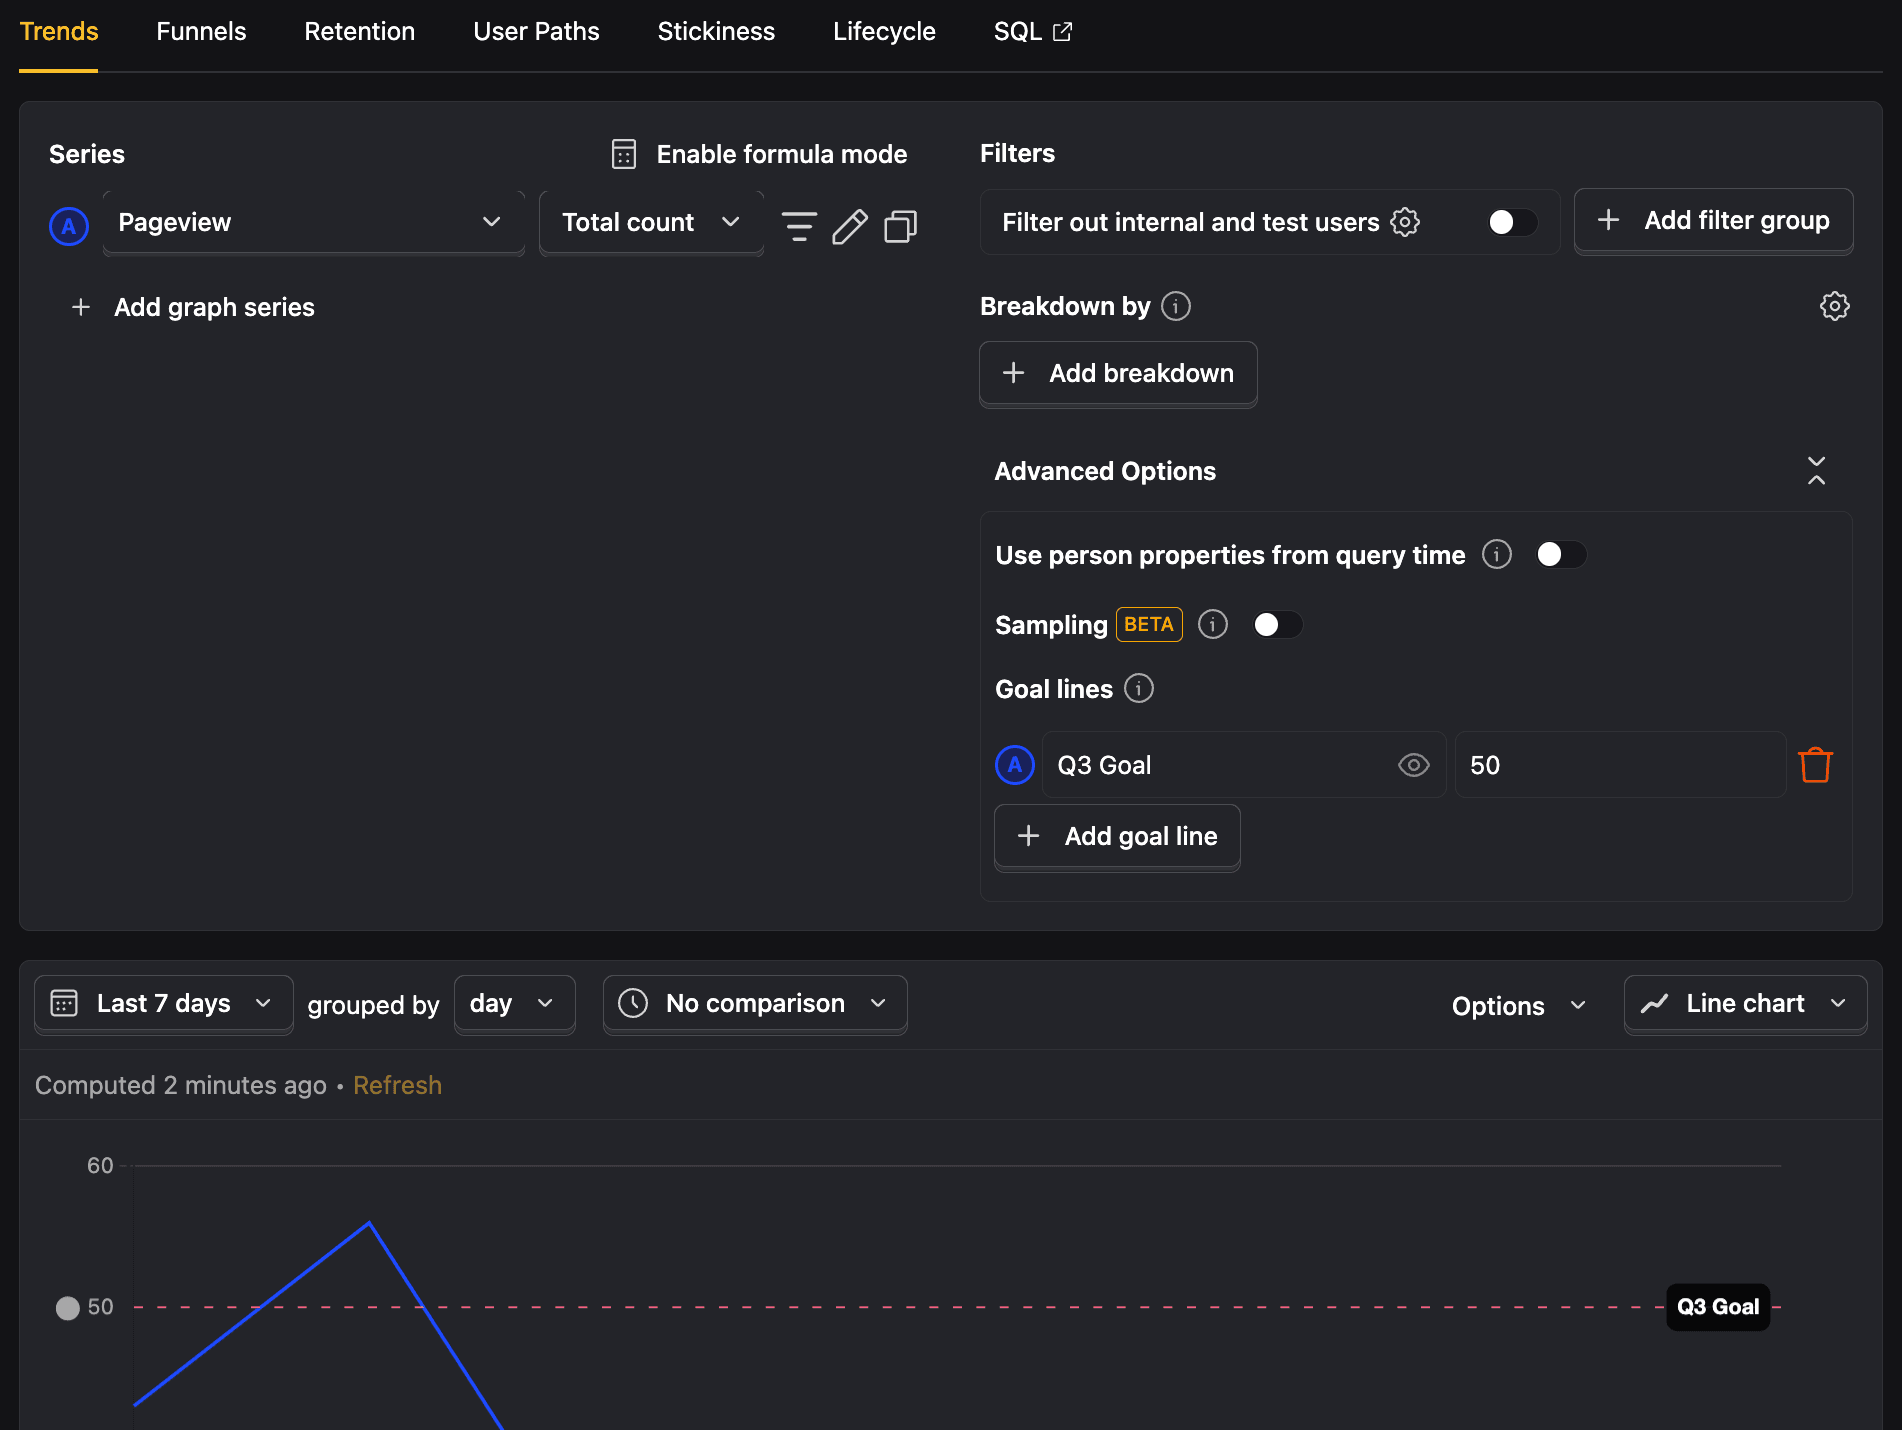
Set goal lines
You can add goal lines to any trend line insight by clicking on Advanced Options, then + Add goal line, and then entering a value. This is helpful for highlighting quarterly KPIs, limits, and more.
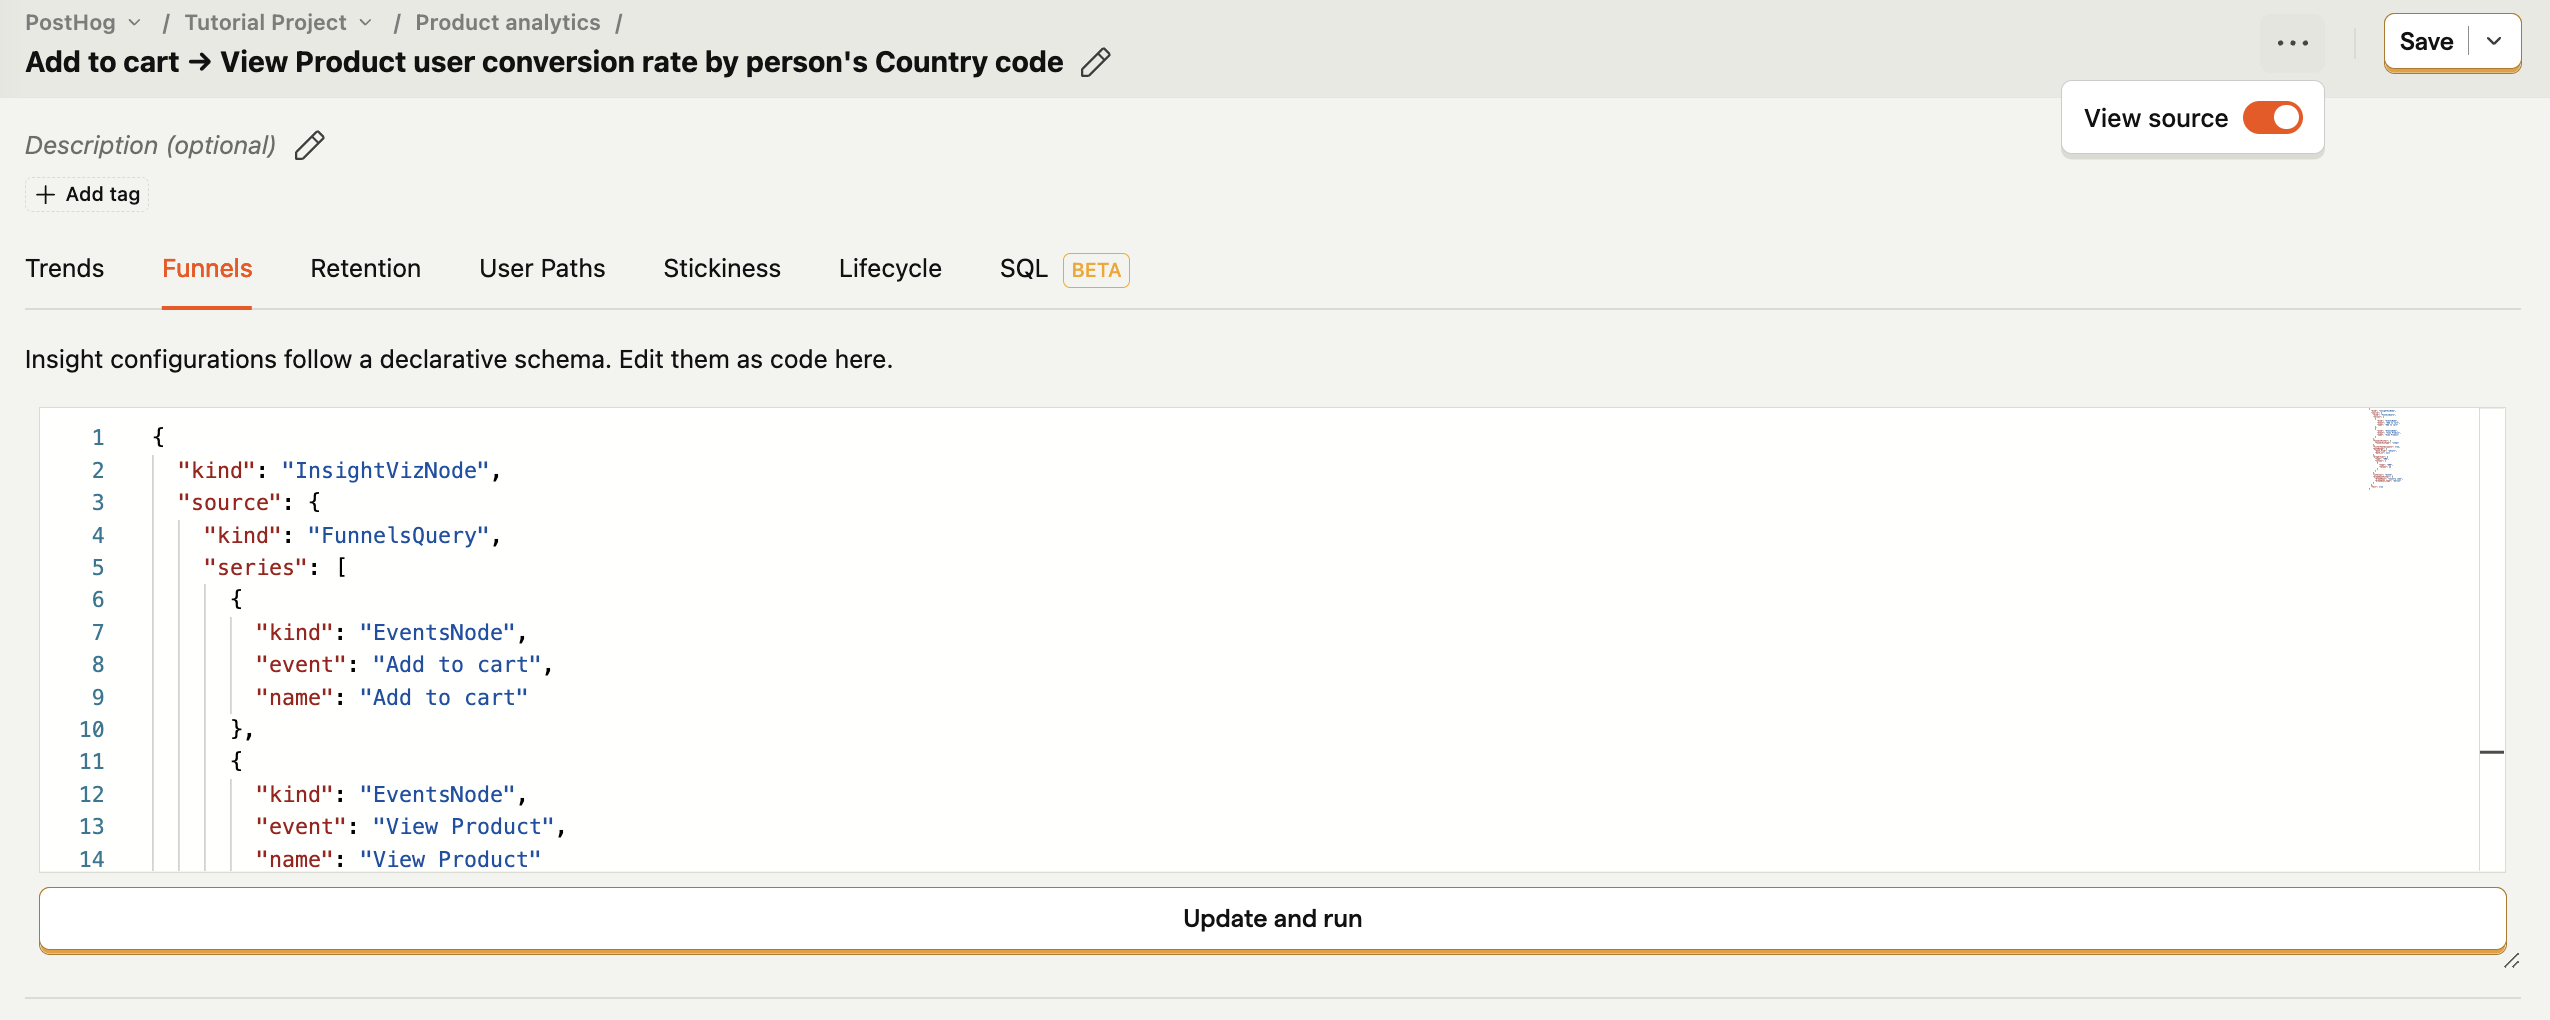
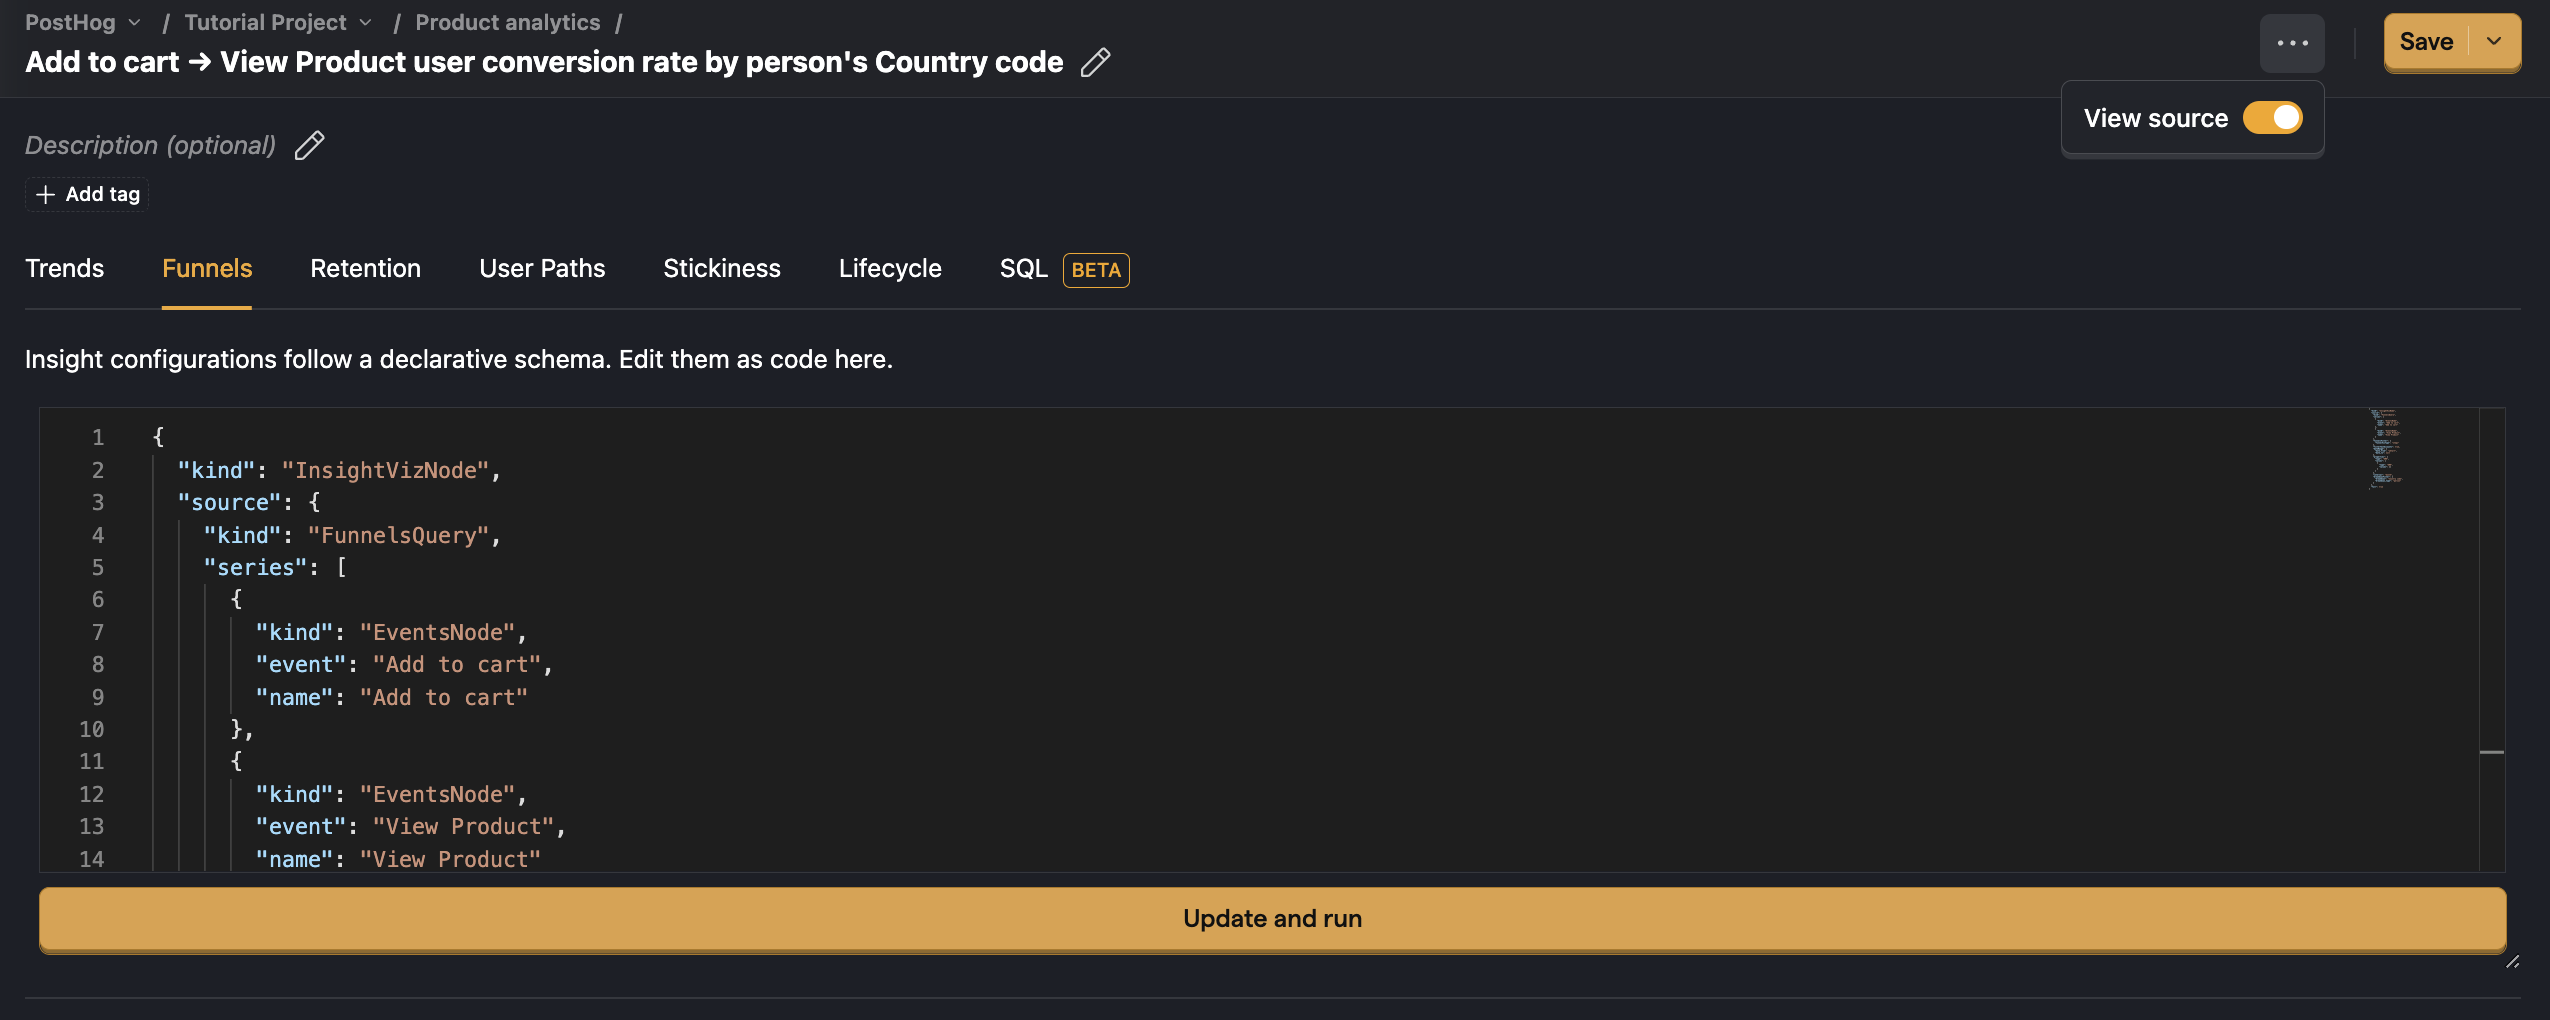
View source (Beta)
Insight filters follow a declarative format that you can view and edit. To do so, open the insight editor by clicking on the {} icon next to the save insight button and you will see the source for the current insight configuration.
Using this editor you can copy-and-paste complete or partial insights and understand what is going on under the hood. We admit this is a bit of a power user feature, but if you're so inclined you might even find it easier to edit insights this way.
See our full list of PostHog tutorials for more guides and tips.