





Alerts
Contents
Alerts enable you to monitor your insights and get notified when something important changes. You can set fixed thresholds (e.g., notify me when unique visitors exceed 5,000) or use anomaly detection to automatically flag unusual patterns in your data.
Alerts are supported on trends, funnels (steps and trends views only), and SQL (HogQL) insights.
Free tier organizations can create up to 5 alerts total. Paid plans have no limit.
Use cases
Since alerts work on trends, funnels, and SQL (HogQL) insights, you can monitor nearly any metric you track in PostHog. Common use cases include:
Monitor traffic spikes – Get notified when pageviews or unique visitors exceed normal levels. Useful for catching viral content, measuring marketing campaign impact, or detecting unexpected load.
Track errors and 404s – Alert when error rates or 404 page visits spike above a baseline, indicating broken links, failed deployments, or degraded user experience.
Detect missing critical events – Alert when expected events like transactional emails, payment processing, or critical workflows drop below a threshold or stop entirely. Set a has value alert with a less than bound of 1 to catch these.
Monitor conversion rate changes – Track when signup, purchase, or other conversion rates shift significantly. Use a formula-based trend with a increases by or decreases by alert and a percentage threshold.
Watch for shifts in traffic sources – Use a trend with a breakdown on referral source, then set an alert to detect when any source increases or decreases by a set amount. See alerts on breakdowns for details.
How to create an alert
Open or create a saved trend, funnel, or SQL insight.
On the insight, click Monitor and select Alerts. This shows the alerts for that insight.
Click New alert.
Set a name for the alert.
For a trend, select the series to monitor. A series is one of the events or values in the insight. For example, an insight can have
A - $pageview(total pageviews) andB - signed_up(signups). SelectAto check pageviews orBto check signups. For a funnel or SQL insight, select the conversion step or result to check.Select Threshold or Anomaly detection. For a threshold alert, choose a condition:
- has value compares the value with a fixed bound.
- increases by or decreases by compares the value with a prior period.
For a threshold alert, set at least one bound: more than, less than, or both. For example, set more than to 5,000 to check when pageviews exceed 5,000.
For increases by or decreases by, you can set a percentage threshold. PostHog compares the percentage change with your bound. For anomaly detection, choose a detector and simulate it.
Select how often PostHog checks the alert:
- Real time requires a Scale or Enterprise plan. It checks about every two minutes. See real-time alerts.
- Every 15 minutes requires a Boost plan or higher.
- Hourly lets you set the minute of the hour for each check.
- Daily checks once a day.
- Weekly checks once a week.
- Monthly checks once a month.
The form shows the next planned evaluation.
Select the users to notify. Subscribed users get in-app notifications when the alert fires. You can also add email recipients, Slack channels, Discord webhooks, Microsoft Teams channels, or webhook URLs in the alert form. See notifications.
Click Create alert. Open Monitor > Alerts on the insight to review or edit its alerts. Open Alerts from the sidebar to manage alerts across insights.
Create alerts with AI
The MCP server is the most complete way to create and manage alerts with natural language. It works from your AI coding agent and supports trends, funnels, and SQL (HogQL) insights, for both threshold and anomaly detection alerts.
Example prompts:
- "Create an alert when daily signups exceed 1000"
- "Alert me if the checkout funnel conversion rate drops below 20%"
- "Notify our team in Slack when error rate increases by more than 25% week over week"
- "Create a SQL alert if this query's result drops below 10000"
- "Set up an anomaly detection alert on our signups trend using Z-score"
- "Set up an ensemble alert using Z-score AND Isolation Forest on daily signups"
- "Simulate a MAD detector on my revenue insight for the last 30 days"
- "List all my alerts and their current state"
- "Update my pageview alert threshold to 5000"
- "Delete the old conversion alert"
PostHog AI
You can also create and manage alerts using PostHog AI with natural language commands, without leaving the app. Open PostHog AI from anywhere in the app and describe the alert you want.
Example commands:
- "Alert me when daily signups drop below 100"
- "Create an alert when pageviews increase by more than 50%"
- "Notify me if revenue drops more than 20% week over week"
- "Change my alert threshold to 200"
- "Disable the signups alert"
Relative alerts
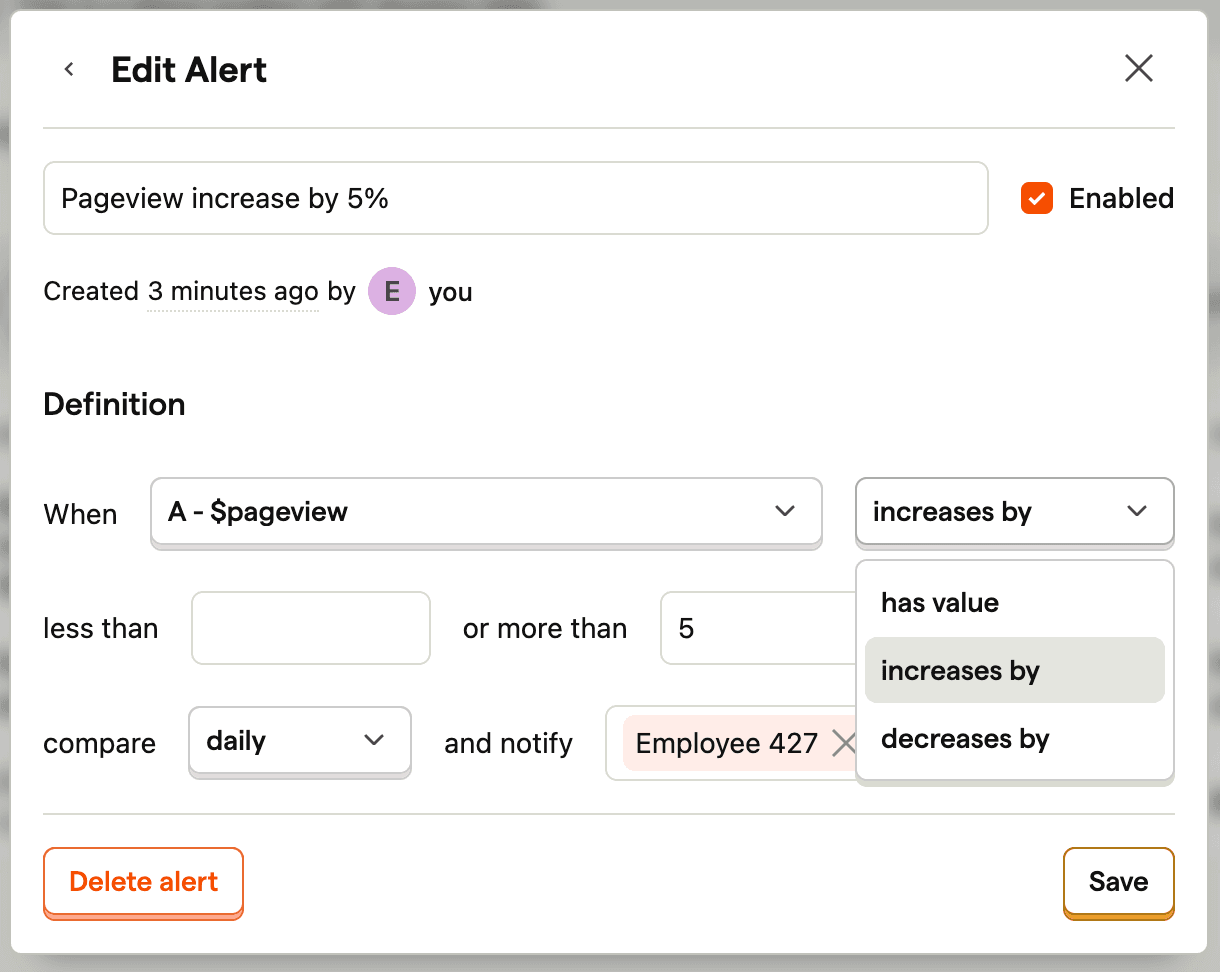
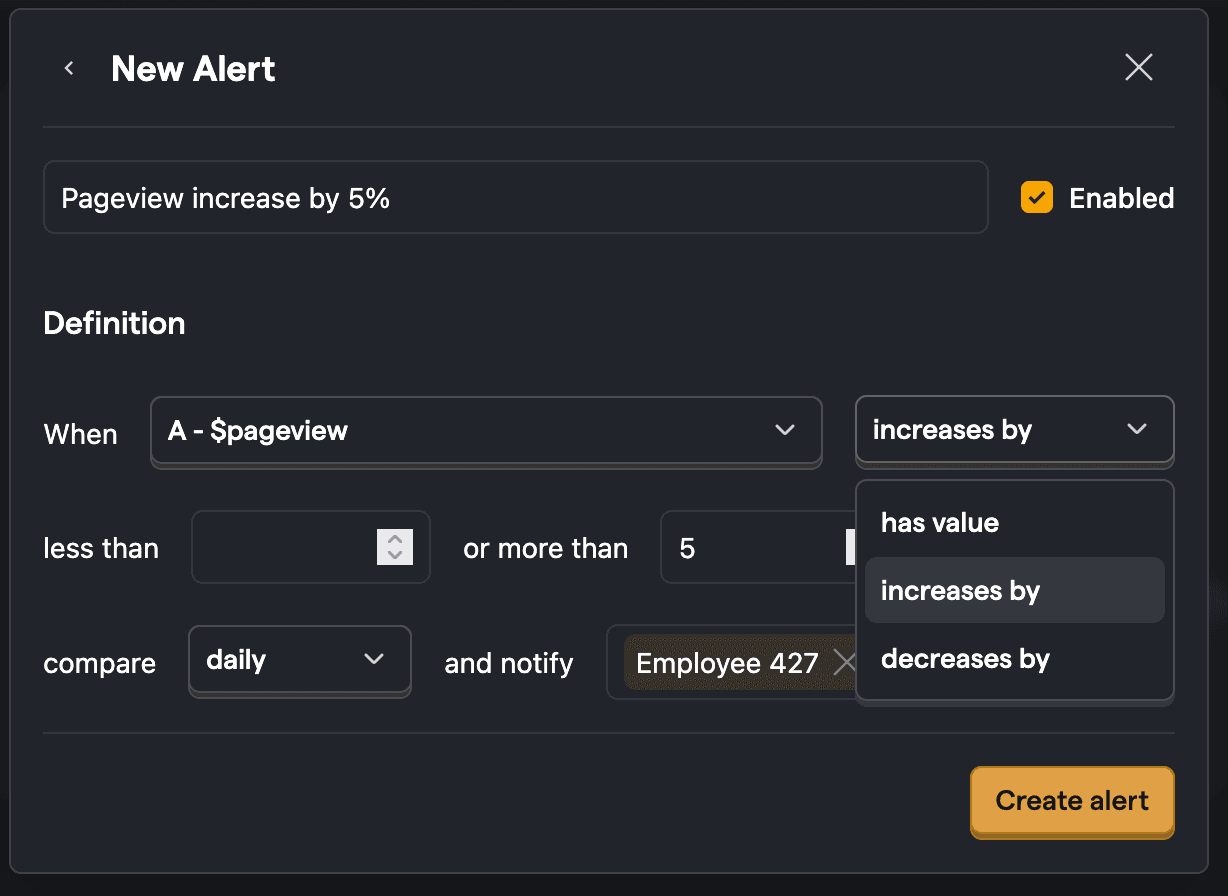
Relative alerts check for change in the value of an insight. For example, if a value increases by 5% in a week. To create a relative alert, you just need to change the has value option to increases by or decreases by. This will then also enable you to set a percentage threshold.
Thresholds
We support both absolute value thresholds (insight value more than or less than a certain number) or percentage thresholds (insight value changed by a certain percentage). Percentage thresholds are only available for relative alerts (as you need to compare two values to figure out percentage change).
Real-time alerts
To create a real-time alert, follow the standard alert creation steps and select Real time as the check frequency.
- Evaluates approximately every two minutes, rather than continuously. Notifications follow successful checks, not individual events.
- Best suited to metrics where minutes matter, such as error spikes, checkout failures, or sudden traffic drops. For most metrics, a less frequent interval is sufficient and reduces notification noise.
- Requires a Scale or Enterprise plan. This is separate from the every-15-minutes interval, which only needs a Boost, Scale, or Enterprise add-on.
- Has its own limit on how many real-time alerts you can have enabled at once, separate from your overall alert limit. If you hit it, disable an existing real-time alert or switch it to a less frequent interval to free up a slot.
- Scale: 10 real-time alerts
- Enterprise: 20 real-time alerts
Alerts on funnels
You can create alerts on funnel insights to monitor conversion rates. Funnel alerts track the overall conversion rate percentage and notify you when it crosses your defined thresholds.
Funnel alerts work with:
- Steps view – the standard funnel visualization showing conversion between steps
- Trends view – funnel results displayed as a trend over time
Funnel alerts are not supported for:
- Time-to-convert view – measures duration rather than conversion rate
- Flow view (sankey) – visualizes user paths without a single conversion rate metric
When creating a funnel alert, the threshold values represent the conversion rate percentage. For example, setting a "less than 10" threshold triggers when the funnel's conversion rate drops below 10%.
In the steps view, select the conversion step to monitor. This view supports fixed thresholds, not relative changes or anomaly detection. In the trends view, the alert monitors the overall conversion rate over time and supports relative changes, but not anomaly detection.
Alerts on SQL insights
Save a SQL (HogQL) insight before you create an alert. If the query returns multiple columns, select a numeric value column to check. You can also select a label column to name the checked row in notifications and check history.
- The last row checks the last result row. Use it when the query sorts from oldest to newest.
- The first row checks the first result row. Use it when the query sorts from newest to oldest.
- Any row checks each result row and fires when any value crosses the threshold. Use it when each row represents a separate item. This mode supports fixed thresholds only; it does not support relative conditions or anomaly detection.
Preview the query result and selected value before you save the alert.
Anomaly detection
Instead of setting a fixed threshold, anomaly detection uses detectors to identify unusual changes in your data. This is useful when:
- You don't know what threshold to set (e.g., your traffic varies by time of day)
- You want to detect subtle changes that a fixed threshold would miss
- Your metrics have seasonal patterns that make static thresholds unreliable
Creating an anomaly detection alert
- Open a saved trend insight or SQL insight, or create and save one.
- For SQL insights, use last row or first row evaluation mode. Anomaly detection isn't supported with any row evaluation because those rows represent individual entities, not a time series.
- On the insight, click Monitor, select Alerts, then click New alert.
- Select Anomaly detection instead of Threshold.
- Choose a detector (see available detectors below).
- Configure the available options for your detector, such as sensitivity and window size.
- Use the Simulate section to preview how the detector performs on historical data before saving.
- Set your notification preferences and click Create alert.
Available detectors
PostHog offers statistical detectors, machine learning detectors, and an ensemble that combines detectors. For most use cases, Z-score or MAD are good starting points. The AI judgment detector is available separately for accounts with access to it.
Statistical detectors
| Detector | Best for | How it works |
|---|---|---|
| Z-score | General purpose | Flags points that are many standard deviations from the rolling mean. Uses first-order differencing by default to handle cyclical data. |
| MAD (Median Absolute Deviation) | Data with outliers | Similar to Z-score but uses median instead of mean, making it more robust to existing outliers. Uses first-order differencing by default. |
| IQR (Interquartile Range) | Skewed distributions | Flags values outside the interquartile range. Less sensitive to distribution shape than Z-score. |
| Threshold | Known fixed bounds | Flags values outside a static bound you set, rather than one learned from historical data. |
Machine learning detectors
These use the PyOD library and work well for more complex patterns:
| Detector | Best for | How it works |
|---|---|---|
| Isolation Forest | General purpose, high-dimensional | Isolates anomalies by randomly partitioning data. Anomalies require fewer partitions to isolate. |
| KNN (K-Nearest Neighbors) | Cluster-based patterns | Flags points that are far from their nearest neighbors. |
| LOF (Local Outlier Factor) | Variable-density data | Compares a point's local density to its neighbors. Good when "normal" varies across different ranges. |
| ECOD | Fast, no tuning needed | Uses empirical cumulative distribution functions. One of the fastest detectors with no hyperparameters beyond threshold and window. |
| COPOD | Multivariate data | Uses copula-based outlier detection. Fast and parameter-light. |
| HBOS (Histogram-Based Outlier Score) | Fast, large datasets | Builds histograms to estimate density. Very fast but assumes feature independence. |
| PCA (Principal Component Analysis) | Correlated metrics | Projects data into lower dimensions and flags points with high reconstruction error. |
| OCSVM (One-Class SVM) | Complex boundaries | Learns a boundary around normal data. Good when normal data forms an irregular shape. |
Ensemble detector
The Ensemble detector combines two or more of the above detectors with AND/OR logic:
- AND: Only fires when all sub-detectors agree a point is anomalous. Reduces false positives.
- OR: Fires when any sub-detector flags an anomaly. Catches more anomalies but may be noisier.
AI judgment
The AI judgment detector sends recent insight values and a chart to an AI model. You can add instructions to describe unusual behavior. The model returns a verdict and its confidence in that verdict; the confidence is not a calibrated anomaly probability.
This detector appears only when it is enabled for your account and your organization permits AI data processing. It cannot run with a real-time interval, monitor a breakdown, or join an ensemble. Each check uses a model call. Use simulation to assess its results before you save the alert.
Configuration
Statistical and machine learning detectors use these core parameters:
| Parameter | Description | Default |
|---|---|---|
| Sensitivity (threshold) | Anomaly score cutoff between 0 and 1. Higher values mean fewer alerts. | 0.9 |
| Window | Number of historical data points used for training. | Depends on interval (see below) |
Default window sizes based on your alert's check interval:
| Interval | Default window | What it covers |
|---|---|---|
| Hourly | 168 | 7 days |
| Daily | 90 | ~3 months |
| Weekly | 26 | ~6 months |
| Monthly | 12 | 1 year |
Preprocessing
Some detectors support preprocessing options:
- Differencing (
diffs_n): Transforms absolute values into changes between consecutive points. Enabled by default for Z-score and MAD detectors. This prevents normal daily/weekly cycles from being flagged as anomalies. - Lagging (
lags_n): Adds lagged values as additional features, giving the detector more temporal context. Useful for ML-based detectors like Isolation Forest or KNN.
Simulating a detector
Before creating an alert, you can simulate how a detector would perform on your insight's historical data. The simulation section appears below the detector configuration in the alert form.
The simulation shows:
- A chart with your data values and anomaly scores
- Red dots on points the detector would flag
- Statistics: total points analyzed, anomalies found, and anomaly rate
For ensemble detectors, the chart shows individual score lines for each sub-detector so you can see how they interact.
Use the date range dropdown to test the detector over different time periods (e.g., last 24 hours, last 7 days, last 30 days).
Tips
- Start with Z-score or MAD – they work well for most time series data and are straightforward to interpret.
- Use the simulator – always simulate before saving to see how the detector performs on your data.
- Set sensitivity to 0.95 for noisy metrics – the default of 0.9 may produce too many alerts for high-variance data.
- Use ensemble AND to reduce false positives – combining two detectors with AND logic means both must agree, which cuts down on noise.
- Differencing matters – if your data has regular cycles (e.g., more traffic on weekdays), make sure differencing is enabled. Z-score and MAD enable it by default.
Notifications
When an alert fires, each subscribed user automatically receives an in-app notification. Clicking the notification navigates to the associated insight. In addition to in-app notifications, alerts support email, Slack, Discord, Microsoft Teams, and webhook notifications that you can configure when creating or editing an alert.
Add Slack, Discord, Microsoft Teams, or webhook notifications
When creating or editing an alert, you can add notification destinations inline:
In the Destinations section, select Slack, Discord, Microsoft Teams, or Webhook from the dropdown.
For Slack notifications:
- If you haven't connected Slack yet, click Connect to Slack to set up the integration.
- Once connected, select the channel where you want alerts sent.
For Discord notifications:
- Enter your Discord webhook URL. You can create one in your Discord server settings under Integrations > Webhooks.
For Microsoft Teams notifications:
- Enter your Microsoft Teams webhook URL. You can create one in Microsoft Teams by going to your channel, clicking the three dots, selecting Workflows, and choosing Post to a channel when a webhook request is received. See the Microsoft Teams destination docs for more details.
For webhook notifications:
- Enter the webhook URL where you want alerts sent.
Click Add notification to add the destination.
Click Create alert or Save to apply your changes.
You can add multiple notification destinations to a single alert, up to five. Each destination appears in the list with its status.
Advanced options
You can skip weekend checks for real-time, 15-minute, hourly, and daily alerts. Weekly and monthly alerts do not support this option.
Quiet hours
Quiet hours let you define time windows when an alert won't be checked. This is useful for suppressing notifications during off-hours, such as nights or weekends.
To enable quiet hours, select Quiet hours in the alert form and configure one or more blocked time windows:

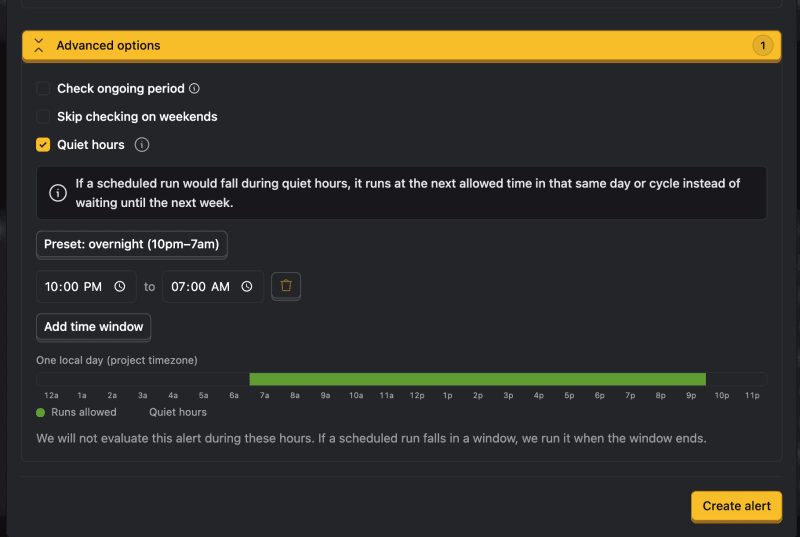
- Specify start and end times in HH:MM format (24-hour clock)
- Times are based on your project's timezone
- Each window must span at least 30 minutes
- You can add up to five time windows per alert
- If a scheduled check falls during quiet hours, the next check runs after the window ends
A preset for overnight hours (10 PM – 7 AM) is available for quick setup.
Check ongoing period
For supported trend and funnel alerts, Check ongoing period evaluates the current period before it ends. Use it when you need a check before the current week or month completes. The default checks the last completed period.
Alerts on breakdowns
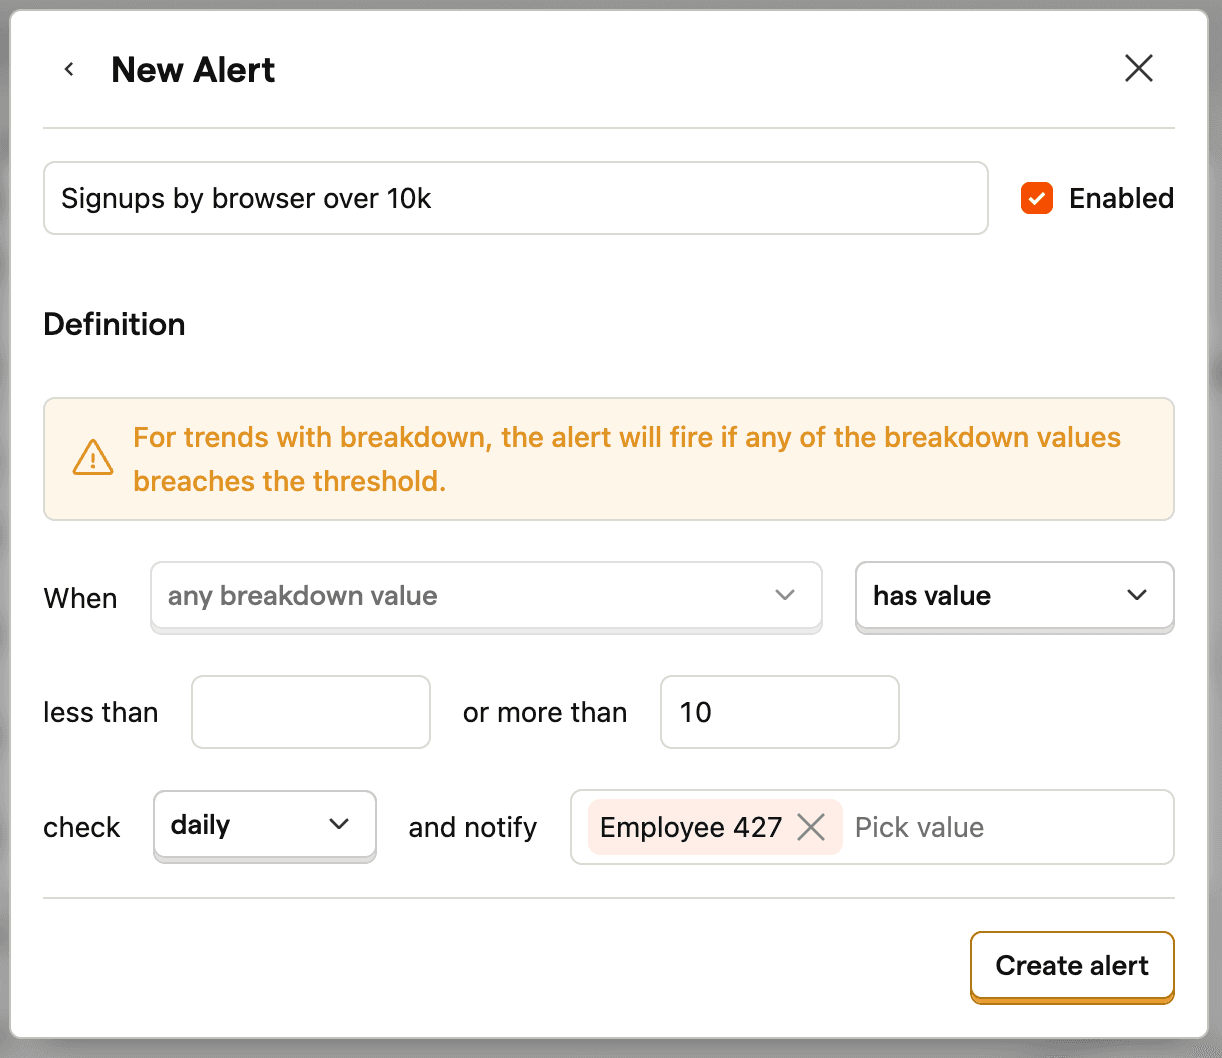
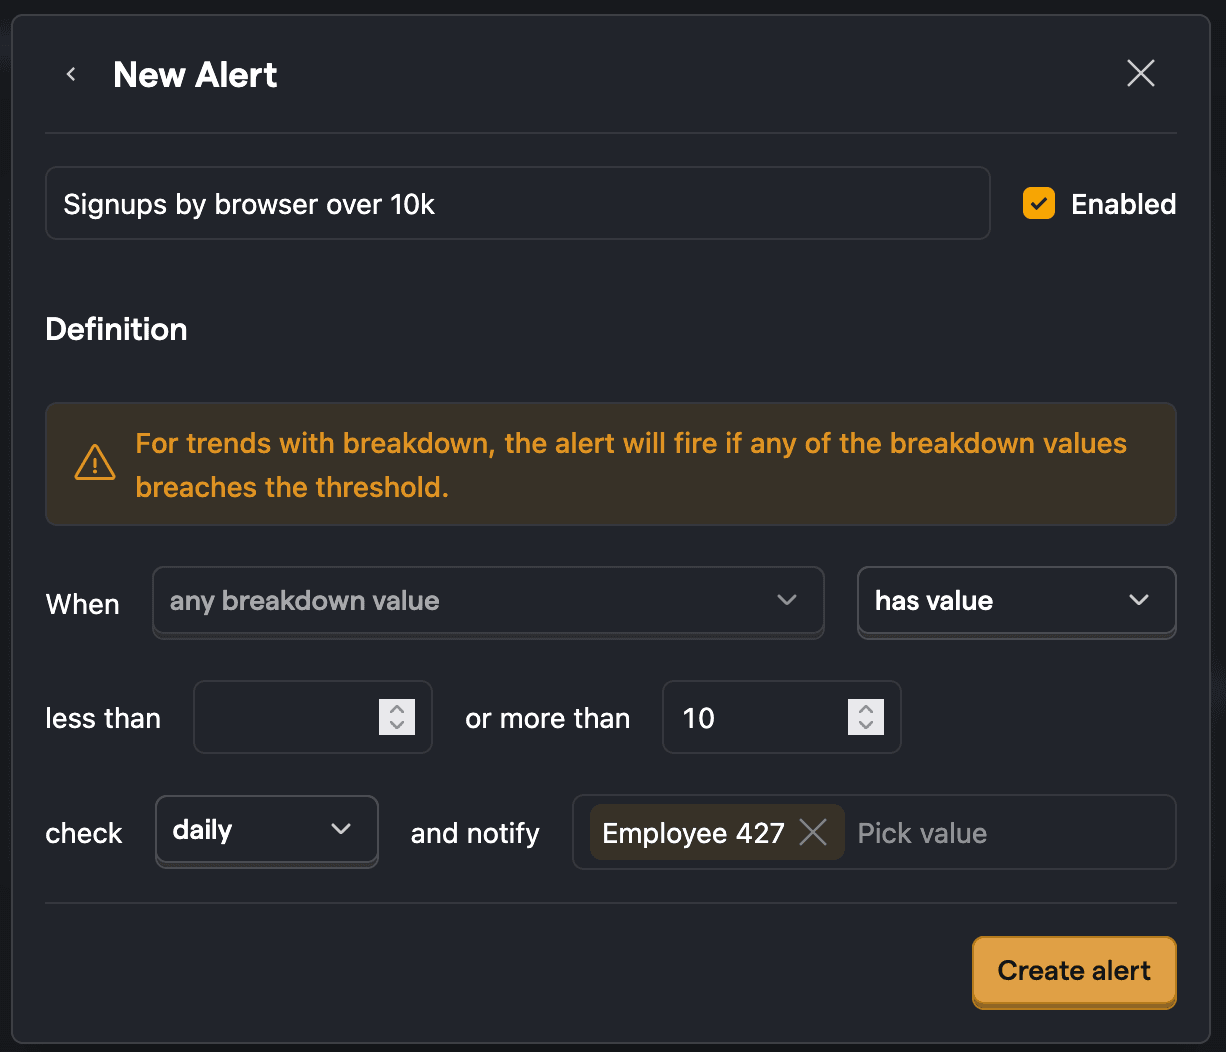
When you set an alert on a trend with a breakdown, the alert will be triggered when any of the breakdown values breaches the thresholds set.
Automatically disabled alerts
PostHog automatically disables alerts that have an invalid configuration. When this happens, subscribed users receive an email notification explaining the reason the alert was disabled.
Common reasons an alert may be auto-disabled:
- The insight was modified and is no longer compatible with the alert configuration (e.g., the insight query type changed from a trend to a funnel)
- The series referenced by the alert was removed from the insight
- A relative alert condition (increases by/decreases by) was set on a non-time-series trend (e.g., a pie chart or number)
- An absolute value alert was configured with a percentage threshold
- The alert has a missing or invalid check frequency (calculation interval)
- A threshold alert has no bounds set (neither a lower nor upper value was configured)
Disabled alerts don't re-enable themselves. After fixing the configuration issue, open the saved insight, click Monitor > Alerts, and manually re-enable the alert.
Further reading
For more ideas on how to get started with Alerts, check out our alerts examples.