


Dashboards
Contents
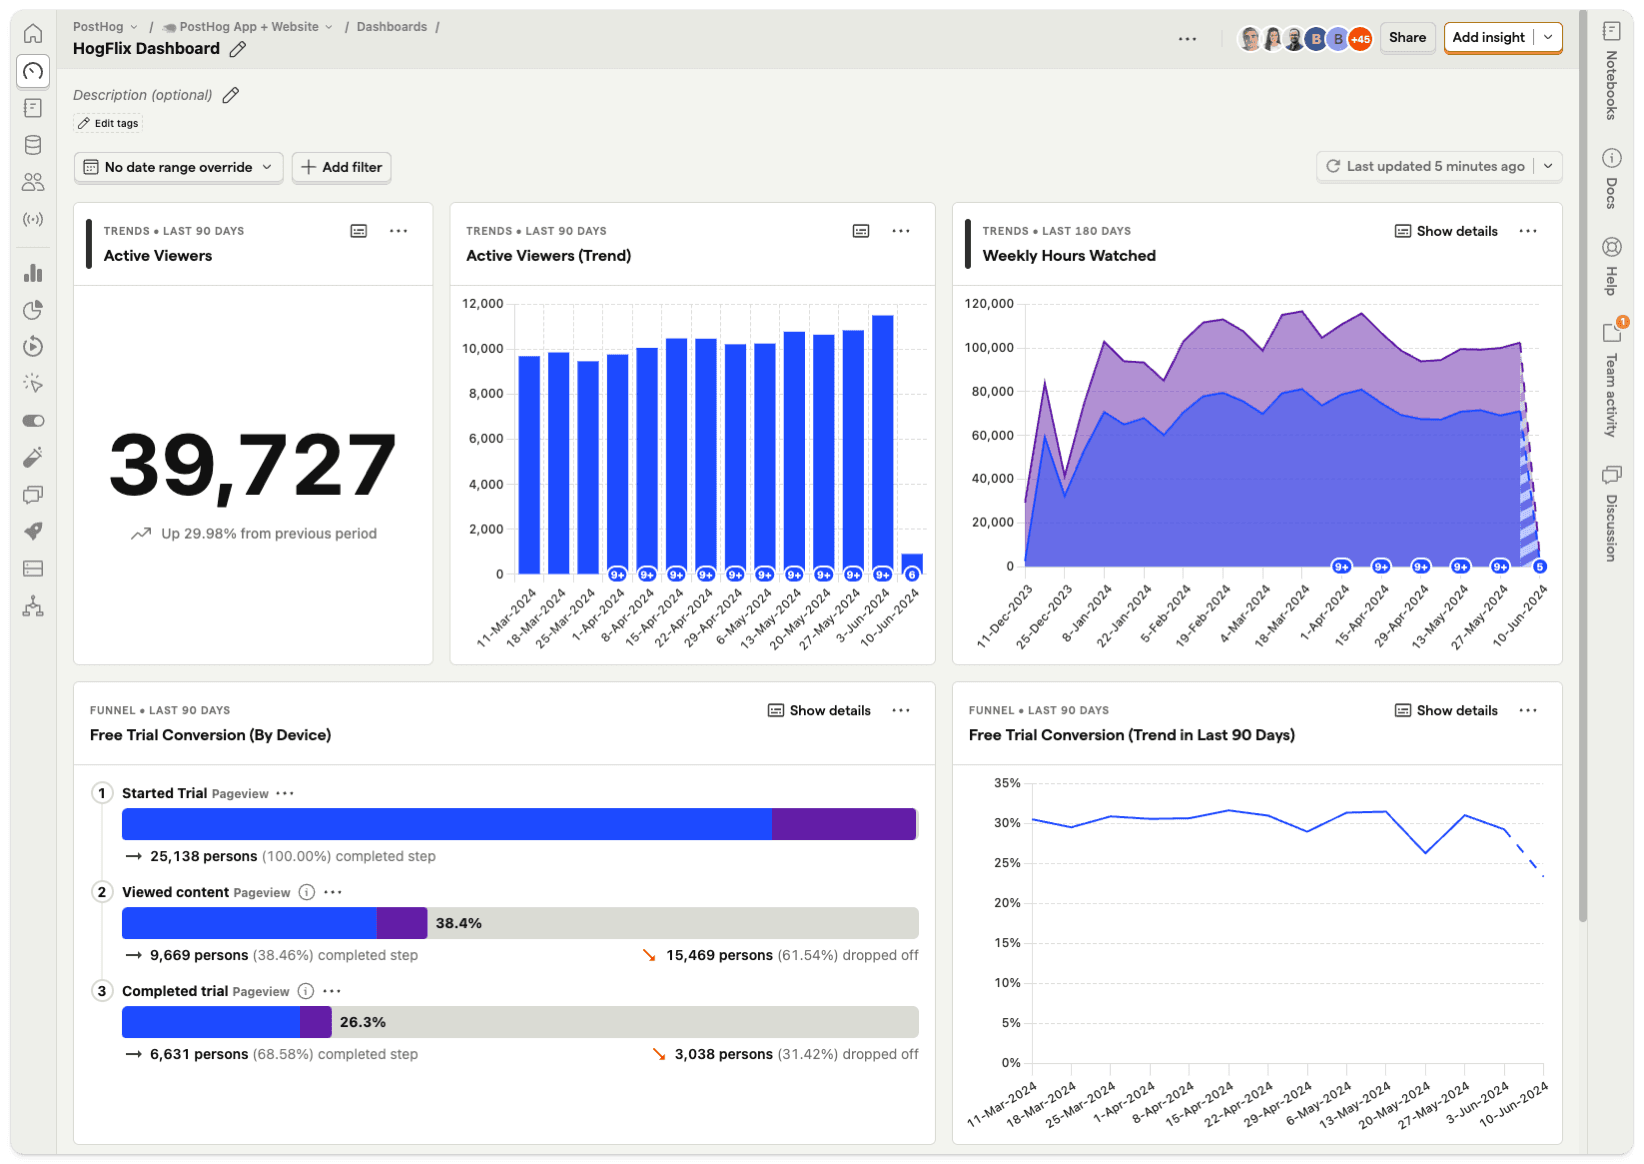
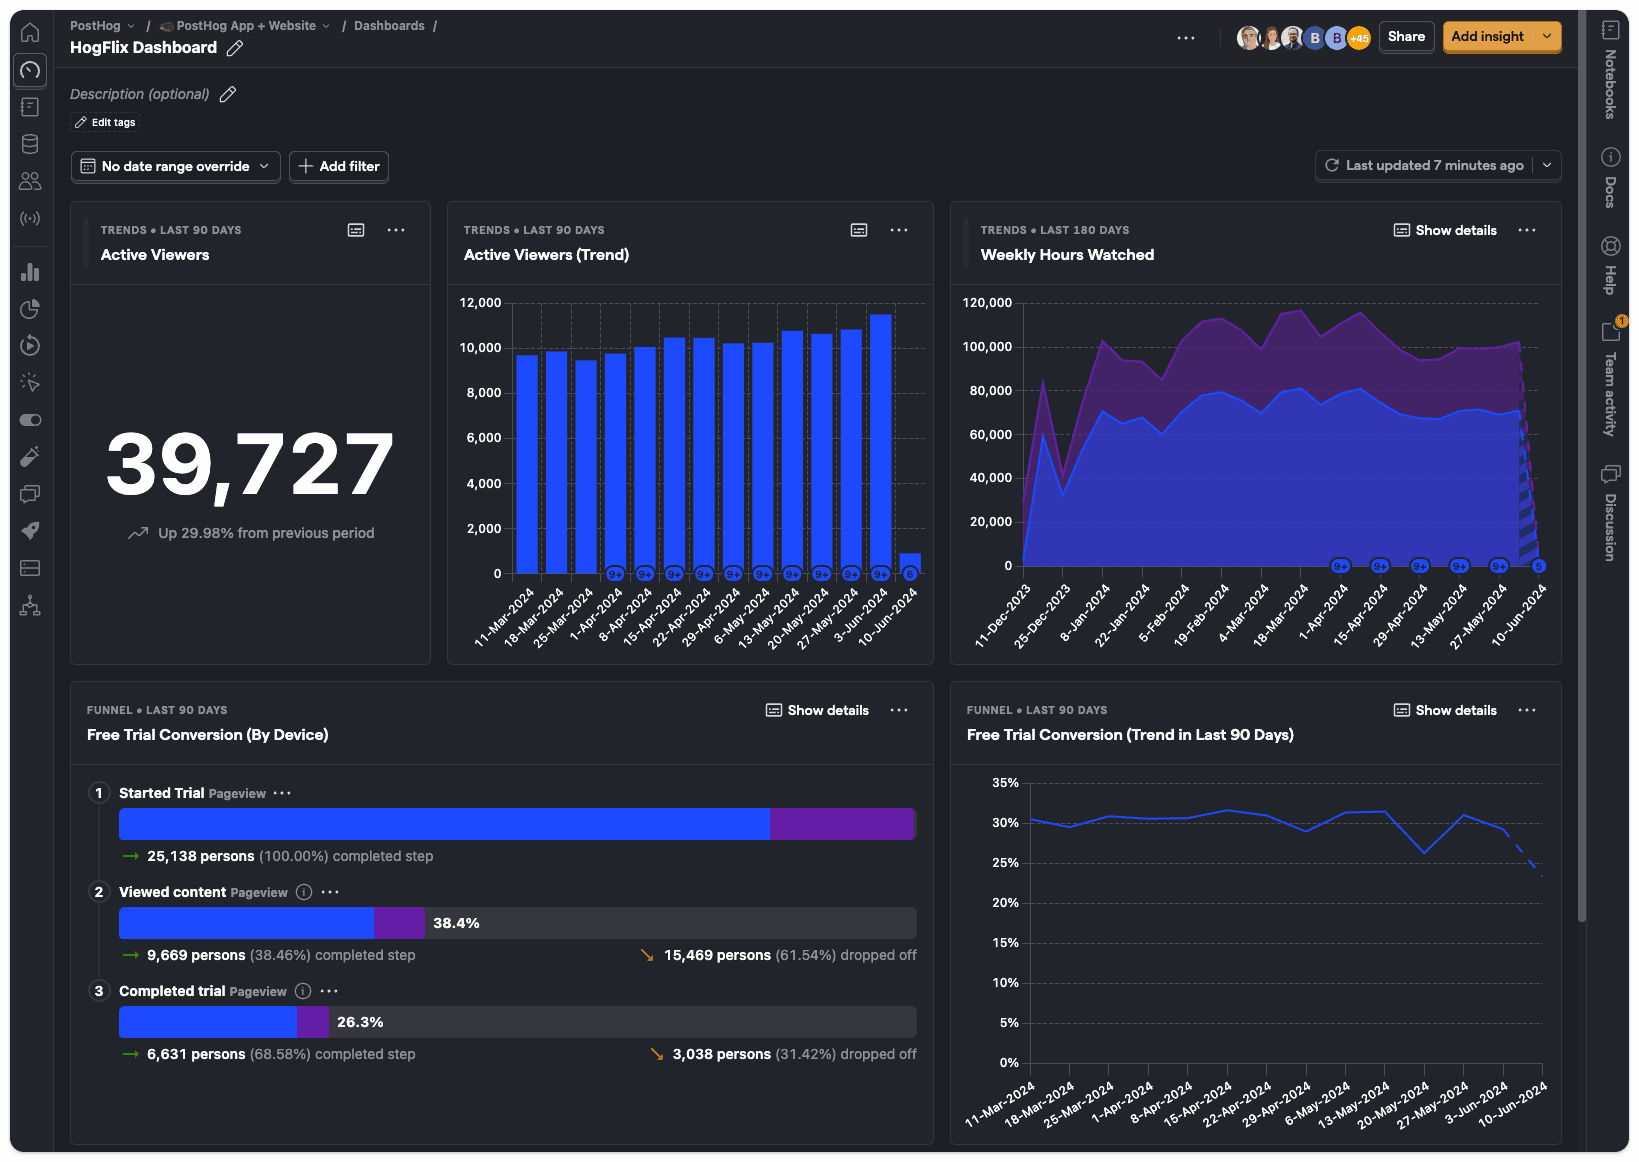
Dashboards are the easiest way to track all your most important product and performance metrics.
Unlike notebooks, which are ideal for ad hoc analysis of specific issues, dashboards are designed for tracking common metrics over time.
You can create a new dashboard from scratch, but we also offer numerous dashboard templates for tracking things like website metrics, product health metrics, and metrics for large language models.
Creating a new dashboard
- Click on Dashboards in the left hand navigation and then New Dashboard.
- You can create a dashboard from a list of available templates, or select Blank Dashboard to start from scratch.
- Name your dashboard, add some optional details if desired.
- Your dashboard will be empty – click +New insight to create an insight to add. Dashboards support all the core product analytics insights.
- Click Save & add to dashboard when you've created your insight.
If you already have some insights set up, an alternative approach is to click Add to dashboard in any insight.
Important: Insights can appear on multiple dashboards at the same time, so you don't have to create multiple copies of the same insight.
AI-powered starter prompts
When you create a blank dashboard, the empty state includes a set of AI-powered starter prompts. These cover common use cases like landing page performance, core web metrics, weekly marketing health, full-funnel tracking, and user research ops.
Click any prompt to open PostHog AI in the side panel with a pre-filled request. PostHog AI then builds the insights and adds them to your dashboard automatically.
Organizing dashboards into folders
You can organize dashboards into folders for easier navigation. There are two ways to move a dashboard into a folder:
- From the dashboards list page – Click the ... menu next to a dashboard and select Move to another folder.
- From an individual dashboard – Use the sidebar to move it to a folder.
Note: Moving a dashboard to a folder requires editor access.
The dashboards list page includes a Folder column that shows which folder each dashboard belongs to. Dashboards that haven't been filed into a folder display a dash (—).
Click a folder name in the Folder column to filter the list to dashboards in that folder. The active filter appears as a clearable chip in the filters bar. The folder filter is saved to the URL as a ?folder= query parameter, so filtered views persist across page reloads and can be shared with teammates.
Copying dashboards and templates between projects
You can copy dashboards and project-scoped dashboard templates from one project to another within the same organization. This is useful when you want to reuse work you've built without recreating it from scratch.
To copy a dashboard:
- Go to Dashboards and open the dashboard you want to copy.
- Open the actions sidebar.
- Click Copy to another project.
- Select the destination project.
- Configure the dependencies for the copy.
- Click Copy.
To copy a template:
- Go to Dashboards and open the Templates tab.
- Click the ... menu on the template you want to copy and select Copy to another project.
- Choose the destination project from the dropdown and click Copy.
A few things to keep in mind:
- Only project-scoped templates can be copied – global templates can't be copied this way.
- The source and destination must be different projects in the same organization.
- The copy is independent – changes to the original don't sync to the copy, and vice versa.
- If a dashboard or template with the same name already exists in the destination project, the copy is automatically renamed with a suffix like "(copy)", "(copy 2)", etc.
Dates and filters
Date range overrides
New dashboards are set to No date range override by default. This means all insights use the date range applied in their configuration.
Changing the date range on a dashboard forces all the insights to use the same date range, but this doesn't impact the date range that's shown when viewing an individual insight.
The date range can be accessed in SQL insights through the filters variable like filters.dateRange.from and filters.dateRange.to.
Dashboard filters
Dashboards also support most of the same filters as individual insights, including:
- Event properties: Properties stored on event, such as the
Current URLwhen the event was triggered. - Person properties: Properties of individual users, such as
company_name. - Feature flags: Filtering for users with a specific feature flag enabled.
- Group properties: Account-level properties, like
organization_id, which are only available if you have the group analytics add-on. - Cohorts: Filtering by cohorts of users you've already created.
Using filters on dashboards is a useful way to compare usage between different types of users without recreating insights over and over.
You could, for example, duplicate a dashboard – click on the '...' menu and click 'Duplicate' – and apply different filters to each version of the dashboard.
Filters can be accessed in SQL insights through the filters variable like filters.properties and filters.breakdown_filter.
Note: Dashboard property filter overrides are not applied to insights containing data warehouse series. A warning is displayed on the insight card when this happens. Date range overrides still work for all insight types.
Filter precedence: dashboard vs. tile level
Individual tiles (insights) can have their own filters and date ranges configured separately from dashboard-level overrides. When both are set, tile-level filters take precedence:
- Scalar settings like breakdown, interval, and filter test accounts: the tile's value completely replaces the dashboard override.
- Date ranges: If a tile has its own
date_fromordate_toset, its entire date range is used and the dashboard date override is ignored. - Property filters: Filters from both levels are combined using AND logic. However, if a tile filter directly contradicts a dashboard filter on the same property key, the tile filter wins and the conflicting dashboard filter is dropped.
The insight card displays a warning when tile filters are merging with or overriding dashboard filters.
Dashboard options
Editing the layout
If you have edit access to a dashboard, you can resize tiles directly without entering edit mode. Hover near any edge or corner of a tile to reveal resize handles, then drag to resize. Grabbing a handle automatically enters edit mode so the resize takes effect immediately. Corner handles support diagonal resizing.
For moving tiles and other layout changes, enter 'Edit layout' mode. You can do this in several ways:
- Tap 'E' on your keyboard
- Click on the '...' icon at the top of the dashboard and click 'Edit layout'
- Click on the '...' icon on any insight card and click 'Edit layout'
- Click or start dragging on any insight card, text card, or button tile (outside the interactive chart area)
Once in edit mode, press 'E' again to save your changes and exit edit mode, or press 'Escape' to discard changes and exit.
Tapping 'F' enables full-screen mode.
While in edit mode, you can click Collapse view to zoom out and see all tiles at a smaller size. This makes it easier to drag and rearrange items on large dashboards without excessive scrolling. You can also tap 'Z' to toggle collapsed view. When collapsed, you can drag tiles to rearrange them, but resizing is disabled. Click Expand view (or tap 'Z' again) to return to the normal size.
Note: On smaller screens, dashboard tiles are automatically stacked in a single column based on the desktop layout order. Layout editing (drag and resize) is only available on wider viewports.
Insight card options
Each insight card on a dashboard has a ⋯ menu with a Display options submenu. This provides access to the same display settings available in the insight editor's Options menu, so you can adjust how an insight displays without opening the full editor.
Available settings vary by insight type and chart type, but can include:
- Smoothing
- Y-axis scale (linear or logarithmic)
- Percentage stack view
- Show or hide legend
- Show values on series
- Show annotations
- Confidence intervals and moving averages
- Axis labels and formatting
- Multiple Y-axes
- Decimal places
The Display options submenu requires editor access to the insight. Changes are saved to the insight and apply everywhere it appears.
Moving and copying widgets
You can move or copy insight cards and text cards to other dashboards from the ⋯ menu on each card:
- Move to – Moves the widget from the current dashboard to another dashboard. It's removed from the current dashboard.
- Copy to – Copies the widget to another dashboard while keeping it on the current dashboard.
Both options require editor access to the target dashboard.
When you copy an insight, it's the same underlying insight appearing on multiple dashboards (as noted above). Any changes to the insight are reflected everywhere it appears. This is different from duplicating an insight, which creates an independent copy.
Adding text cards
Click the dropdown on the Add... button and select Text card to add a text card to your dashboard.
Text cards include a rich text editor with a formatting toolbar. You can apply bold, italic, underline, headings, bullet and numbered lists, blockquotes, inline code, code blocks, and links directly from the toolbar. You can also drag and drop images and resize them within the editor.
You can use text cards to annotate your dashboard – useful for adding context for other users of the dashboard. For more in-depth analysis, however, we recommend creating a notebook.
Adding button tiles
Click the dropdown on the Add... button and select Button to add a clickable button tile to your dashboard.
Button tiles let you link to other pages within PostHog or external URLs. This is useful for creating navigation shortcuts to related dashboards or external resources.
When creating a button tile, you can configure:
- URL – The destination link. Use a path like
/dashboardsfor internal PostHog pages, or a full URL likehttps://example.comfor external sites. - Button text – The label displayed on the button.
- Placement – Align the button to the left or right side of the tile.
- Style – Choose between primary (filled) or secondary (outlined) button styles.
- Transparent background – Toggle to remove the tile's background for a cleaner look.
Adding widgets
Dashboard widgets are an early access feature. Subscribe on the early access features page to enable widgets for your organization.
Widgets let you add live content from other PostHog products directly to your dashboards. Unlike insights, widgets display real-time lists of events, issues, or recordings instead of charts and metrics.
This means your dashboards can be now be the one stop for everything you care about for your project.
To add a widget, click the Add... dropdown button and select a widget from the available groups.
Activity widget
The Activity widget displays a list of recent events mirroring the Activity > Explore page. Each row shows the event name, person, timestamp, library, and URL.
To add it, click the Add... dropdown and select Recent events under the Activity group.
Configuration options:
- Date range - The time period to show events from. Default: last 24 hours.
- Event - Scope the widget to a single event. Pick an event from the dropdown, or leave as All events to show everything. Default: All events.
- Event property filters - Filter events by event properties such as
Current URL,Browser, or custom event properties. - Person property filters - Filter events by person properties such as
Email,Company name, or custom person properties. - Limit - Maximum number of events to display. Default: 25, maximum: 50.
- Filter test accounts - Toggle to exclude internal and test users.
Clicking a row opens the event detail page in a new tab. Clicking the tile title navigates to Activity > Explore.
Error Tracking widget
The Error Tracking widget displays a list of top issues from Error Tracking. Each row shows the issue title, occurrences, affected users, and when it was last seen.
To add it, click the Add... dropdown and select Top issues under the Error tracking group.
Configuration options:
- Date range - The time period to show issues from. Default: last 7 days.
- Limit - Maximum number of issues to display. Default: 10, maximum: 25.
- Order by - Sort issues by occurrences, last seen, first seen, users, or sessions.
- Order direction - Sort ascending or descending.
- Status - Filter by issue status: active, resolved, archived, pending release, suppressed, or all.
- Assignee - Filter to show only issues assigned to specific team members.
- Filter test accounts - Toggle to exclude internal and test users.
Clicking a row opens the issue detail page. Clicking the tile title navigates to Error Tracking.
Session Replay widget
The Session Replay widget displays a list of recent recordings from Session Replay. Each row shows the user, recording duration, activity score, and timestamp.
To add it, click the Add... dropdown and select Recent recordings under the Session replay group.
Configuration options:
- Date range - The time period to show recordings from. Default: last 7 days.
- Limit - Maximum number of recordings to display. Default: 10, maximum: 25.
- Order by - Sort recordings by start time, activity score, duration, clicks, or console errors.
- Order direction - Sort ascending or descending.
- Collection - Scope the widget to a curated set of pinned recordings from a collection.
- Saved filter - Apply a saved Session Replay filter to refine which recordings are shown.
- Filter test accounts - Toggle to exclude internal and test users.
Collection and Saved filter are composable. Collection acts as the scope – a fixed set of pinned session IDs – while Saved filter acts as refinement, applying its date range and property filters on top. When both are set, the widget first scopes to the collection's recordings, then narrows the results using the saved filter criteria. A collection on its own is not date-bounded, so older pinned recordings still appear.
Clicking a row opens the session replay player. Clicking the tile title navigates to Session Replay.
Logs widget
The Logs widget displays a list of recent log entries from Logs. Each row shows a severity bar, timestamp, and the log body, matching the style of the Logs page.
To add it, click the Add... dropdown and select Recent logs under the Logs group.
Tile filters:
- Severity - Filter by log severity levels (trace, debug, info, warn, error, fatal). Default: all levels.
- Service - Filter logs by specific services. Default: all services.
- Sort - Sort by newest first or oldest first. Default: newest first.
- Saved view - Point the tile at a saved logs view. When set, the saved view owns the date range, severity, service, and property filters; only sort and limit still apply from the tile.
Display settings (edit modal):
- Date range - The time period to show logs from. Default: last hour.
- Limit - Maximum number of log entries to display. Default: 50, maximum: 100.
- Timestamps - Display log times in UTC or your local timezone. Default: UTC.
- Wrap long log lines - Toggle line wrapping vs. truncation. Default: off.
Clicking a row opens the log on the Logs page in a new tab. Clicking the tile title navigates to Logs.
Experiments list widget
The Experiments list widget displays a filterable list of experiments. Each row shows the experiment name, status, conclusion, creator, and when it was created.
To add it, click the Add... dropdown and select Experiments list under the Experiments group.
Configuration options:
- Sort by - Sort experiments by created date, name, or start date.
- Direction - Sort ascending or descending.
- Number of experiments - Maximum number of experiments to display. Default: 10, maximum: 25.
The tile also includes a filter bar where you can filter by experiment status (draft, running, paused, complete, or any status) and by creator.
Clicking a row opens the experiment detail page. Clicking the tile title navigates to Experiments.
Experiment Results widget
The Experiment Results widget displays the current results for a selected experiment's primary and secondary metrics. It shows the experiment name, status, total exposures, and a breakdown of variant results for each metric.
To add it, click the Add... dropdown and select Experiment results under the Experiments group.
Configuration options:
- Experiment - Select which experiment to display results for. You can pick an experiment when adding the widget or later from the widget settings.
The widget displays:
- Experiment name and current status
- Total exposures count
- Primary metrics with variant-level results
- Secondary metrics, if configured on the experiment
If the selected experiment is still in draft status, the widget shows a message indicating that results appear once the experiment is running.
Clicking the experiment name opens the experiment detail page in a new tab.
Survey Results widget
The Survey Results widget displays performance metrics and recent responses for a selected survey. It shows the survey name, status, a performance summary, a stacked bar showing the submission breakdown, and a list of recent responses.
To add it, click the Add... dropdown and select Survey results under the Surveys group.
Configuration options:
- Survey - Select which survey to display results for. Pick a survey from the dropdown in the tile's quick-filter bar.
- Date range - The time period to show stats and responses from. Default: all time (the survey's full lifetime).
- Limit - Maximum number of recent responses to display. Default: 10, maximum: 25.
The widget displays:
- Survey name and current status (active, draft, ended, or archived)
- Performance summary showing times shown, responses received, and conversion rate
- Stacked bar visualizing submitted, dismissed, and unanswered counts
- List of recent responses, each showing the respondent's name, submission time, and answers
Clicking a response row opens the respondent's person page. Clicking See more opens the survey detail page in a new tab.
Sharing a dashboard
By clicking 'Share' in the top right corner you can:
Restrict edit access to certain members within a project. Dashboards can be shared either by members with administrator privileges or by the dashboard creator (platform package required).
Create a link to share your dashboard publicly, or embed your dashboard on a website. Read more about this in our sharing and embedding docs.
Copy to another project
You can copy a dashboard and its dependencies to another project within your organization.
- Click on the '...' menu at the top of the dashboard.
- Select Copy to another project.
- Choose the destination project.
- For each dependency (like insights), choose whether to create a new copy or link to an existing resource in the destination project.
- Click Copy.
The original dashboard is not modified. If a resource was previously copied to the destination project, PostHog suggests linking to the existing copy rather than creating a duplicate.
Refreshing individual tiles
You can refresh a single insight tile without refreshing the entire dashboard. Hover over the tile header to reveal a refresh icon. Click it to recompute just that tile.
The tooltip on the refresh icon shows when the tile's data was last computed. If the tile is rate-limited, the icon is disabled and the tooltip explains when the next refresh is available.
The refresh icon is hidden while the tile is actively refreshing and isn't available on shared or public dashboards. You can also refresh a tile from the ⋯ menu by selecting Refresh data, which is useful for touch and keyboard users.
- Choose a theme (light, dark, or system) for shared and embedded dashboards.
Auto refresh
You can manually refresh a dashboard at any time, but you can also set it to automatically refresh.
To do so, click the dropdown arrow next to refresh button, turn on auto refresh and choose your refresh interval.
This is useful if you have a PostHog dashboard on a TV screen for others to see.
Important: Auto refresh only works when the browser tab is active.
Shared and embedded dashboards (via public links) auto-refresh every 30 minutes by default. This requires no configuration – it's enabled automatically when the page is open. See the sharing and embedding docs for more on shared dashboards.
AI-powered refresh analysis
When you refresh a dashboard, you can also have AI analyze what changed. Click the sparkle icon on the refresh button to refresh and analyze with AI. PostHog snapshots the current dashboard data, refreshes all insights, and then compares the before and after results. You get a summary of significant changes – drops, spikes, and trend reversals – across all insights on the dashboard.
After the analysis completes, you can rate it with a thumbs up or thumbs down.
Note: AI-powered refresh analysis isn't available when dashboard filter overrides, URL filters, or URL variables are applied.
Managing dashboards with Terraform
For teams practicing infrastructure-as-code, you can manage PostHog dashboards and insights using the PostHog Terraform Provider.
This enables:
- Version-controlled analytics – Dashboard and insight definitions stored in git
- Consistent environments – Deploy the same dashboards across projects
- CI/CD integration – Automate analytics infrastructure alongside your application
Exporting existing dashboards
To get started quickly, you can export your existing dashboards as Terraform code using the Manage with Terraform button.
You'll see a Manage with Terraform button on:
- Dashboard pages – Exports the entire dashboard including all insights, dashboard layouts, alerts, and hog functions
- Insight detail pages – Exports the individual insight with its associated alerts and hog functions
Click the button to generate HCL code that you can copy directly into your Terraform configuration. This lets you bring existing dashboards under version control without manually recreating them.
Installation
Add the provider to your Terraform configuration:
For production use, we recommend pinning to a specific version. See the Terraform Registry for the latest version.
Example: Creating a dashboard
Example: Creating an insight
Example: Defining a dashboard layout
The posthog_dashboard_layout resource controls how tiles (insights, text cards, button tiles) are positioned on a dashboard. Each tile can specify layout coordinates, colors, and text content. When you export a dashboard using Manage with Terraform, this resource is generated automatically.
For the full list of supported resources and configuration options, see the Terraform Registry documentation.