

Stickiness
Contents
Stickiness is a type of insight that enables you to see how many times users perform an event within a specific time period. This is useful for tracking if a particular feature is engaging for users.
For example, if you track Weekly Active Users, stickiness highlights those that are the most engaged within that week.
Stickiness helps you answer questions such as:
- How frequently are users engaging with my product?
- Who are my most engaged users?
- Are users engaging more with my product now than they did a month ago?
How to create a stickiness insight
- Click Product analytics on the left sidebar
- Click the + New Insights button
- Select the Stickiness tab
- Select the event you want to see the stickiness of
You can also use data warehouse tables as series in stickiness insights. Clicking through to view individual actors is not supported for data warehouse tables.
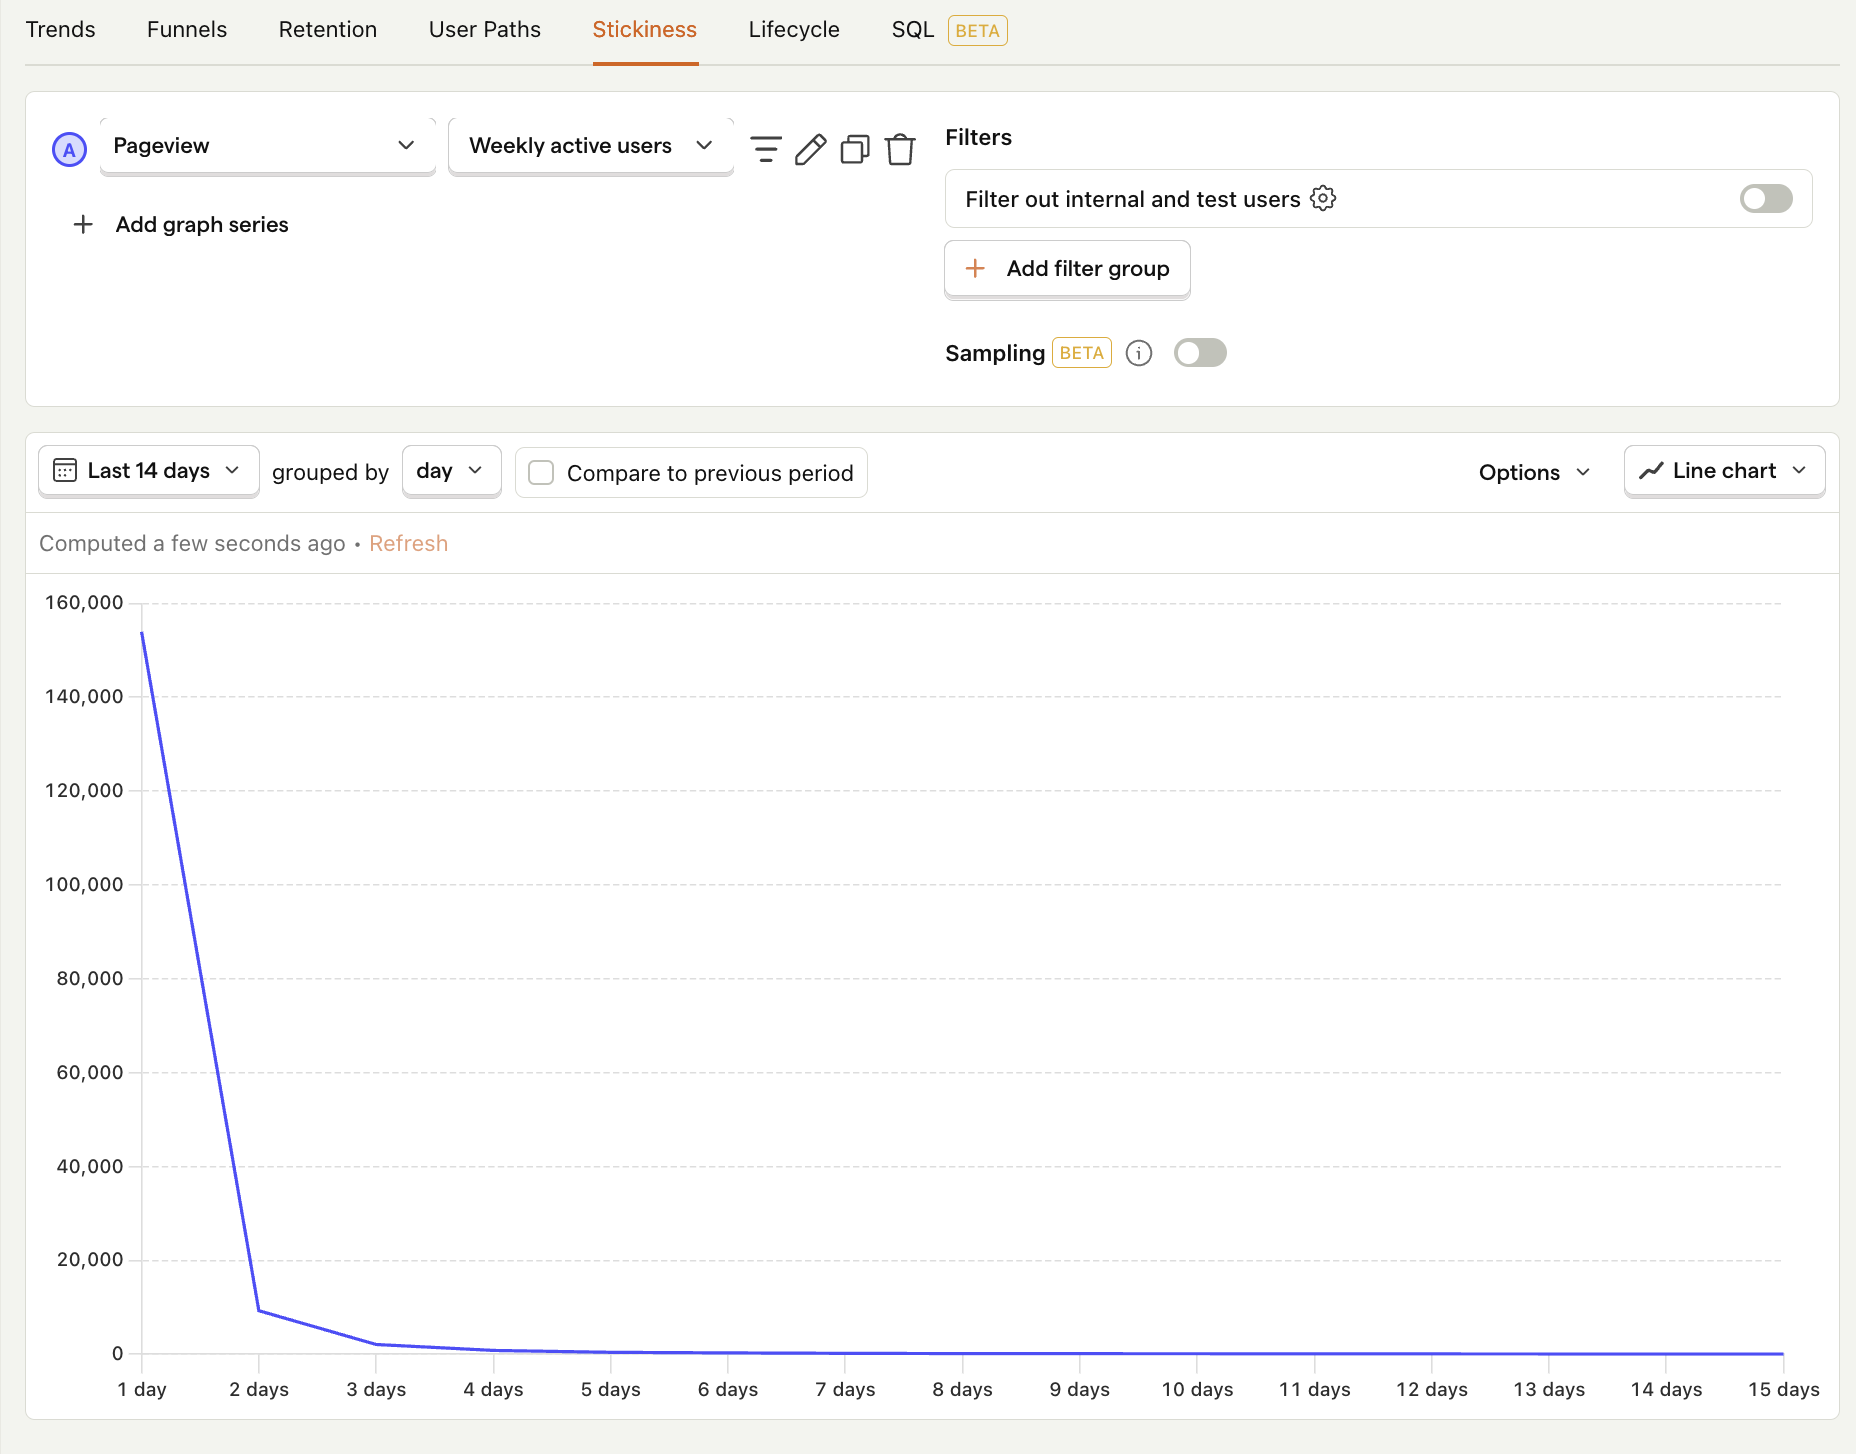
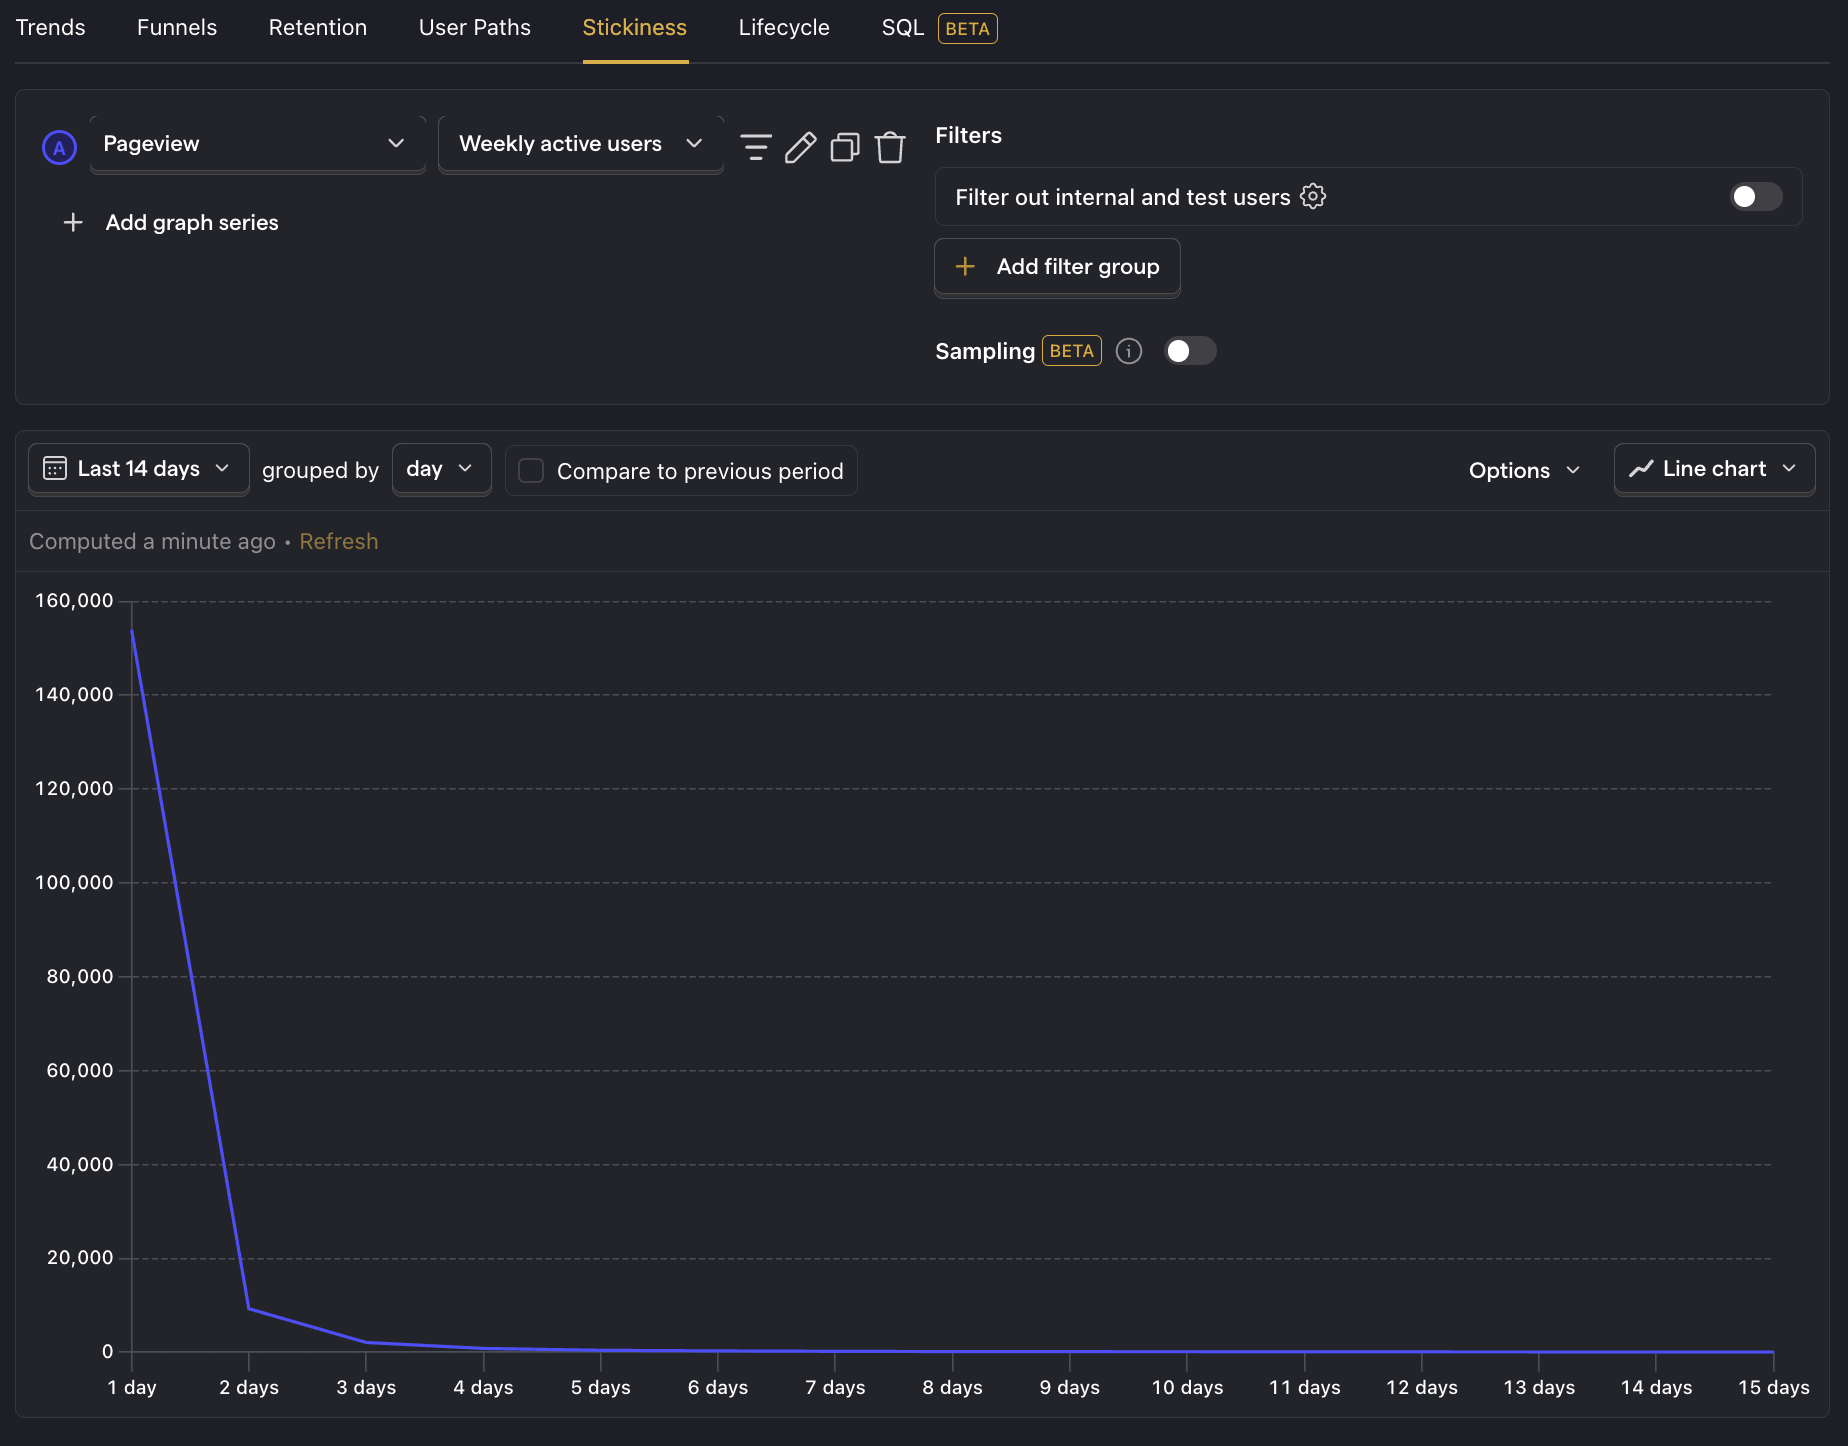
Understanding stickiness charts
The y-axis on the graph represents the number of unique users or groups. The x-axis represents the number of times the user or group performed the event in the specified time period.
For example, the below chart shows 938 people performed a pageview event on 3 of the last 7 days:
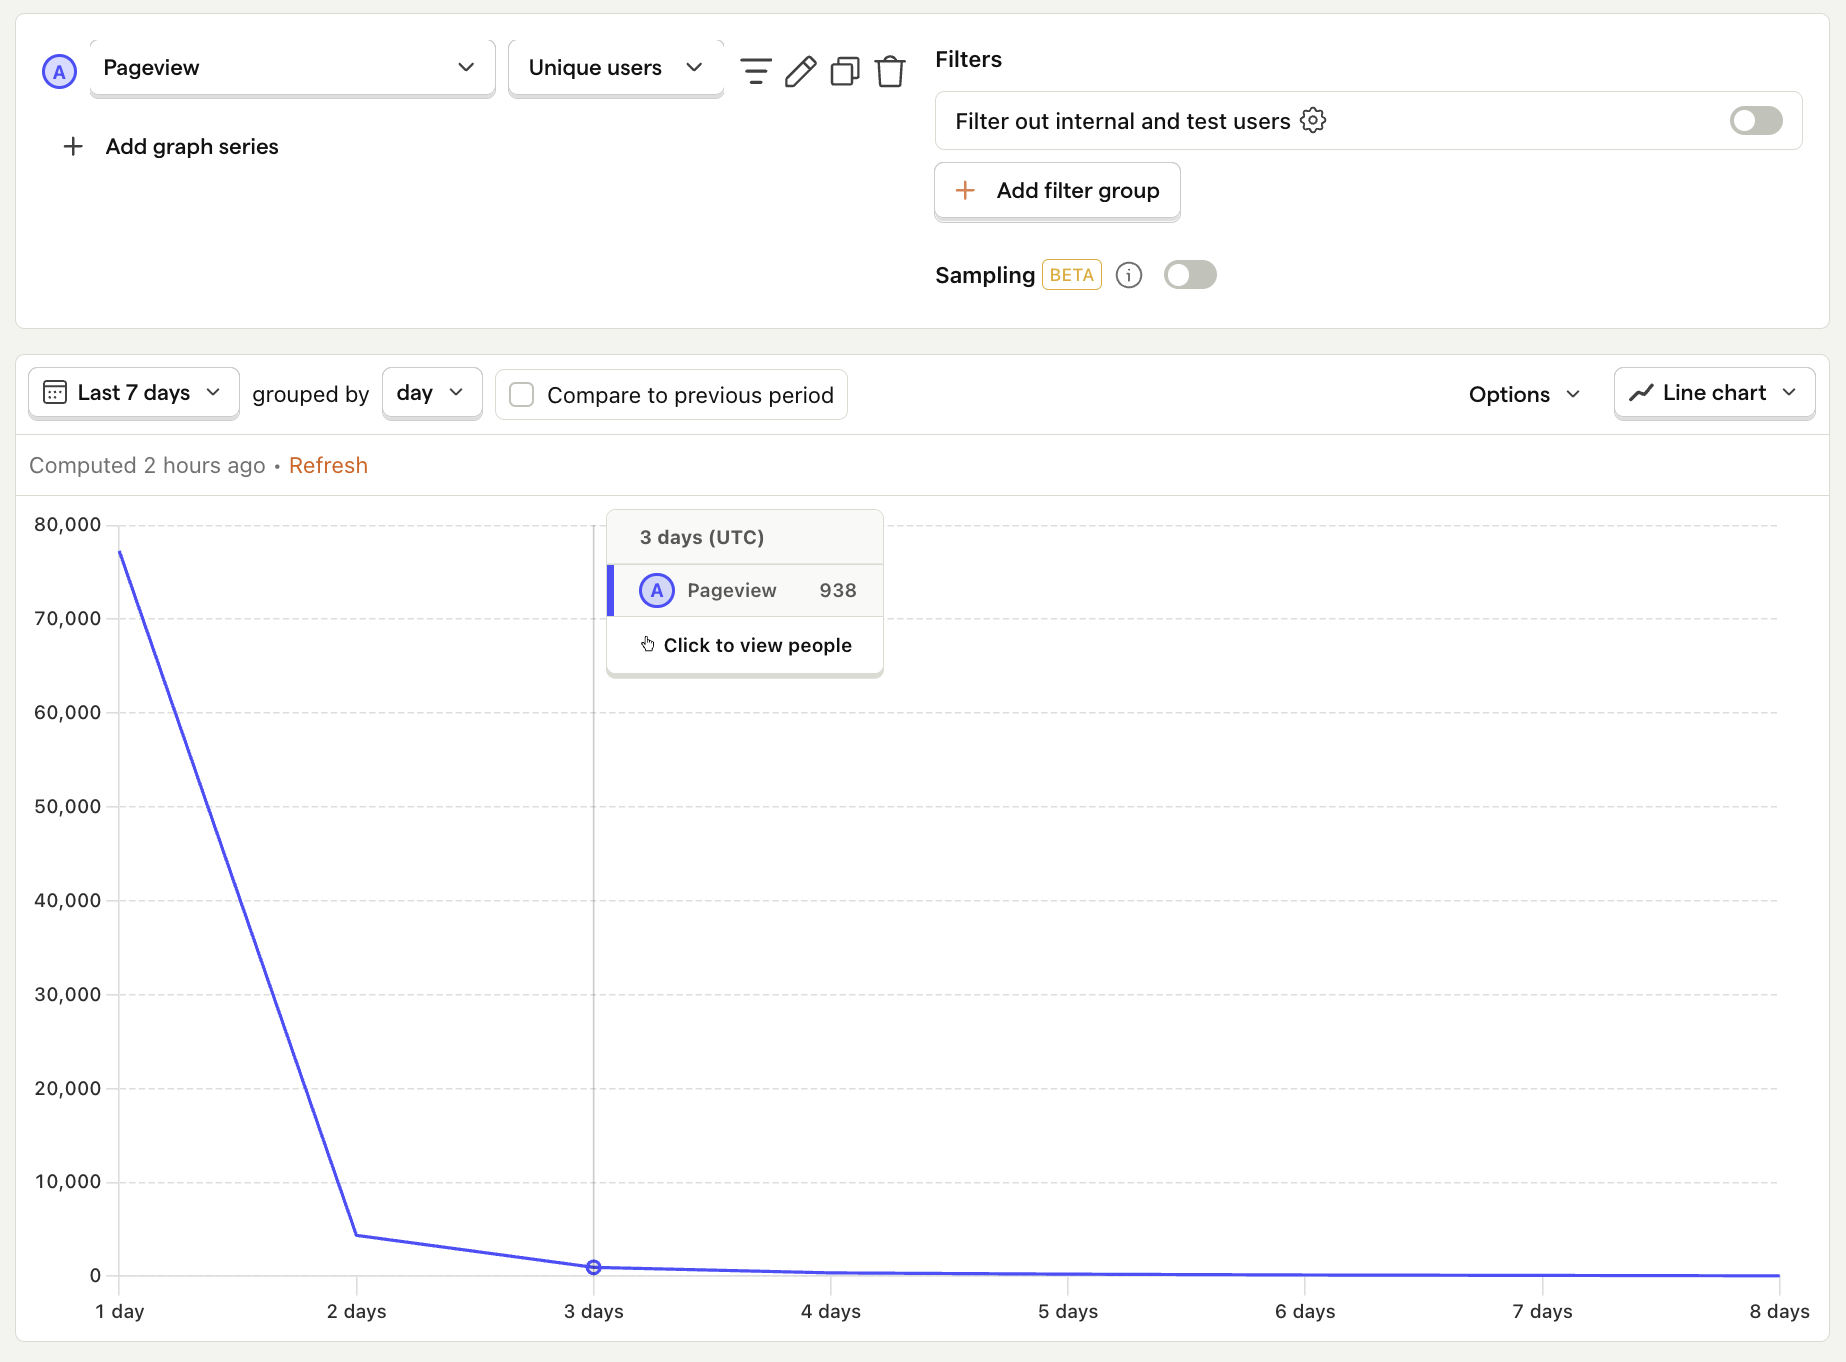
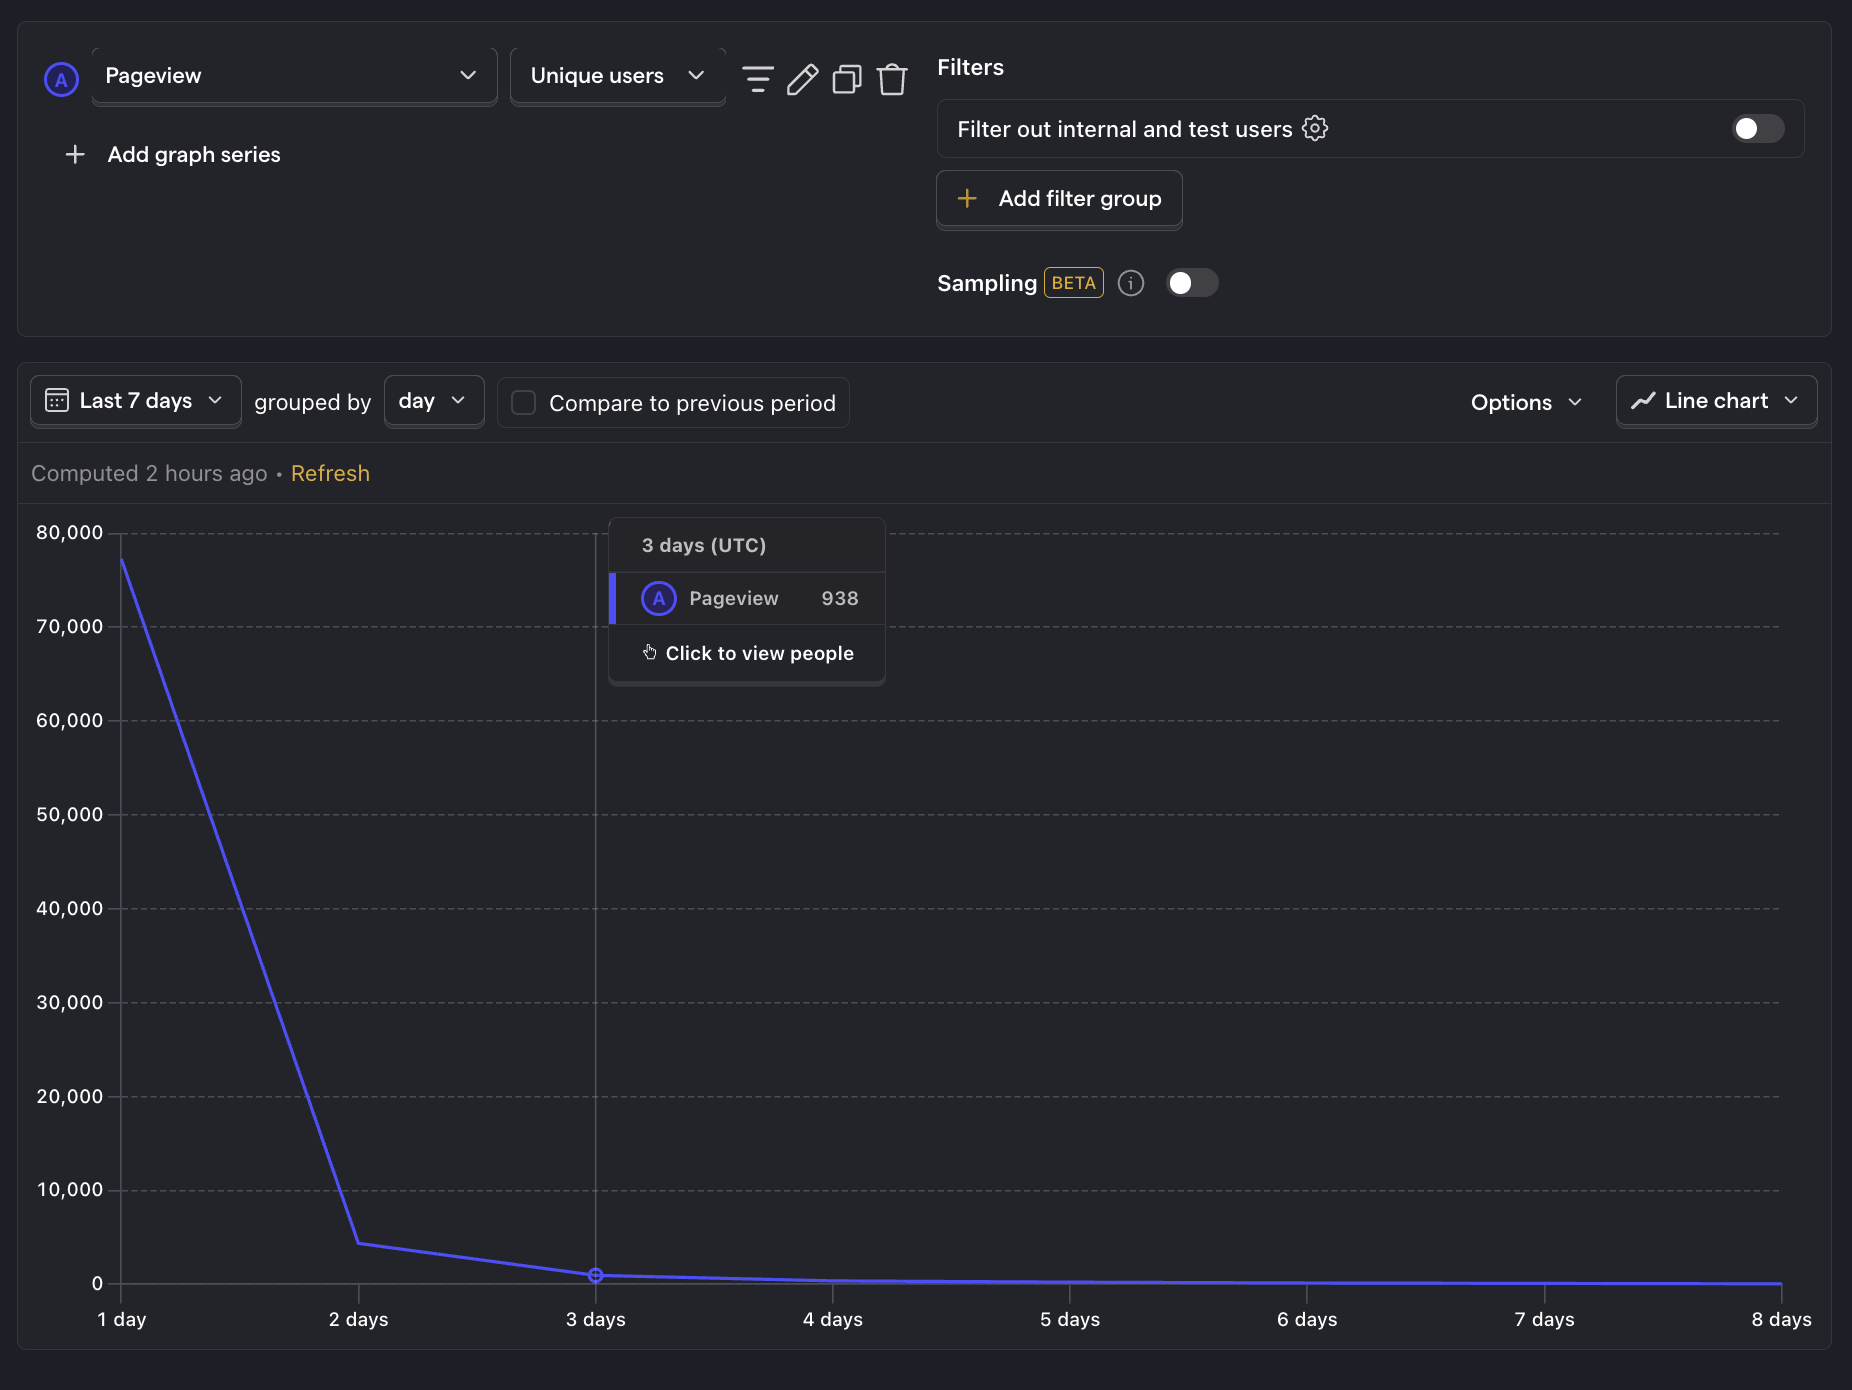
It's worth noting that stickiness measures the exact number of times a user performed an action. For example, if a user performed an event in 3 out of the last 7 days, they would only be included in this group, and not the group who performed the action in 2 out of the last 5 days.
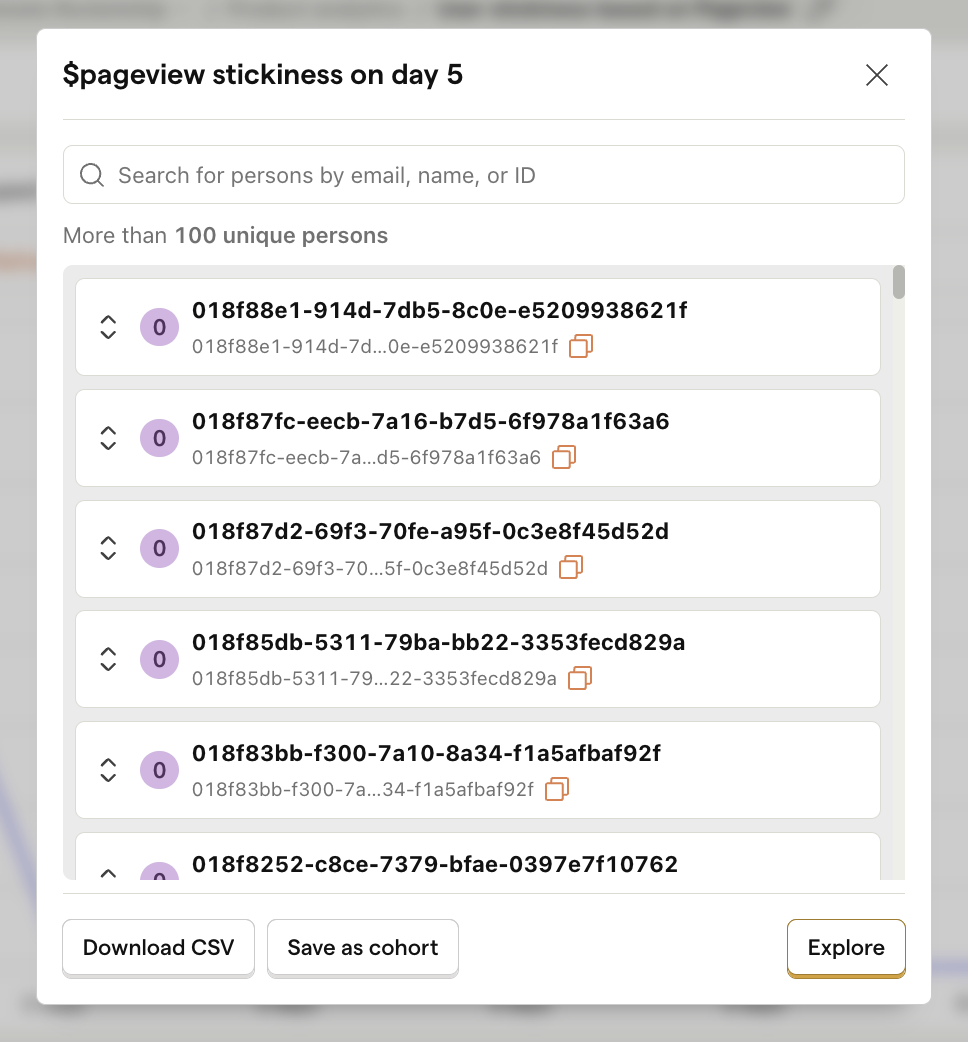
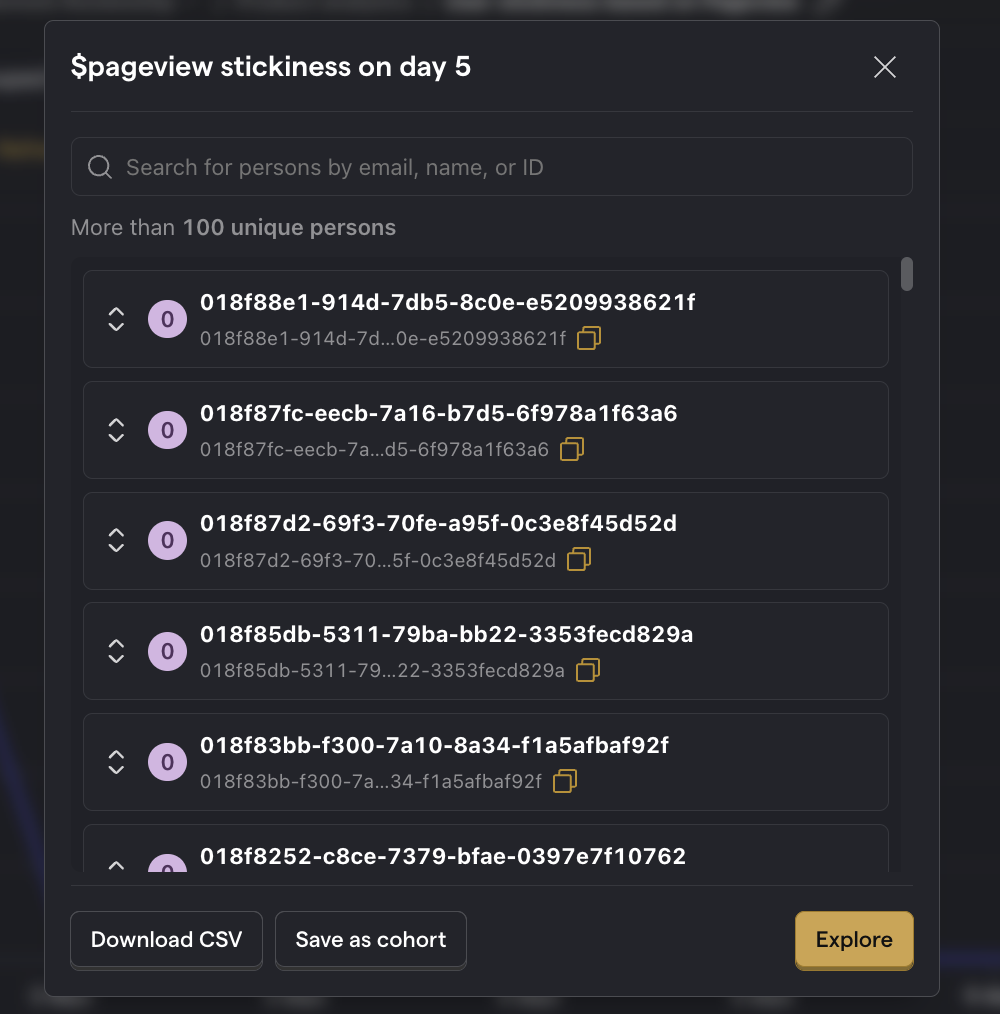
Viewing individual users
You can drill down into specific users who have performed an event or action multiple times:
- Hover a particular data point on your stickiness graph
- Click on the data point to bring up a list of users in that point
You can then create a cohort of those users by clicking the Save as cohort button in the modal. This is useful for creating further insights for a highly engaged group of users.
Stickiness vs retention
Stickiness and retention insights can look very similar, but they tell you different things:
- Retention measures the percentage of users who came back and performed an event within a given period at least once
- Stickiness measures how many times within a period a user performed an event
Retention is good for seeing how well you're doing at keeping users engaged overall. Stickiness is useful for seeing how deeply users are engaging with your product, and helps you identify the most engaged users.