


Statistical analysis
Contents
When analyzing data, it's important to understand if your results are statistically significant. In other words, are the trends you're seeing real, or are they just due to random chance?
PostHog helps you answer this question by providing confidence intervals for your trend lines.
What are confidence intervals?
A confidence interval is a range of values that likely contains the true value of a metric. A 95% confidence level means that if you were to run the same analysis again 100 times, 95 of those times the true value would fall within the calculated confidence interval.
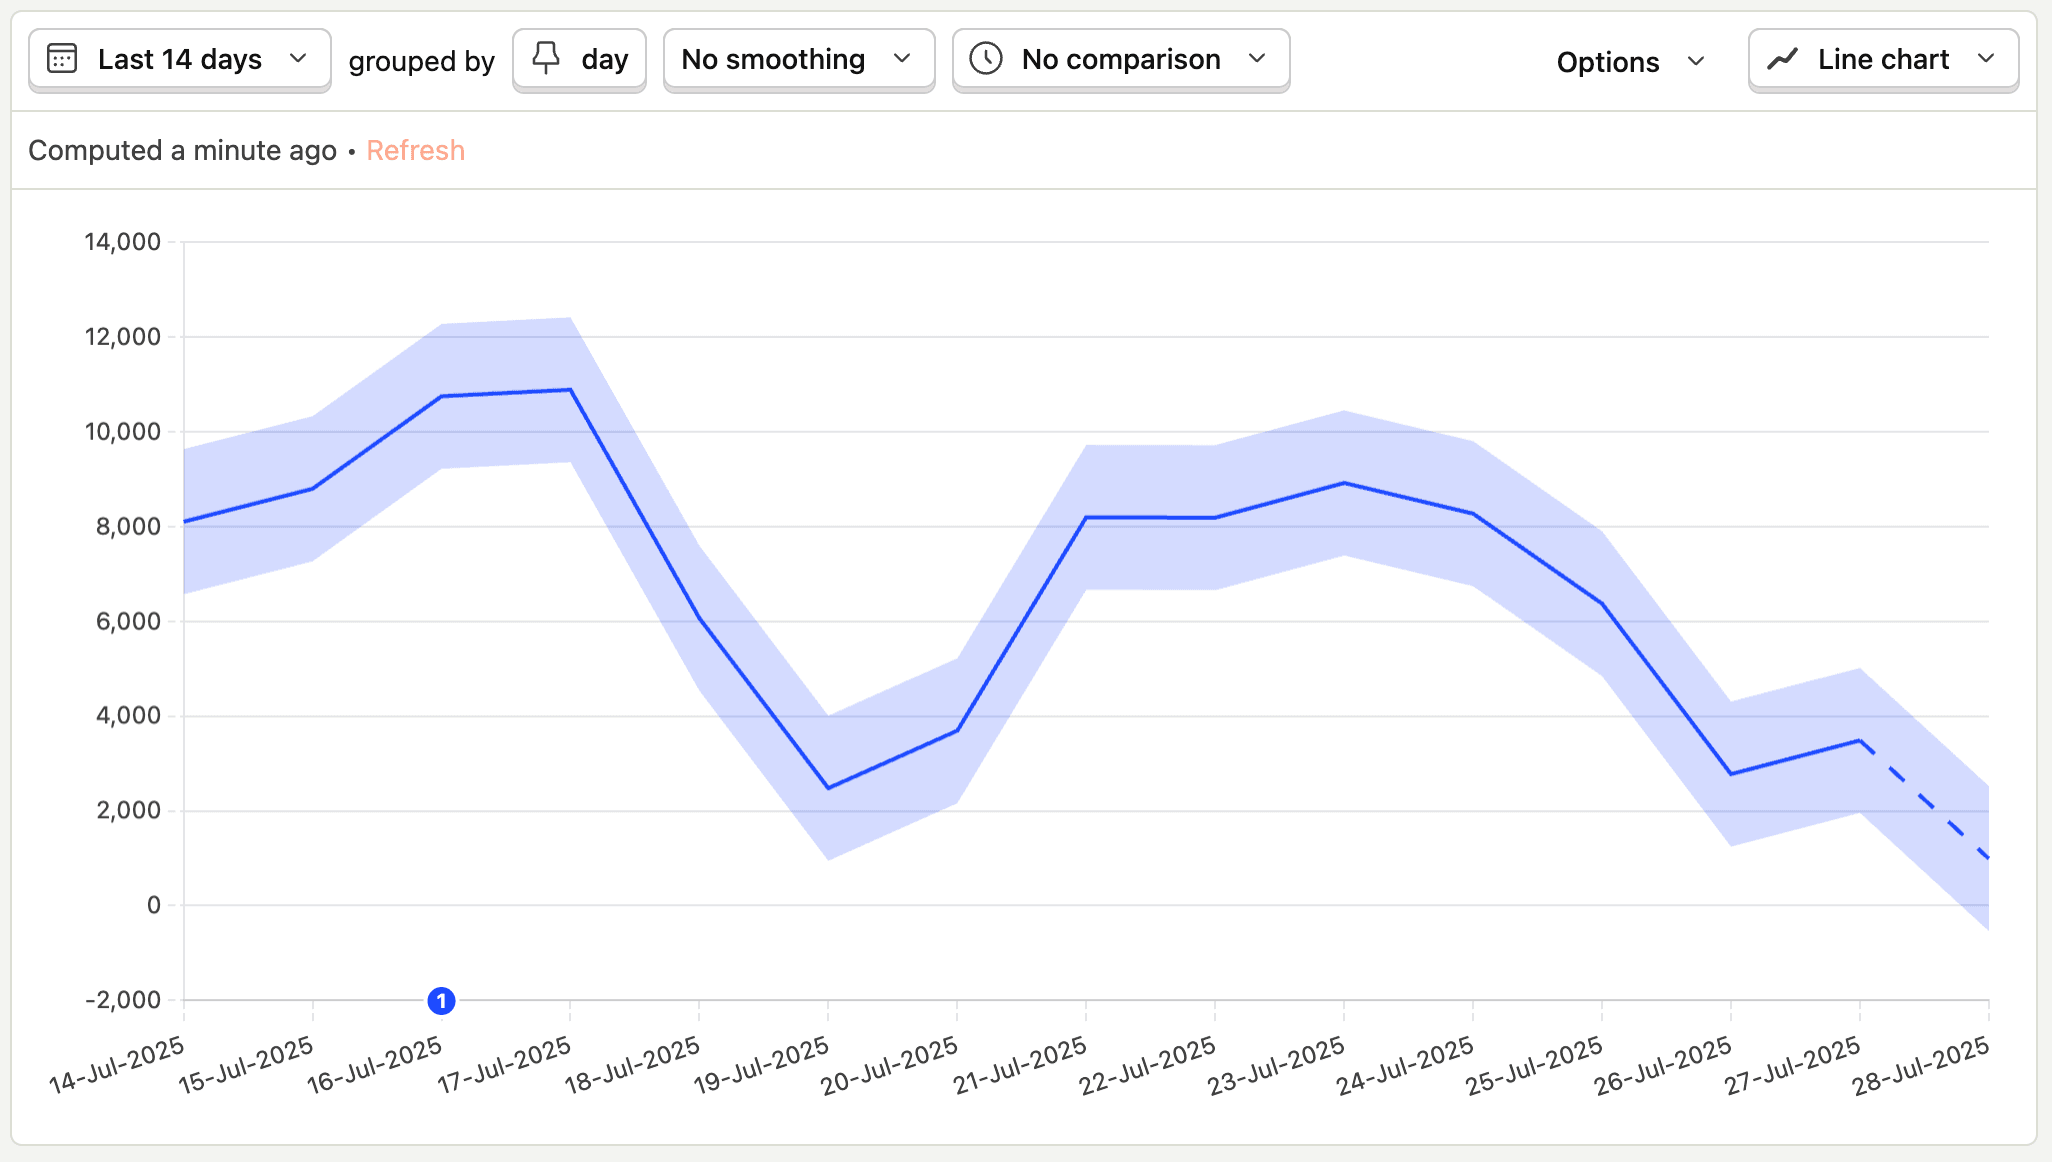
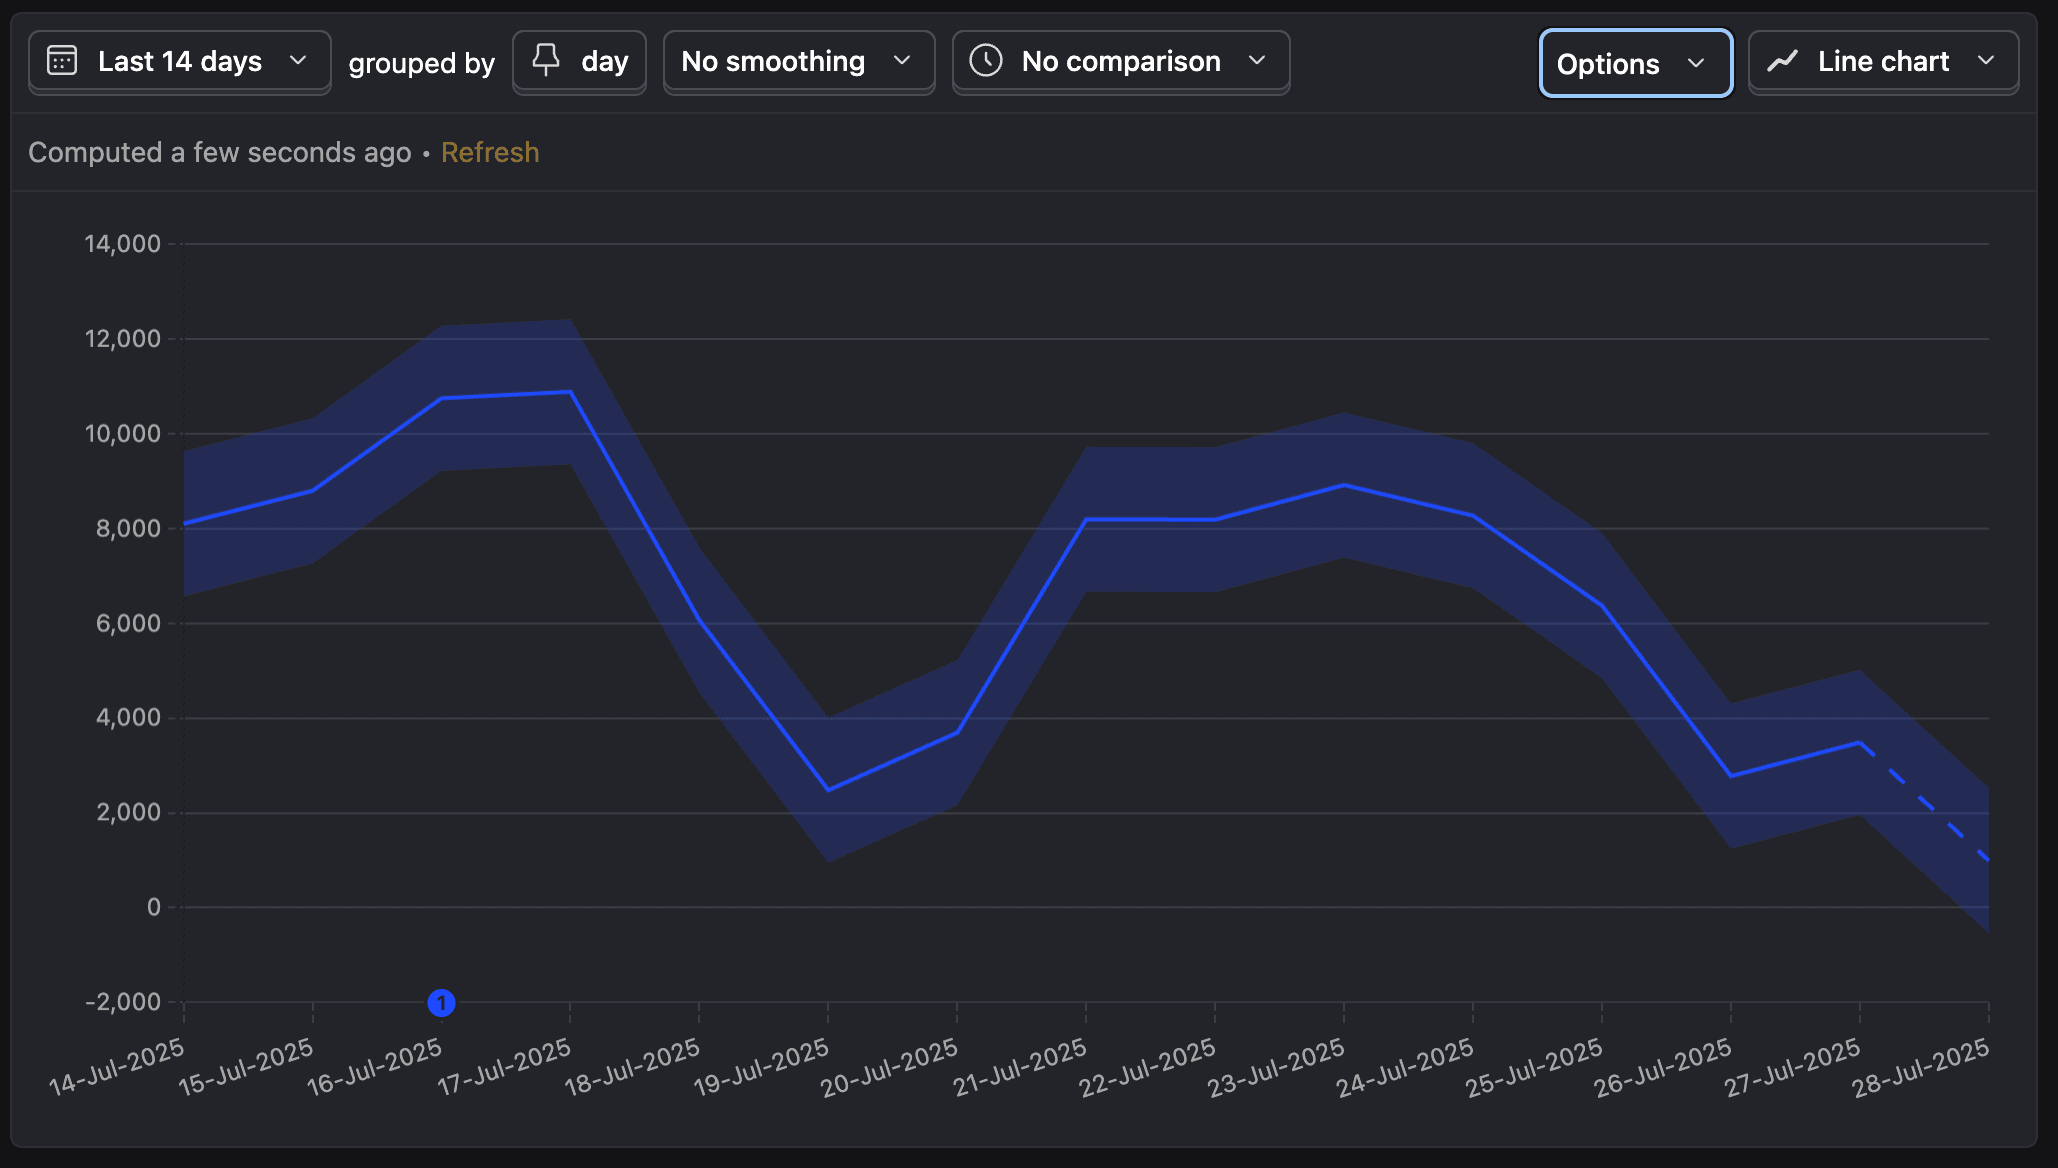
In PostHog, confidence intervals are displayed as a shaded area around your trend lines. The wider the shaded area, the less confident we are in the data. The narrower the area, the more confident we are.
This is especially useful when you're working with smaller sample sizes (sampling turned on) or when you're trying to detect small changes in your metrics. It helps you avoid making decisions based on noise.
How to use confidence intervals
To enable confidence intervals, go to Options section of your trend insight and toggle the Show confidence intervals switch.
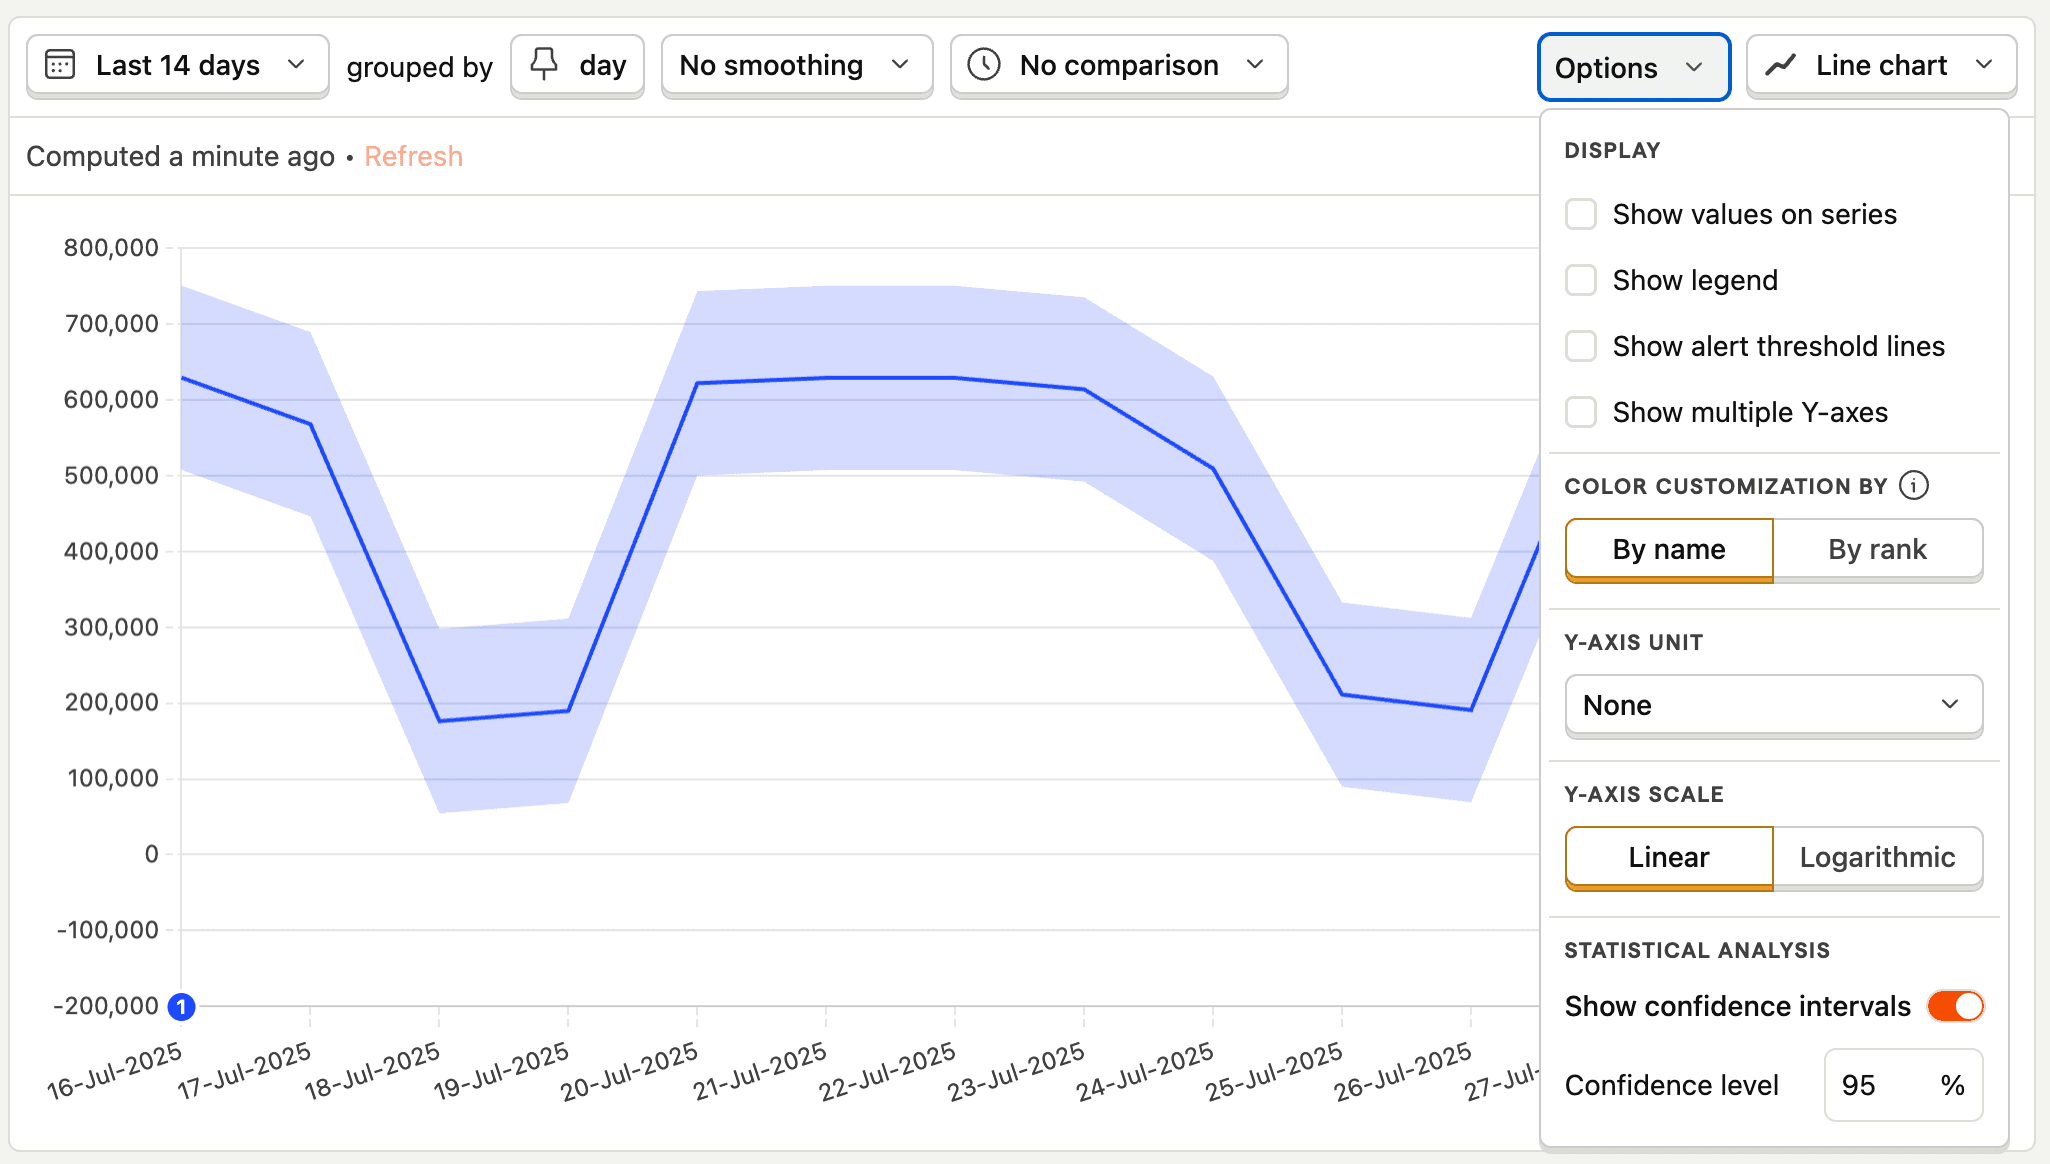
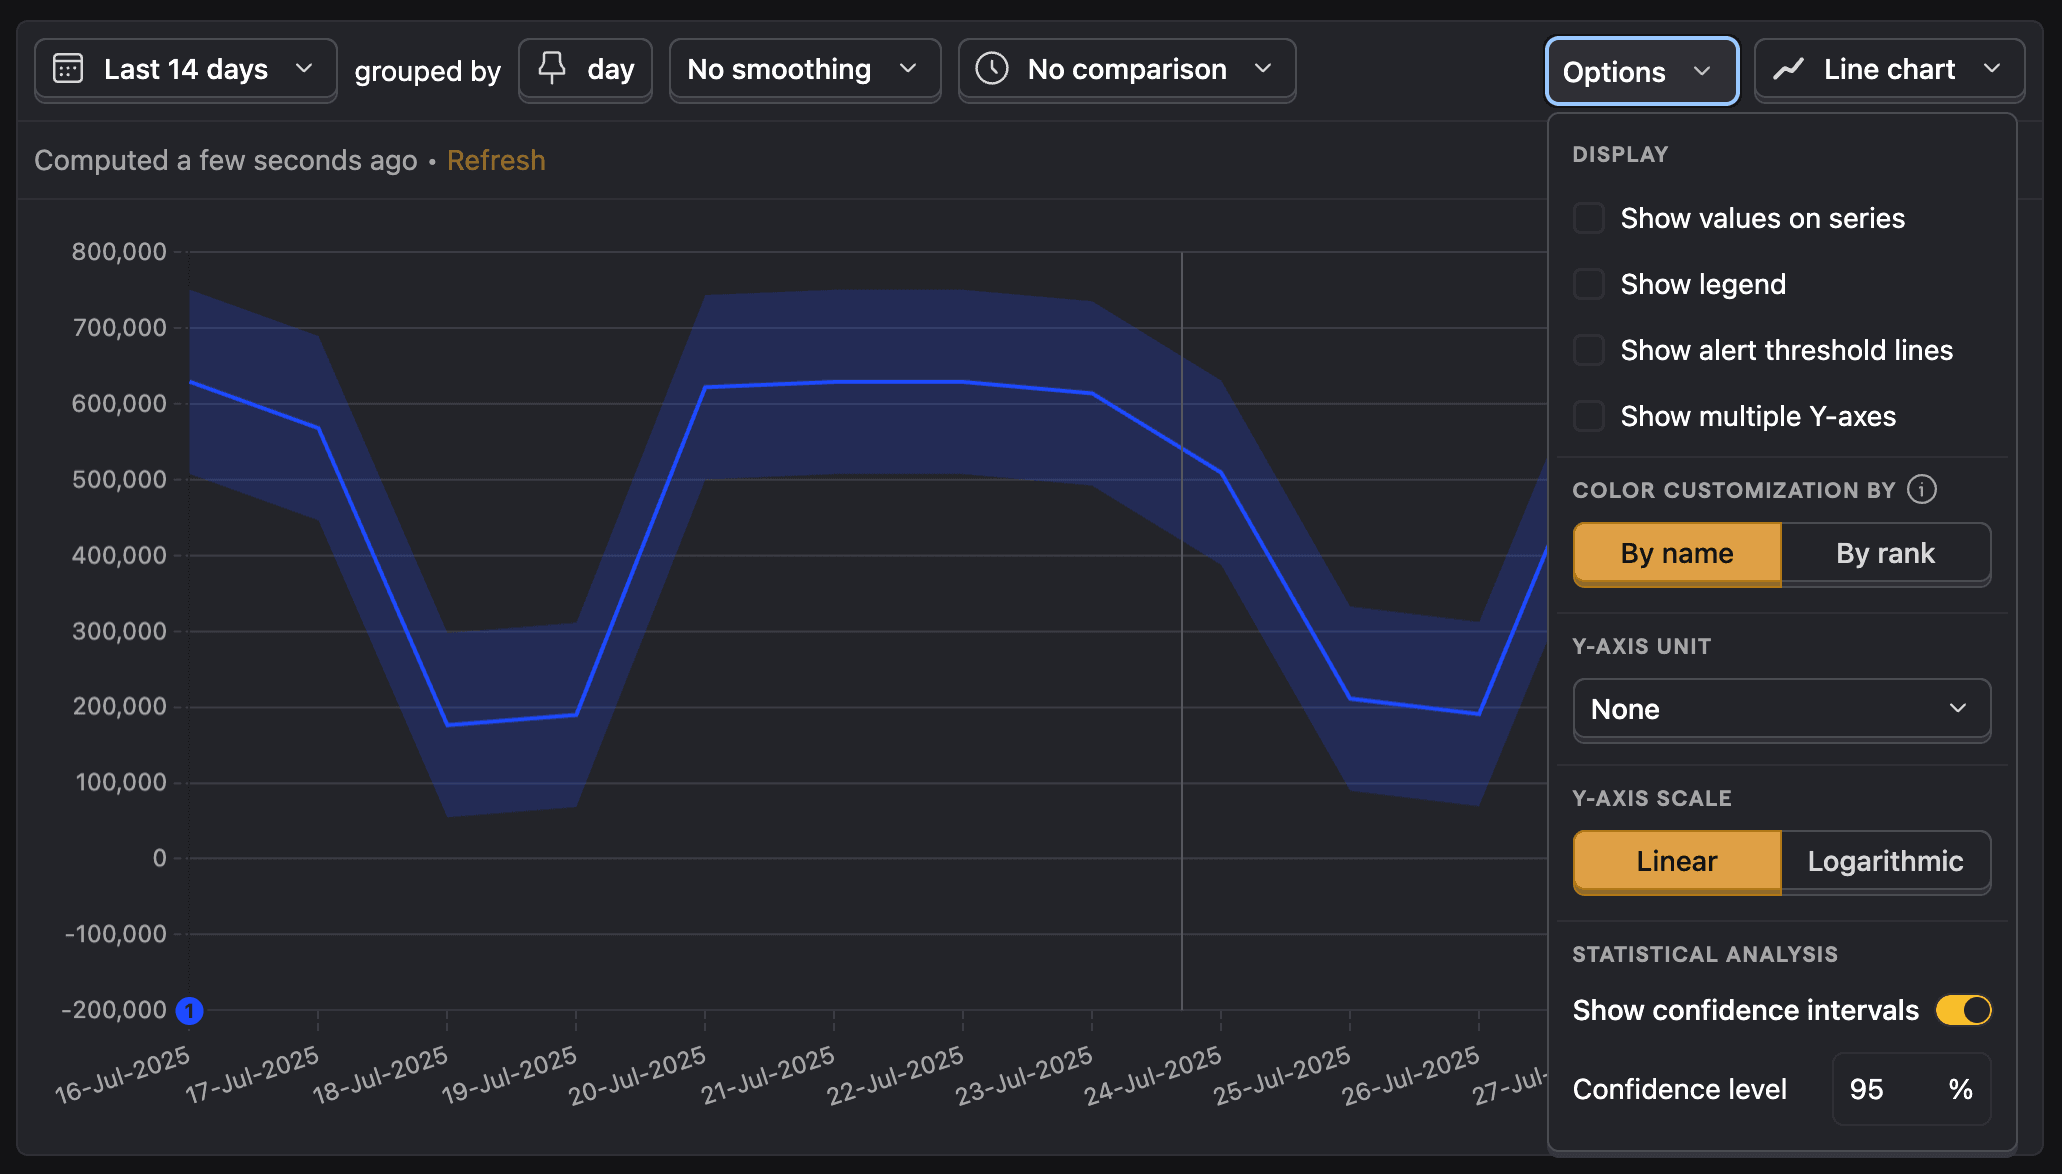
You can also set the confidence level, which is 95% by default. A higher confidence level will result in a wider interval, while a lower confidence level will result in a narrower interval. Common confidence levels are 90%, 95%, and 99%.
Interpreting confidence intervals
When comparing two trend lines with confidence intervals, you can use the overlap of their shaded areas to gauge statistical significance.
- If the confidence intervals don't overlap, the difference between the two trend lines is likely statistically significant.
- If the confidence intervals do overlap, the difference may not be statistically significant. You may need to collect more data to be sure.
Confidence intervals are a powerful tool for making data-informed decisions. They can help you avoid being misled by random fluctuations in your data and focus on the changes that matter.