


Retention
Contents
Retention shows you how many users return during subsequent periods. It's useful for answering questions like:
- Are new sign ups coming back to use your product after trying it?
- Is a new feature or user experience getting people to return?
- What type of user retains the best?
Retention insights are also a vital tool for evaluating whether you've achieved product-market fit.
Creating a retention insight
Retention insights support both events and actions.
When you create a retention insight, you're defining two things:
- A start event - an event or action that determines if the user or group should be included in the retention cohorts.
- A return event - an event or action that the same user or group returns to perform. This tells us if they were retained.
It often, but not always, makes sense to use the same event or action for both.
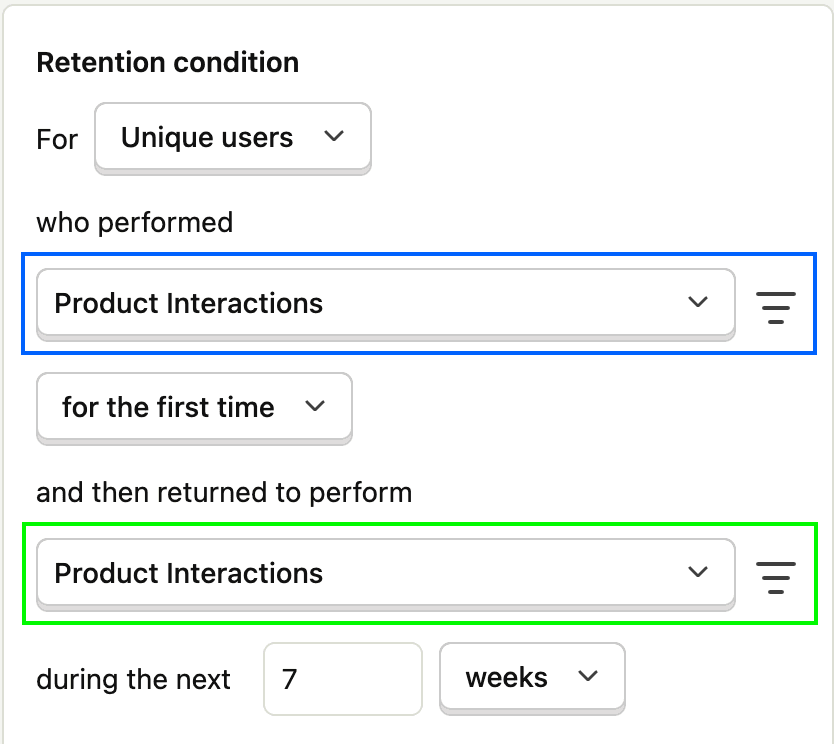
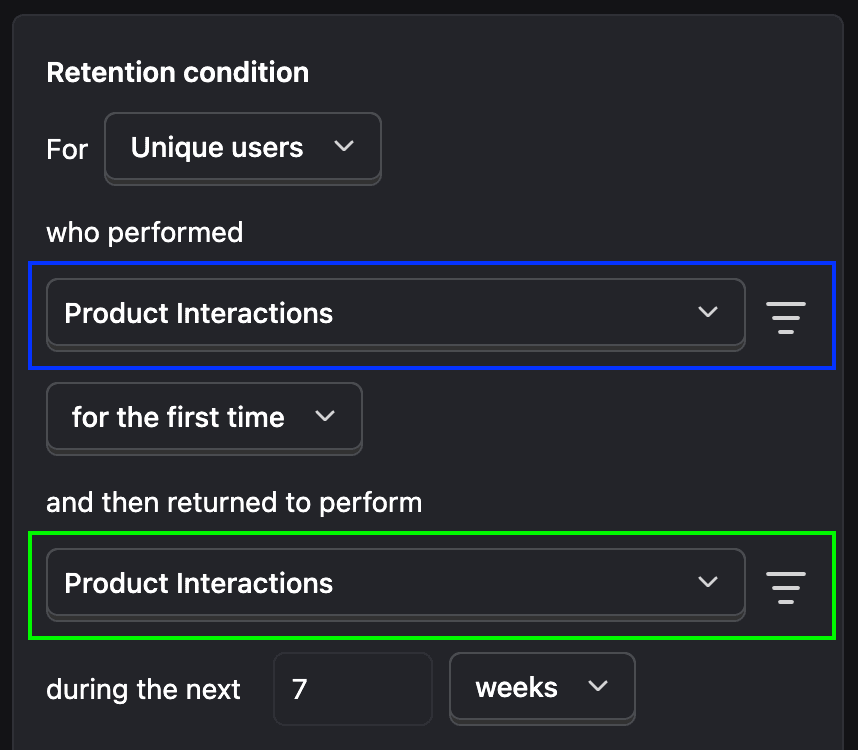
In the example above, we use an action called Product Interactions for both. We group by Unique users and chose users who did the Product Interactions action for the first time during a seven-week period.
You can also:
Analyze retention for groups of users, such as all users in the same organization, company, or account. This is useful if your customers are companies with many users, but not all of them are active. This requires group analytics.
Define the retention period by any number of hours, days, weeks, or months. To analyze retention across a whole year, for example, you should configure your insight to say "in the last 12 months".
Filter your retention insights using filter groups, such as event properties (country, device, etc.), person properties (job title, company name, etc.), feature flags (users who have a flag enabled), and existing cohorts (pre-defined groups of users).
Choose between first time, first ever occurrence, and recurring retention. Recurring retention counts a user or group as part of a cohort if they performed the start event during that time period, irrespective of if it was their first time or not. First time retention only counts a user or group as part of the cohort if it was their first time performing the start event during the insight's date range. First ever occurrence is similar, but only includes users whose very first instance of the start event (across all time, not just the date range) falls within the cohort period.
Add breakdowns to see how retention varies across different properties.
Set up a bunch more advanced calculation options like relative retention.
Understanding retention insights
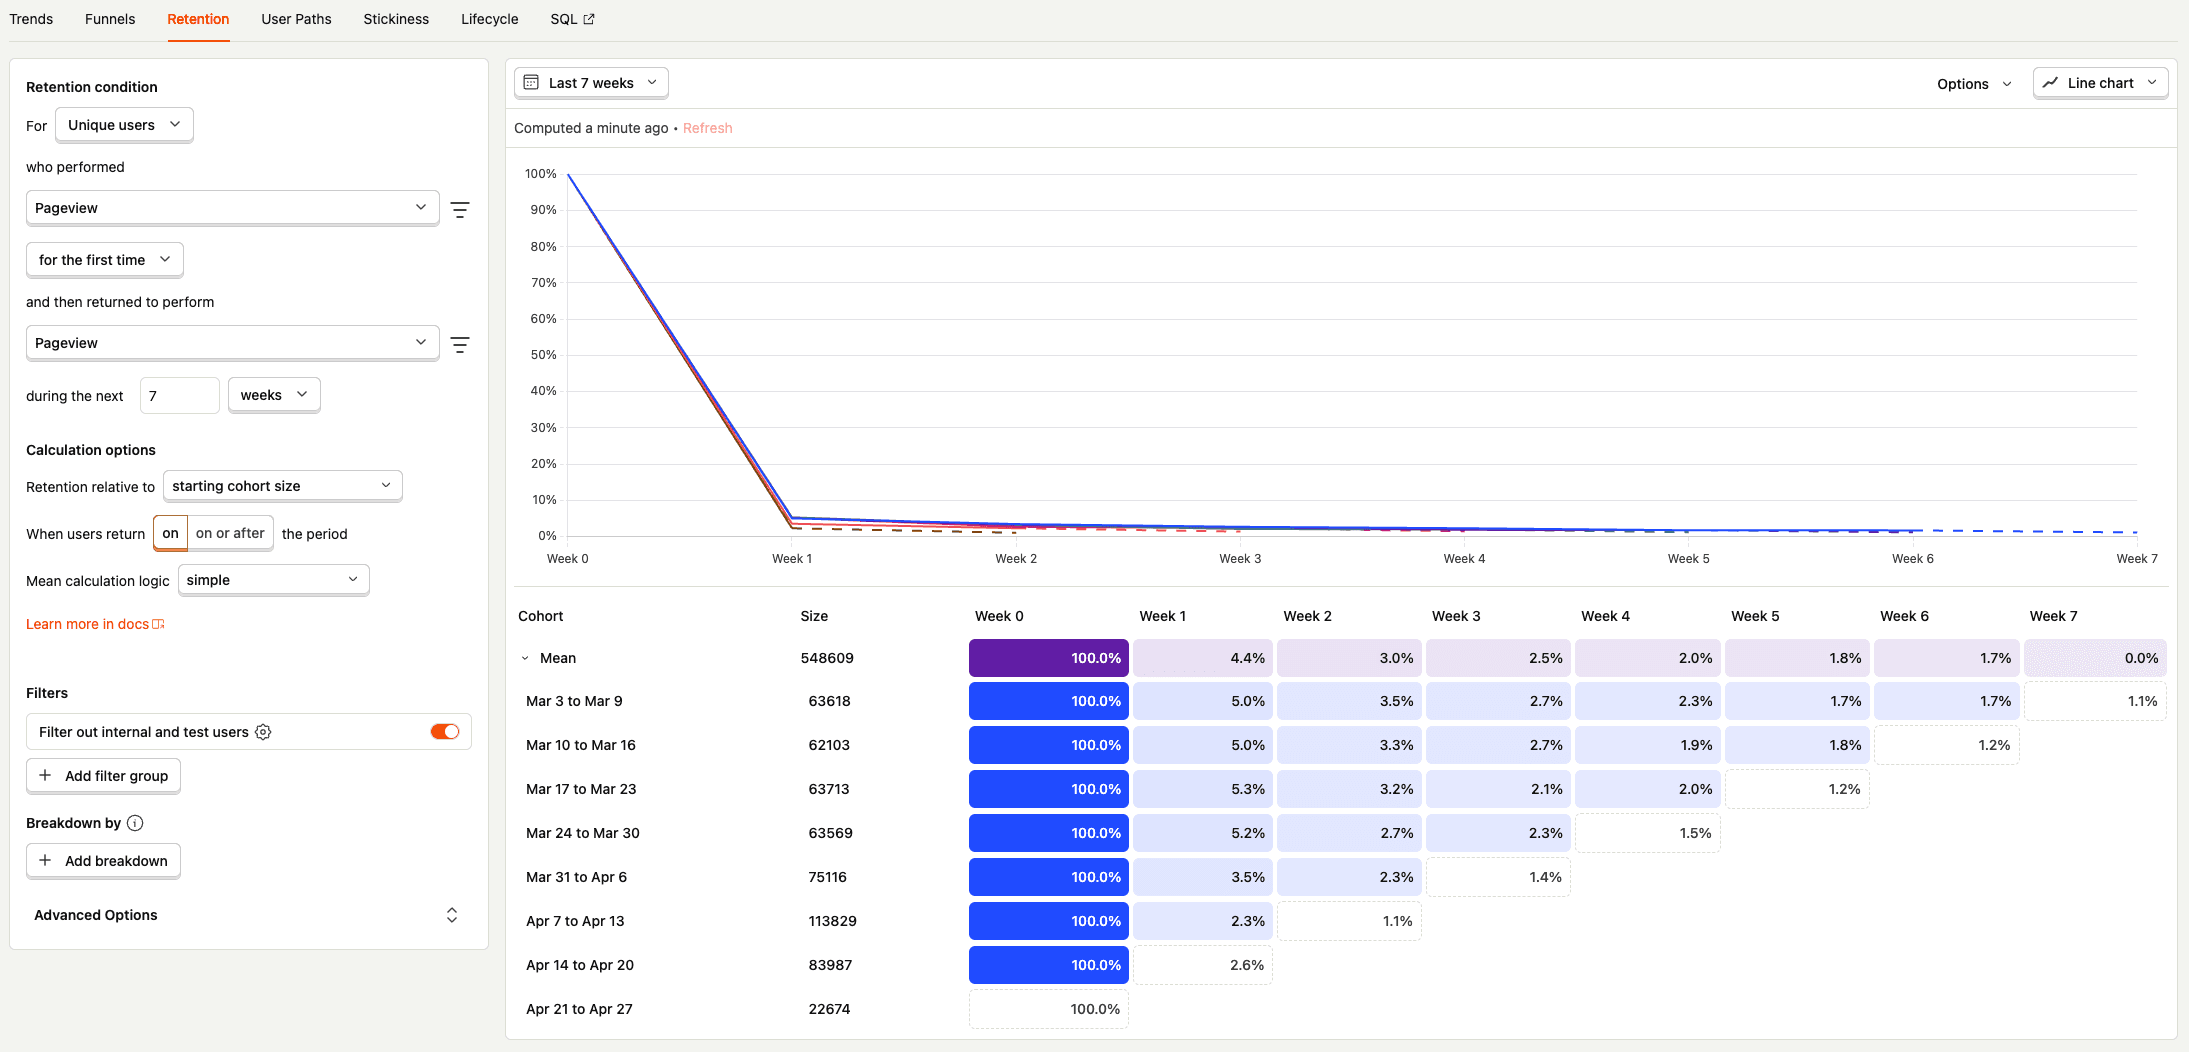
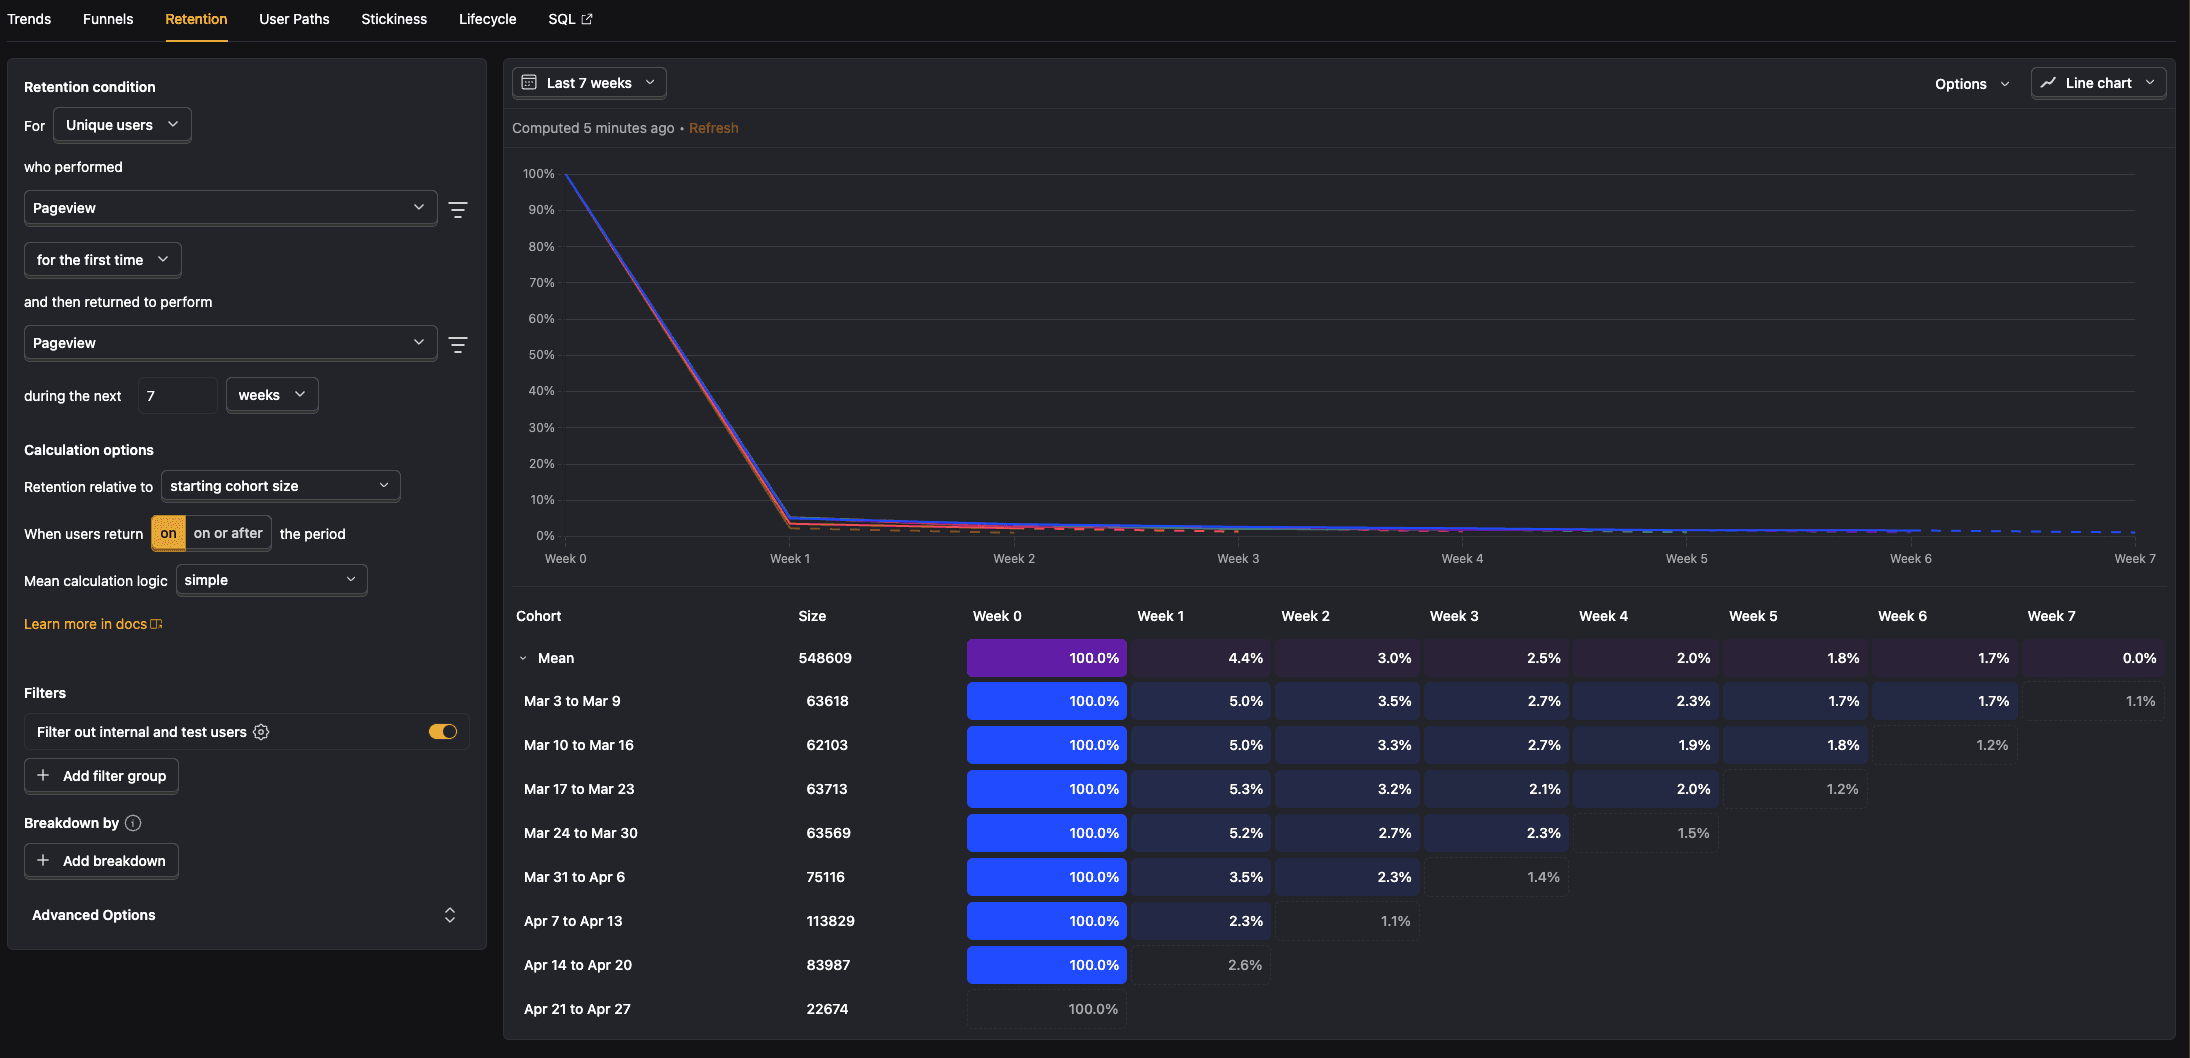
Retention insights are visualized in two ways:
- A retention graph, where each cohorts retention is rendered in a comparable line or bar graph.
- A cohort retention table, where the same data is shown in a table.
By default, both show the percentage of users who retained in each cohort relative to 'Week 0'.
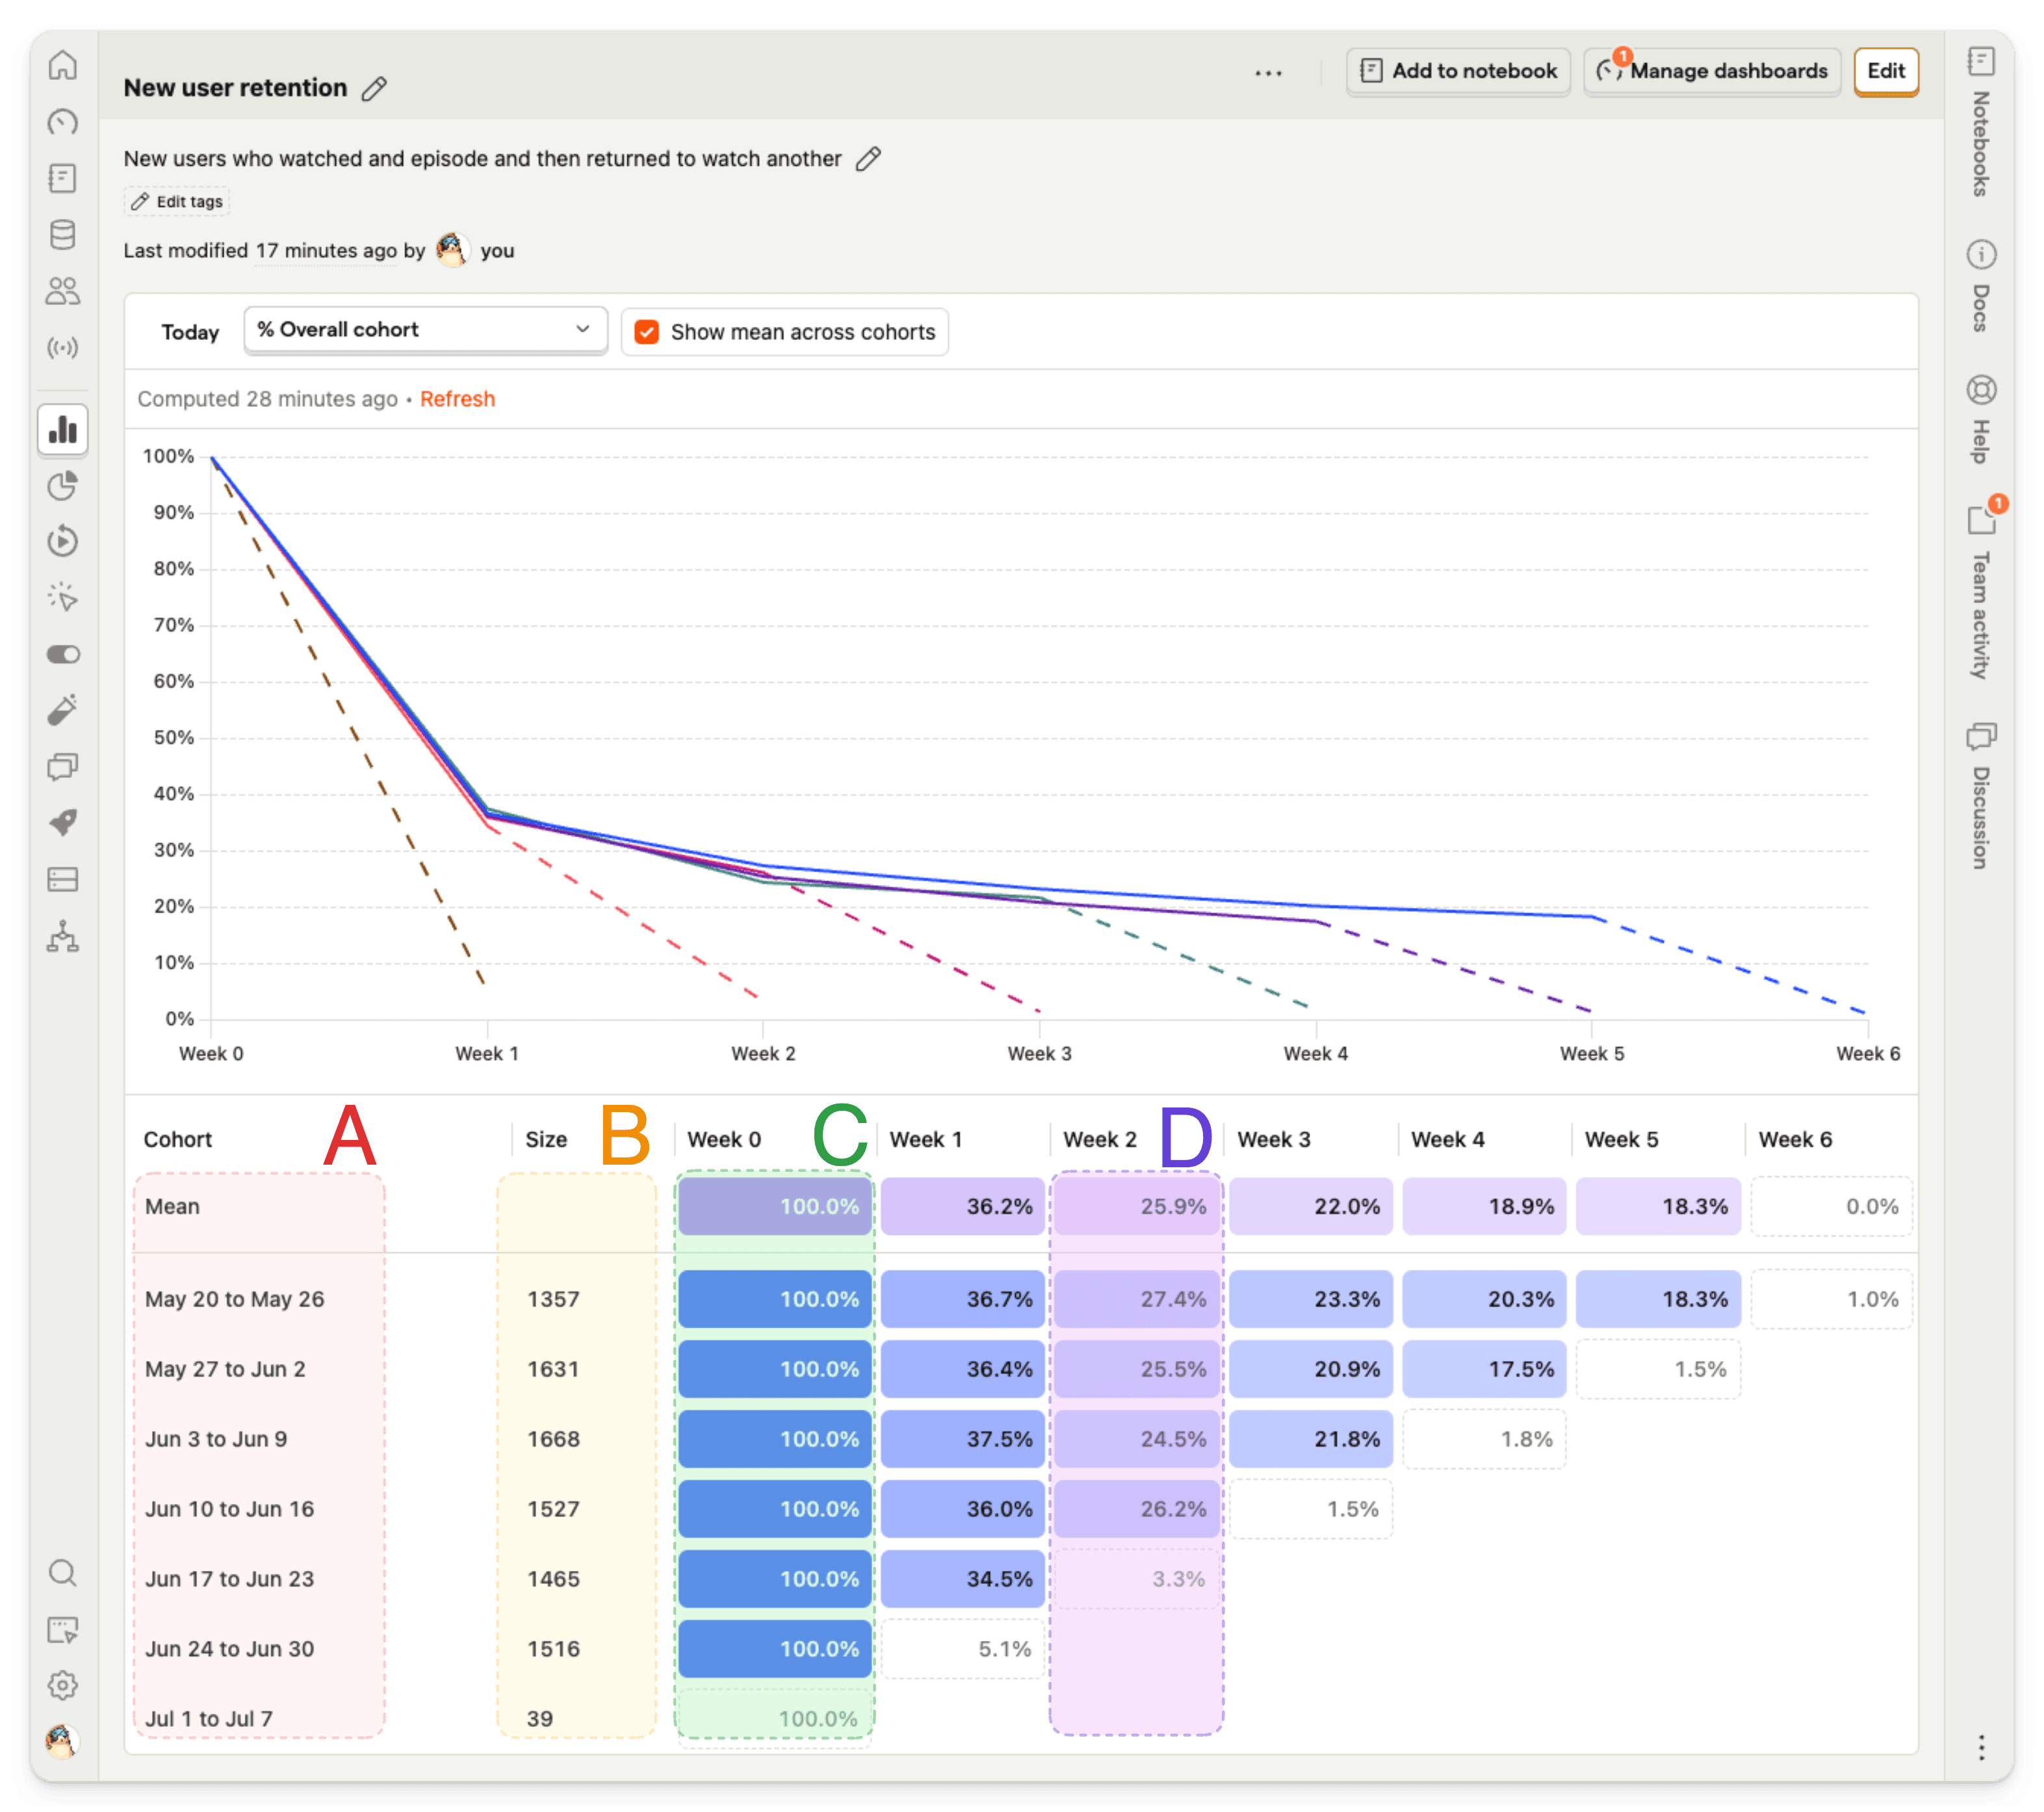
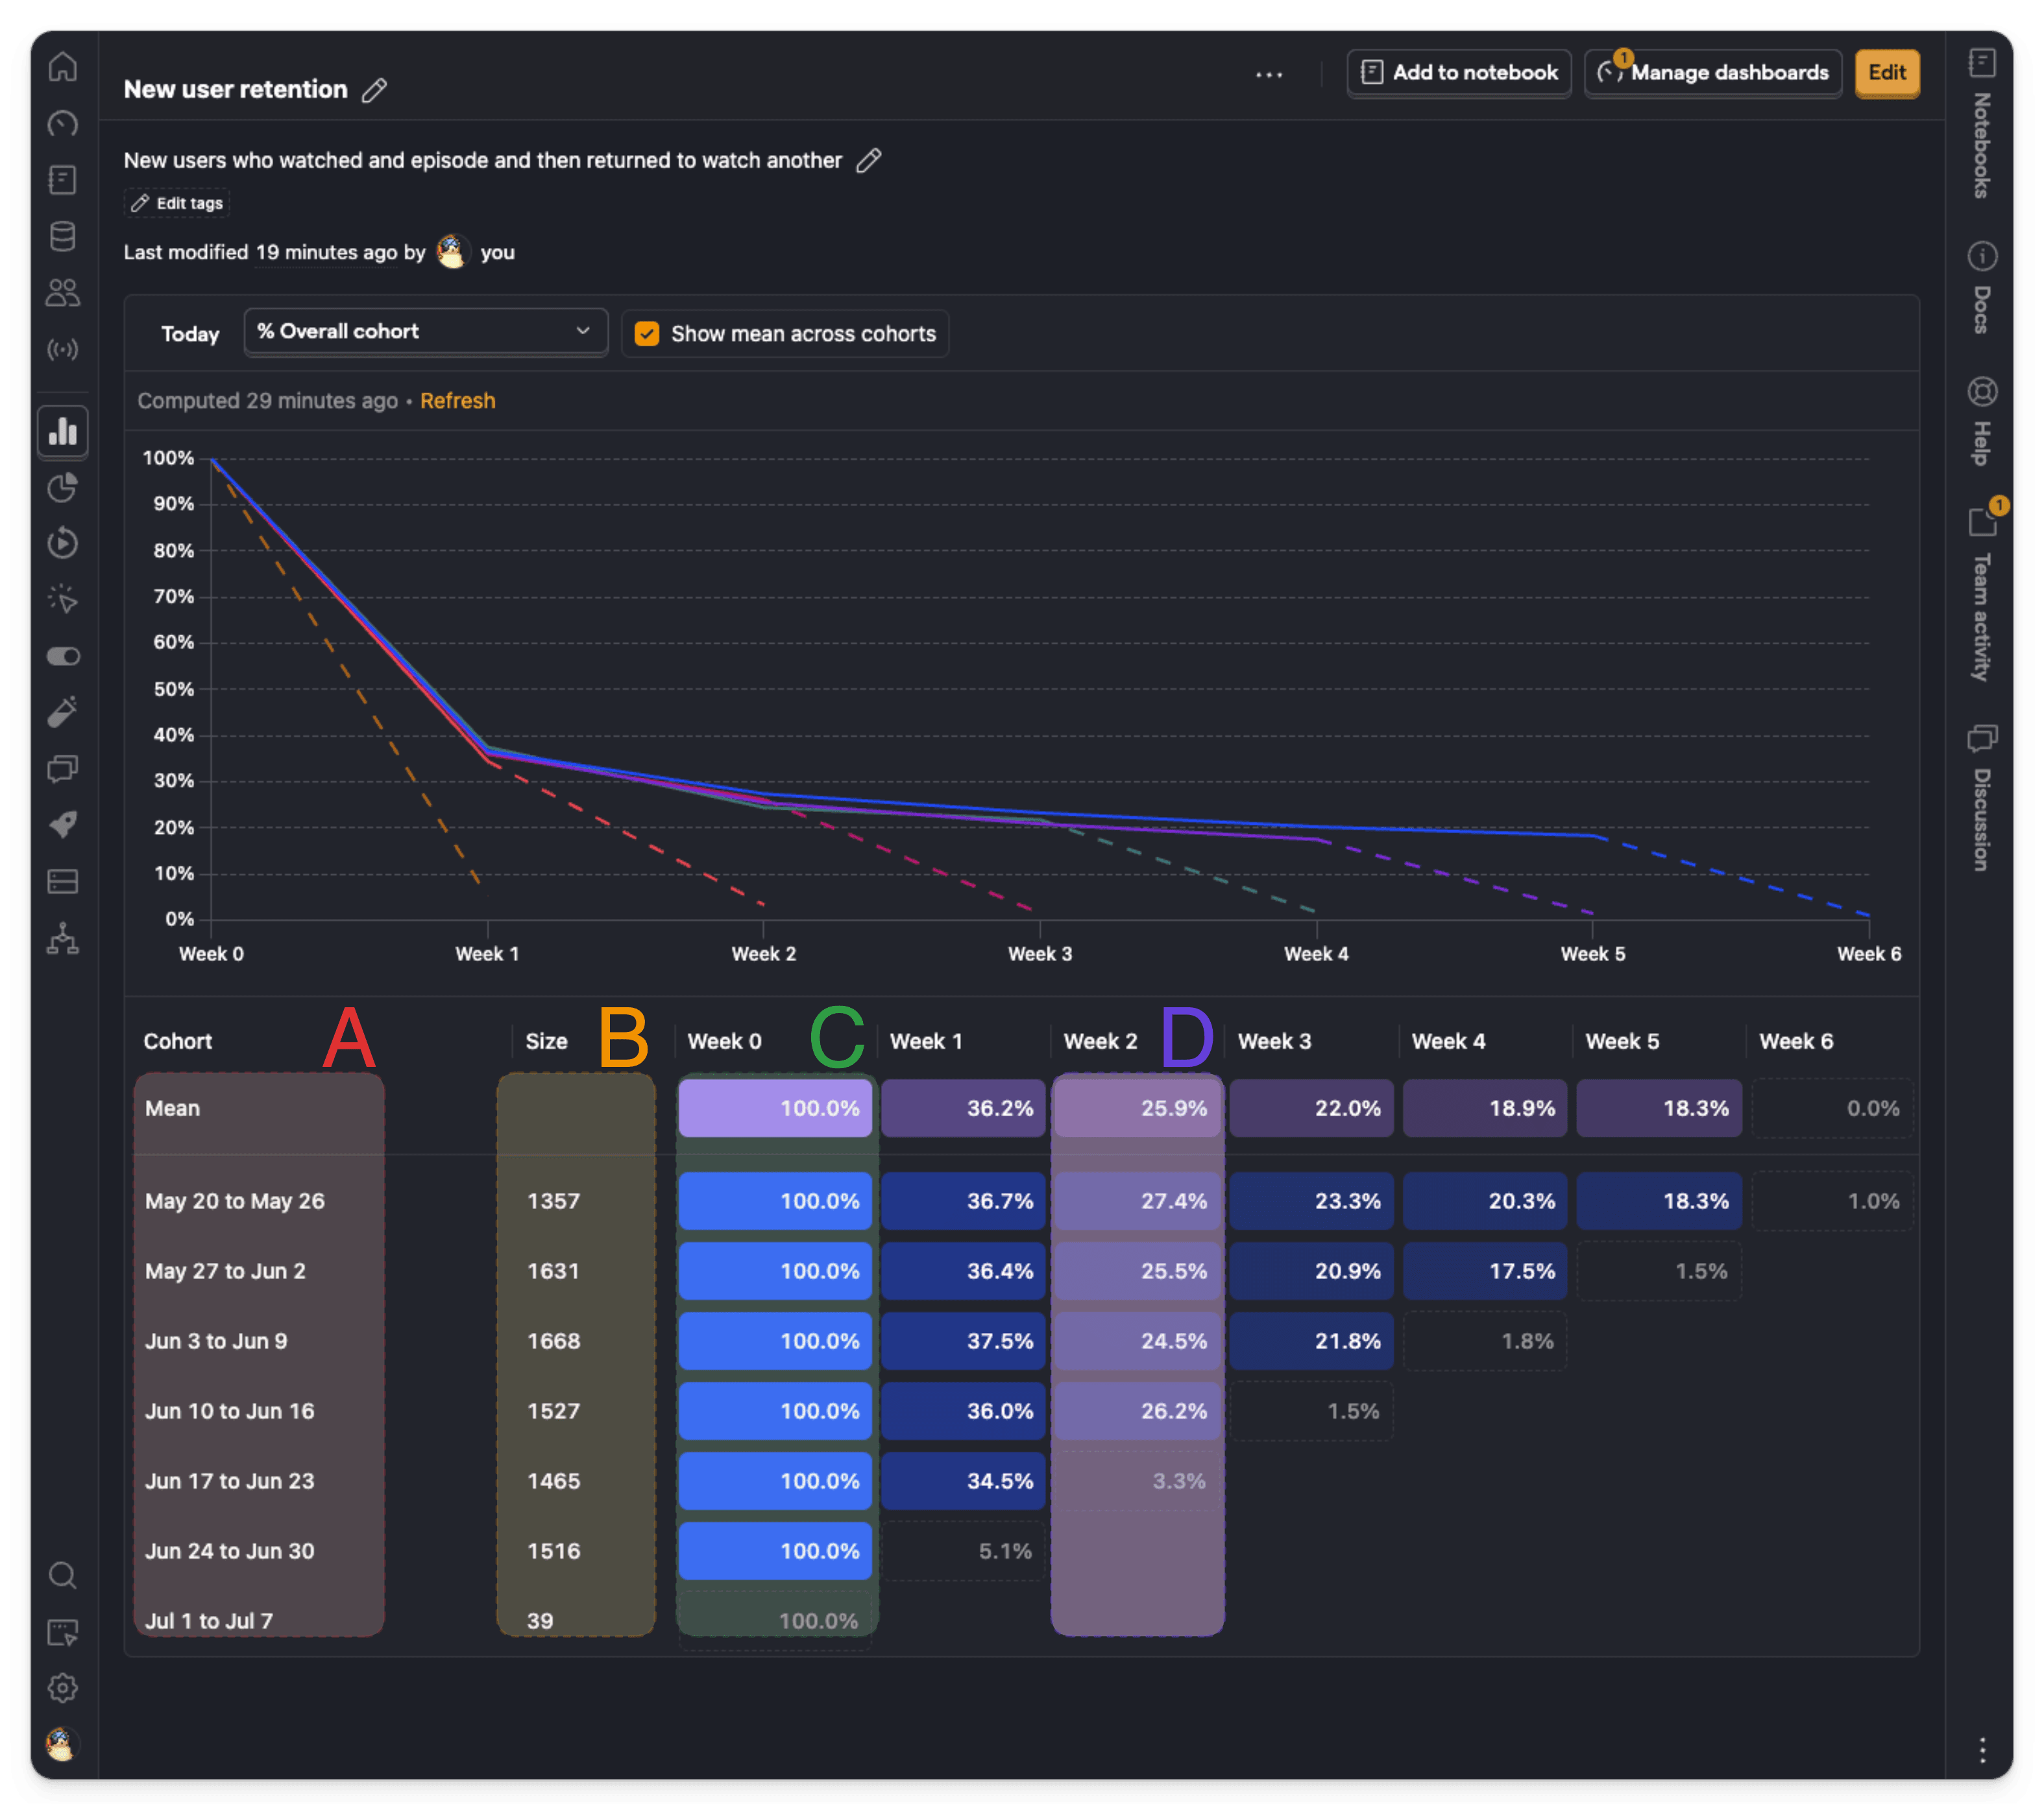
Here's a breakdown of the columns in the table:
Column A denotes the cohort. This retention insight is grouped by week, so it shows the date range of the six most recent weeks, and the seventh currently incomplete week.
Column B shows the size of each individual cohort. As noted earlier, retention insights default to unique users, but they can also use groups.
Column C is 'Week 0' - i.e. the week in which the start event or action first took place. This is always 100% because all users in that cohort must perform the event to be included. This would be 'Hour 0', 'Day 0', or 'Month 0' if you choose a different time period. You can change the starting index to start at 1 instead of 0.
Column D is Week 2 - i.e. the second week after the cohort was created. In this example, 27.4% of the 'May 20 to May 26' cohort retained, or 372 users.
Tips for analyzing retention insights
Users cannot exist in more than one cohort - i.e. a user in the 'May 20 to May 26' won't also appear in the 'Jun 3 to Jun 9' cohort.
Users can appear in more than one retention period - i.e. they could be counted in both 'Week 1' and 'Week 3', or all six weeks. This means that it's possible for a later period to have higher retention than an earlier period. This could suggest that users tend to return in a regular pattern - i.e. every few days or weeks - to perform a specific task.
Retention insights only show you whether users performed an action or event, not how often. For that, create a stickiness insight.
Periods in progress are marked with a tooltip indicating they're not yet complete. These periods will update as more data comes in.
Clicking on a retention cell opens a modal with details about the specific users retained in that period, allowing for deeper analysis.
Retention calculation options
Select between two retention reference options: "Period 0" (default) and "Previous period". The reference determines how percentages are calculated - either relative to the initial cohort or the previous period.
Choose between weighted mean (default) and simple mean for retention calculation. Weighted mean accounts for different cohort sizes when calculating the average retention, while simple mean treats all cohorts equally.
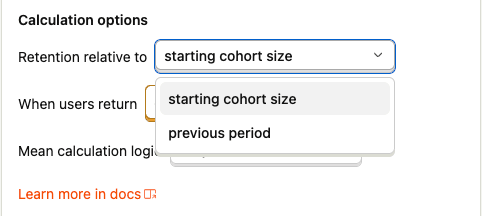
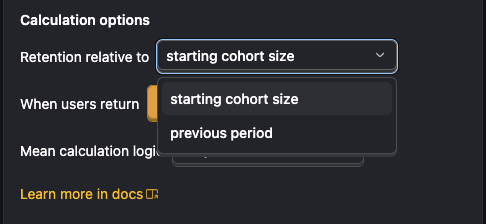
Relative retention
There are two options for calculating retention percentage over time:
Starting cohort size (default). The percentage of users or groups who returned compared to the initial cohort size. For example, if Day 3 shows 25% for a cohort, it means that 25% of the users who performed the start event returned on Day 3.
Previous period. The percentage of users or groups who returned compared to the previous period. With this option if Day 3 shows 40%, it means that 40% of the number of users who returned on Day 2 returned on Day 3. The option helps to see which time interval has the biggest percentage increase/drop offs in users.
Returning time criteria
There are two options for calculating who is included in the returning cohort:
On (default). Only users who returned (performed 'return event') on the specific time interval are included. This is useful when you feature requires users to come back in each and every time interval.
On or after. Also known as cumulative, rolling or unbounded retention. When selected, the retention number for a specific time interval, say Day 2, includes user who returned on or after Day 2 (i.e. users who returned on Day 3, Day 4,... are also counted in Day 2). This is essentially the inverse of your overall churn rate. It shows how many people used your product and eventually returned to find more value. This is useful for evaluating features that don't require users to come back in every time period.
Mean calculation logic
You can choose between two different calculation options for the mean/average retention for each time interval.
Simple. Calculates the average retention rate across all cohorts by giving equal weight to each cohort, regardless of its size.
Weighted. Calculates the average retention rate by giving more weight to larger cohorts, accounting for different cohort sizes in the final mean.
Cohort label start index
By default, retention insights label the first period as "Day 0", "Week 0", or "Month 0" depending on your selected time period. Some teams prefer starting at 1 (e.g., "Day 1", "Week 1") to align with internal KPIs or business conventions.
To change the starting index, click Options and find Cohort labels start at. Choose between:
- Period 0 (default) - Labels start at 0 (e.g., "Day 0", "Week 0")
- Period 1 - Labels start at 1 (e.g., "Day 1", "Week 1")
The label adapts to your selected retention period (Hour, Day, Week, or Month). This setting only affects display labels in the chart and table – underlying data, calculations, and cohort sizes remain unchanged.
Breakdowns
You can break down your retention numbers and graph by the following property types:
| Name | Description |
|---|---|
| Event properties | Properties specific to a tracked event (e.g. Country Name) |
| Person properties | Properties stored on a user's person profile (e.g. company_name) |
| Feature flags | Events where a specific feature flag was enabled |
| Group properties | Properties stored on a group (requires group analytics) |
| Cohorts | Events performed by a pre-defined list of users |
| SQL expression | A custom SQL expression for derived or computed values (e.g. upper(properties.$browser)) |
For example, breaking down by Country Name can help you see which countries have higher retention for a feature.
When using breakdowns, you see the mean retention for each breakdown value and can click on each row to expand and show each cohort with that breakdown value. There is also a dropdown selector which lets you filter the graph and table for a specific breakdown value.
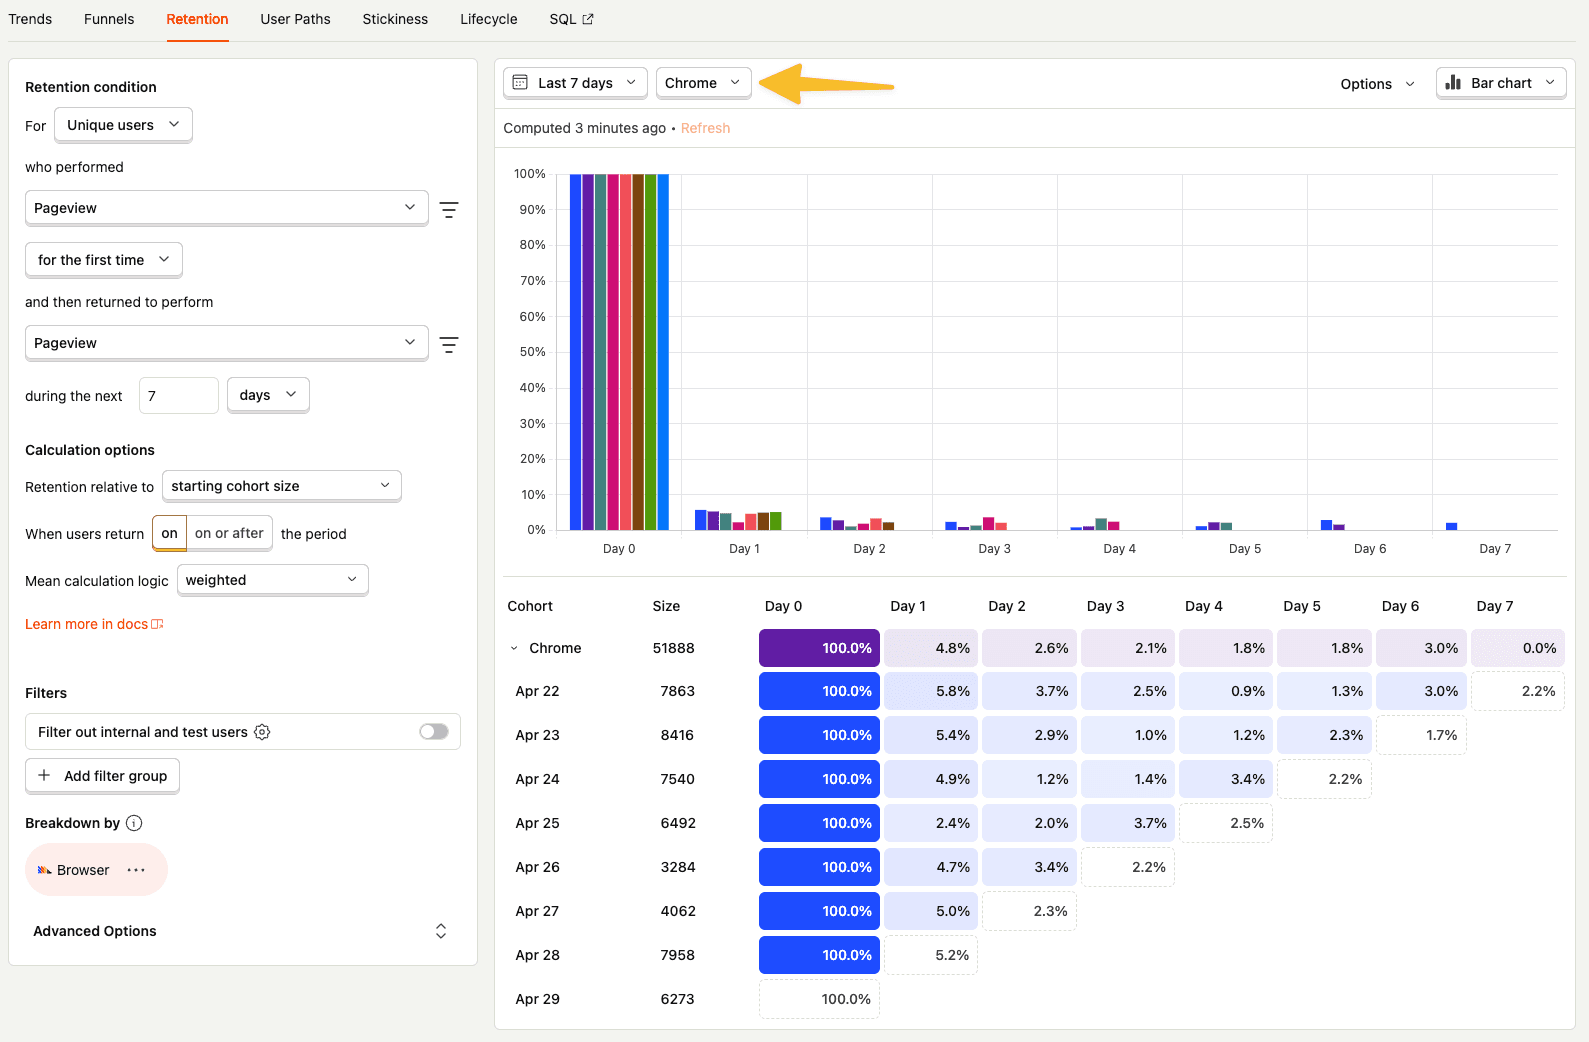
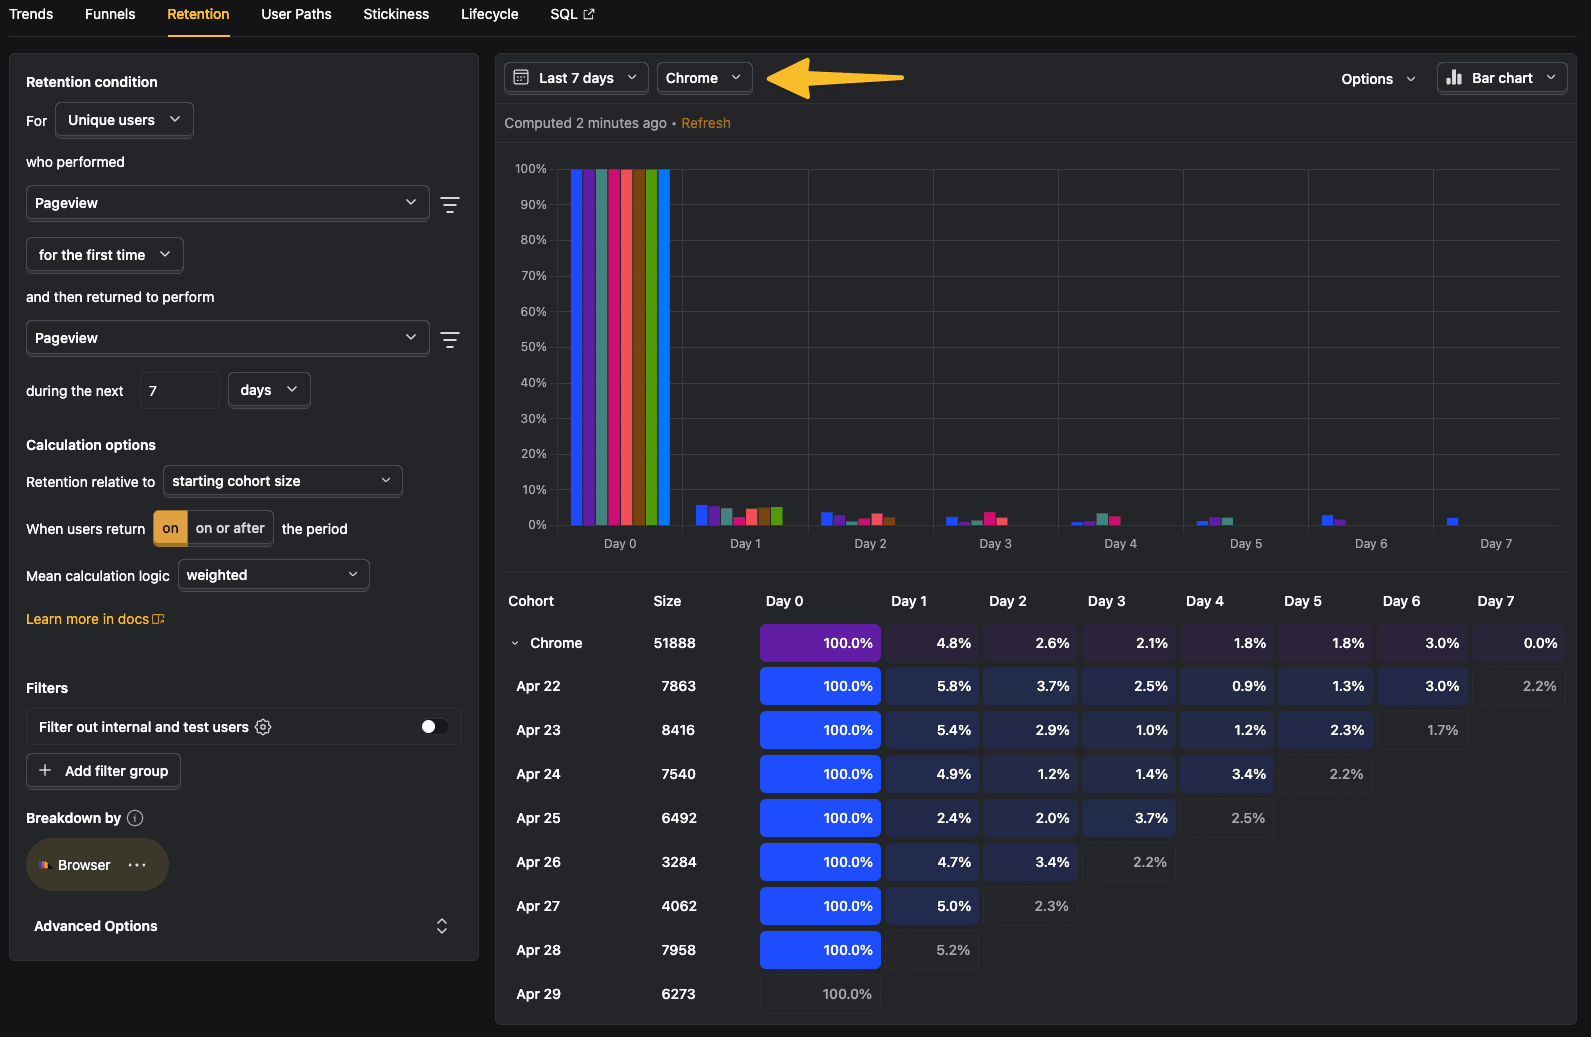
The breakdown logic is implemented such that both the start and return event must have the same breakdown value. For example, when breaking down by browser, if the user performs the start event in Google Chrome but performs the return event in Firefox, the return event won't be counted in the breakdown results for Google Chrome.
Displaying retention insights
When saving a retention insight, there are two things to consider:
- Whether you want it to show as a line or bar chart. Choose this on the chart when creating an insight.
- Whether you want it to show as a chart or a table (or both) on a dashboard. Choose this after saving the insight by clicking on Options and then set it to Show table only, Show graph only, or Show both.
Retention vs. Stickiness
Stickiness and retention insights can look very similar, but they tell you different things:
- Retention measures the percentage of users who came back and performed an event within a given period at least once
- Stickiness measures how many times within a period a user performed an event
Retention is good for seeing how well you're doing at keeping users engaged overall. Stickiness is useful for seeing deeply users are engaging with your product and helps you identify the most engaged users.