Correlation analysis
Contents
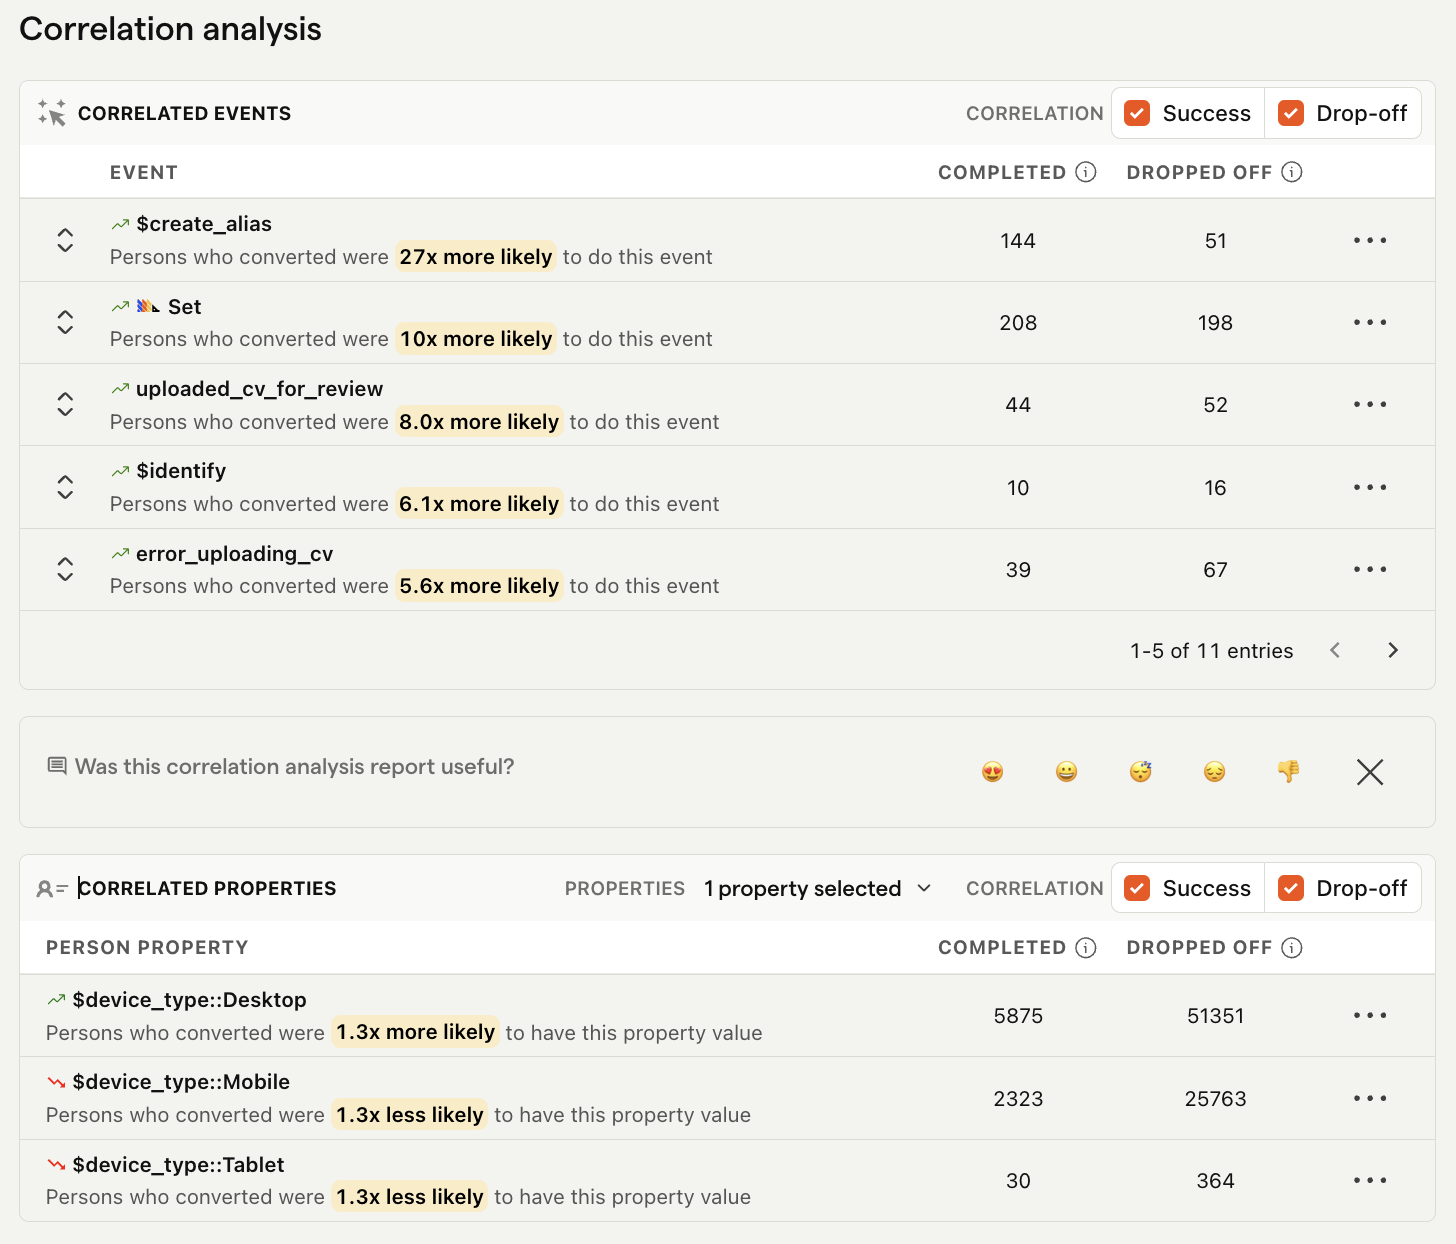
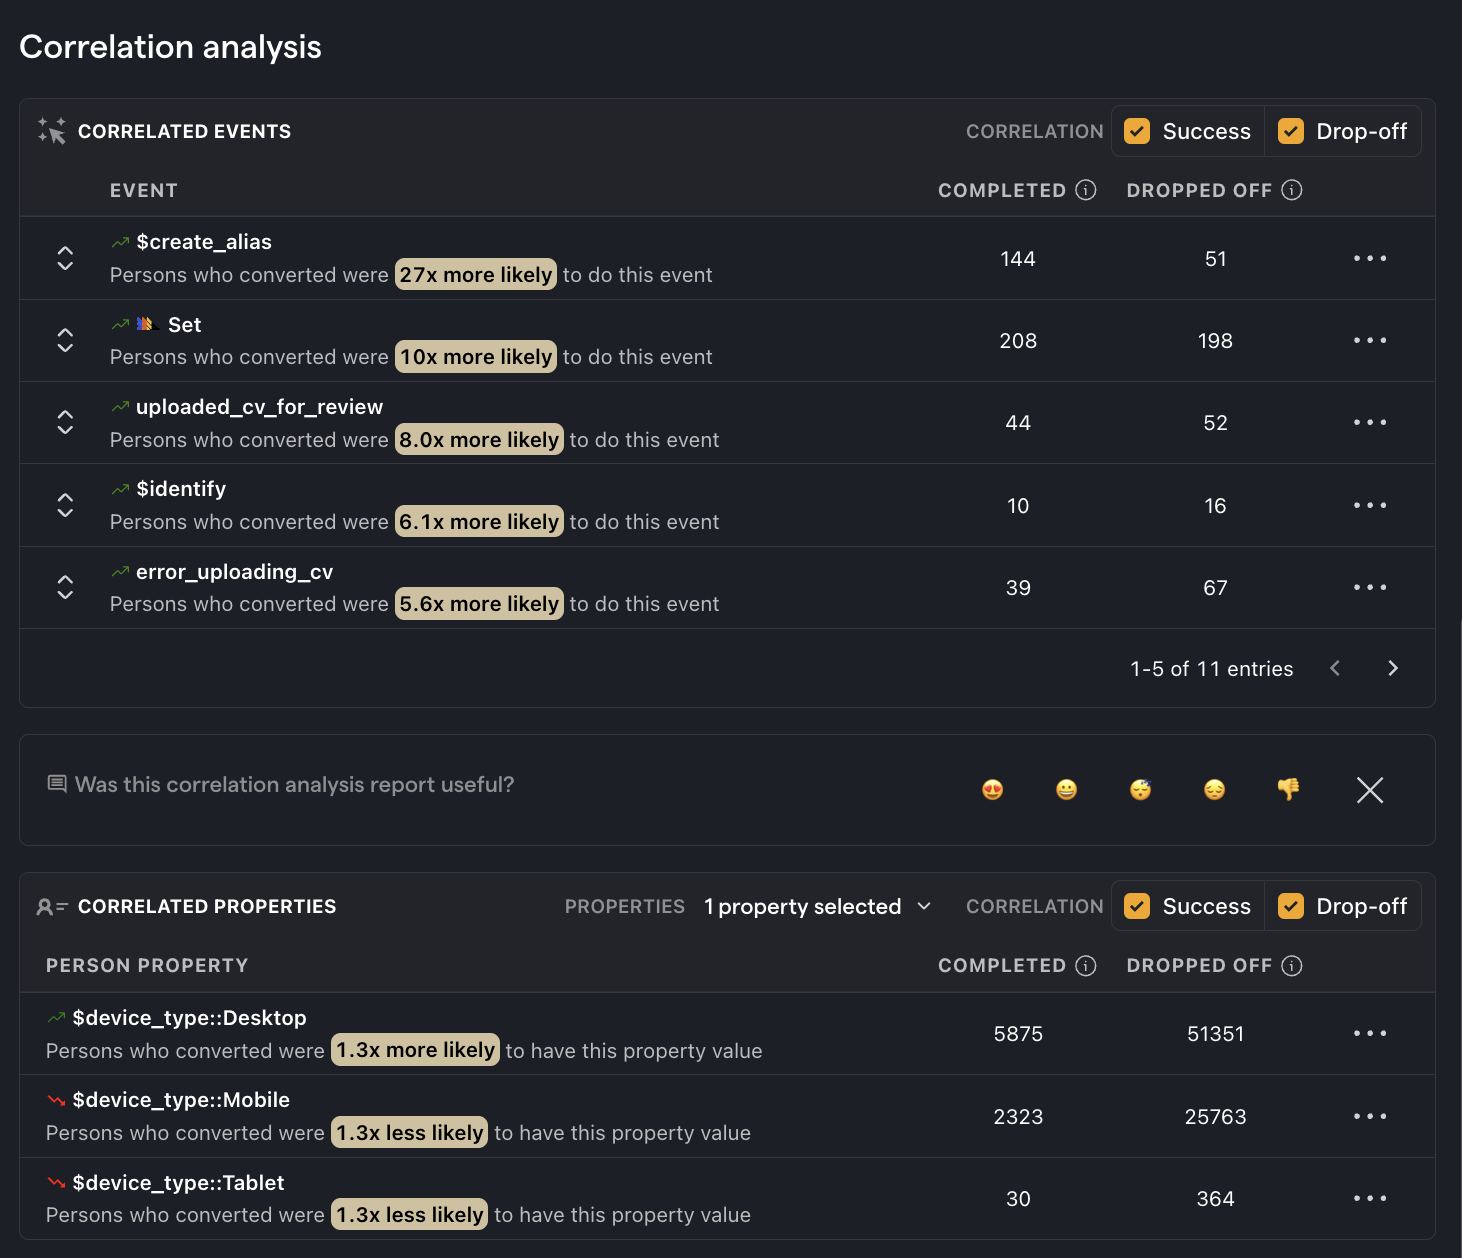
Correlation analysis is a feature within funnels that automatically highlights significant factors impacting conversion rate.
Funnels have the ability to directly compare conversion rates of users for a specific property via the breakdown feature, but this requires you to know which property to investigate. If you're not certain, correlation analysis highlights significant events or properties for you.
As an example, the below insight shows that desktop users were 1.3x more likely to convert than mobile or tablet users. We also see that users who completed the uploaded_cv_for_review event while active in the funnel were 8.0x more likely to convert.
It's important to remember that the accuracy of any correlation depends on the sample size. If you've only got a handful of users for a specific correlation, then it's likely that it will not be accurate.
How to create a correlation analysis
In any funnel insight, scroll to the Correlation analysis section and click the Load results or Select properties buttons.
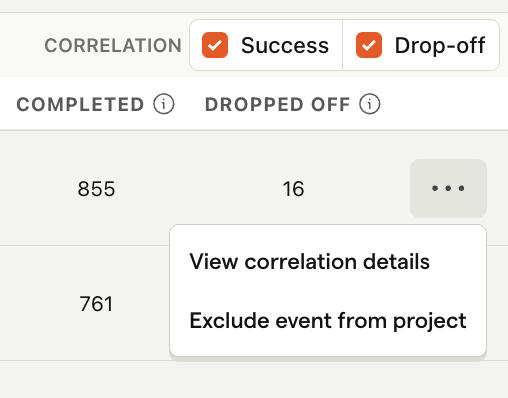
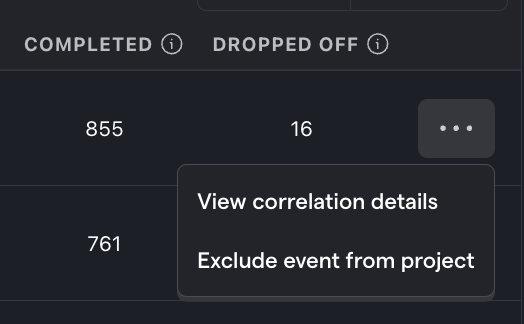
Once you've created a correlation, you can also create a cohort of users in an analysis by clicking the numbers in the Completed or Dropoff columns and then the Save as cohort button in the modal.
Excluding events or properties
You have better context on your product and what could be relevant signal or not. There will be some events and/or properties that are trivial or don't provide an actionable insight.
To remove these from your correlation insights, click the ... (more options) buttons and then Exclude event from project.