


Funnels
Contents
For every flow in your product, more people will start it than complete it successfully. Funnels enable you to visualize your flows and understand where the friction points are so that you can improve them.
You can learn the following from funnels:
- Where people are getting stuck during your flow
- Who successful and unsuccessul users are
- The steps with the highest friction and time to convert
- The paths users take in a funnel
- If product changes are improving your funnel over time
- How seasonality affects your conversion rates
How to create a funnel
- Click Product Analytics on the left sidebar
- Click the + New Insights tab
- Select the Funnel option in the dropdown
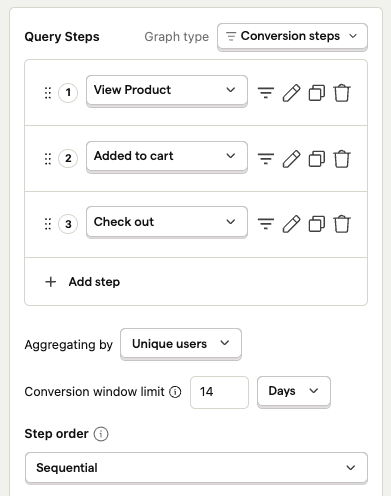
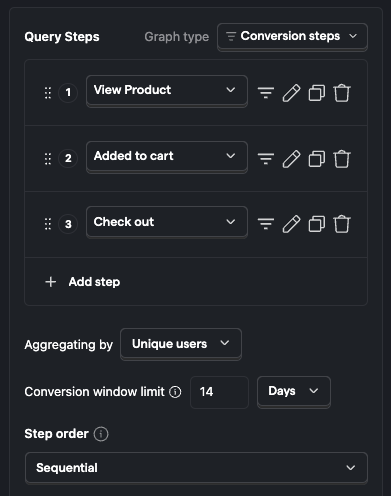
Adding steps
Select the steps to include in your funnel, ideally starting with the first event or action a user will trigger in the flow.
Next, add events users must complete to proceed through the funnel, ending with the event you consider the success for this flow. It's best to start with the simplest flow and avoid using optional steps to ensure you don't filter out or skew results.
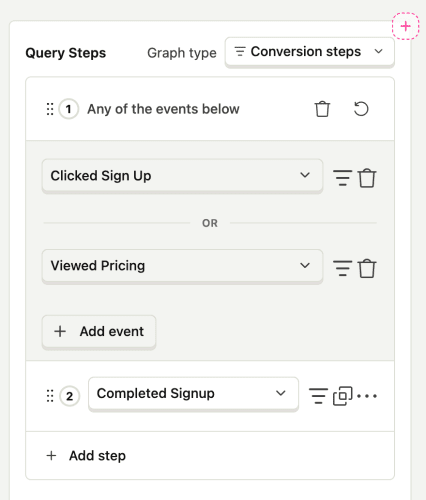
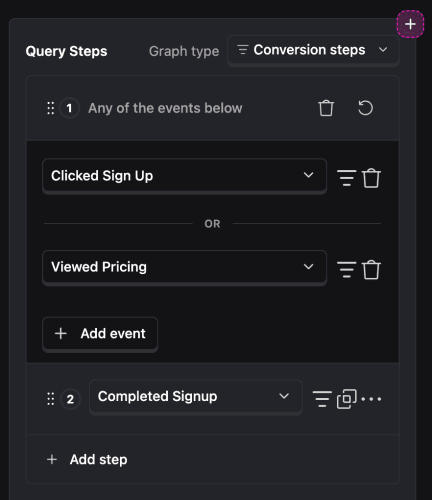
Combine events inline
You can combine multiple events into a single funnel step using inline combination. This lets you treat several events as one step without creating a custom action.
Select the events to include in a step, and they're combined using a logical OR – any occurrence of the selected events counts toward that step. This works the same way as combining events inline in trends.
By default, funnel steps must be completed sequentially, however you are able to change this behavior by selecting one of three different step orders:
- Sequential – Step B must happen after Step A, but any number events can happen between A and B.
- Strict order – Step B must happen directly after Step A without any events in between.
- Any order – Steps can be completed in any sequence.
If you add multiple steps with the same event type, it will require the user to trigger that event multiple times. Think of funnel steps as actions to be performed, not filters to be applied.
For example, adding a clicked button step, then a second clicked button step that filters for the "Sign Up" button, will require the user to perform two distinct button clicks.
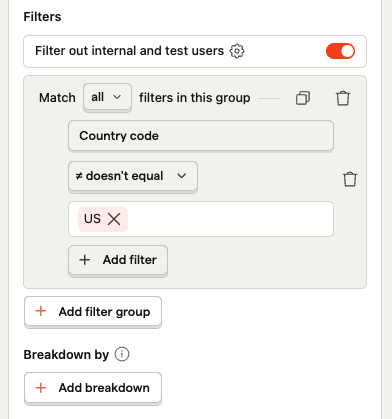
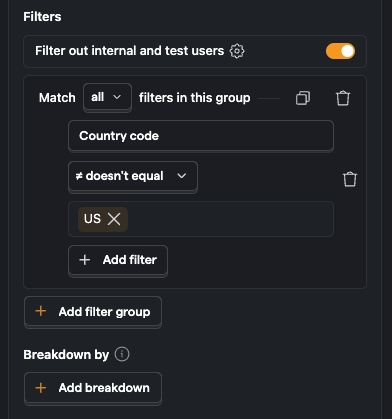
Filtering steps
To refine your steps, you can filter out events using event, person, or group properties, autocapture elements, or SQL. To do this, click the filter icon next to the step, choose your property, and fill in the details. You can also set a global filter in the Filters section in the bottom.
Note: Using person properties in funnels requires identified events and person profiles.
Excluding steps
You can also exclude people who completed certain events between two specific steps. To do this, add the step in the Exclusion steps section.
These people are completely excluded from the entire funnel.
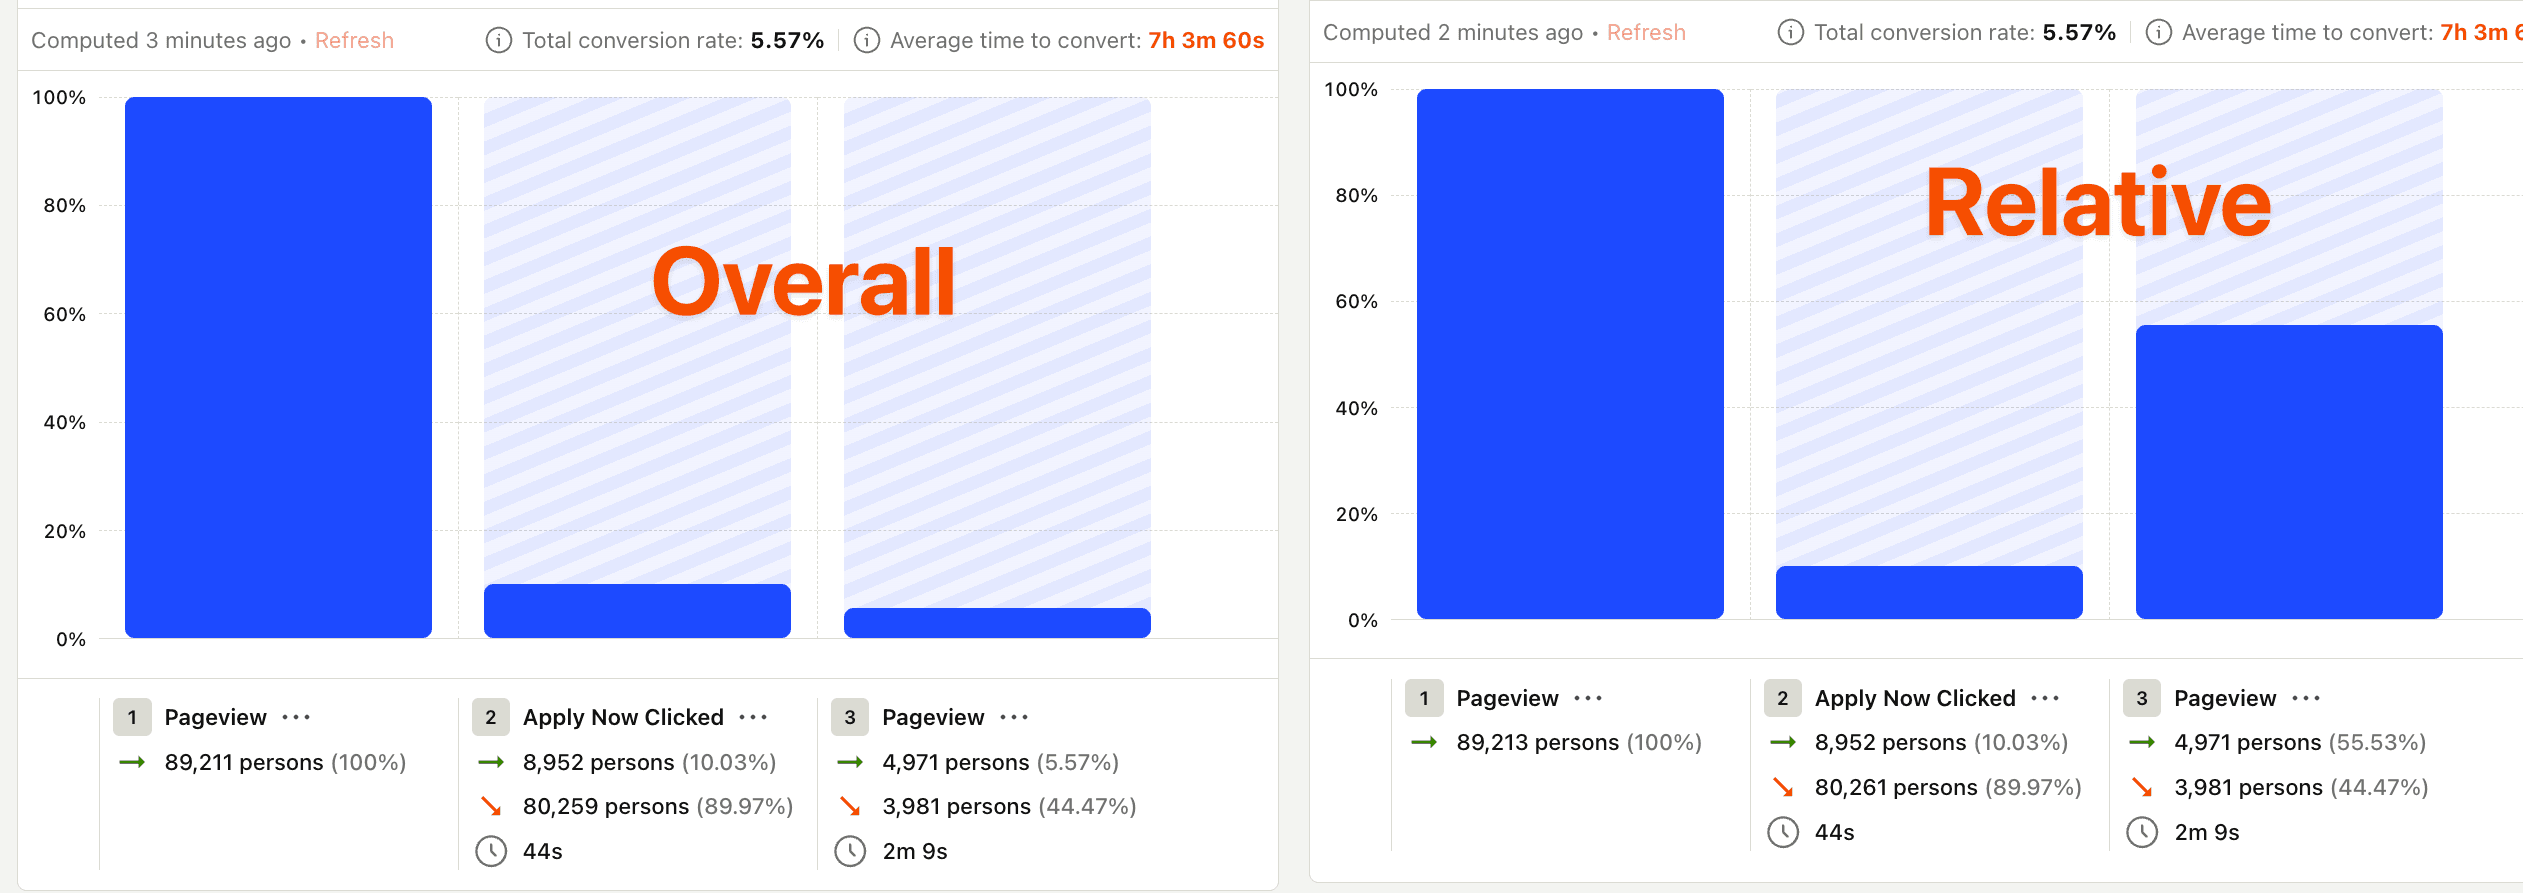
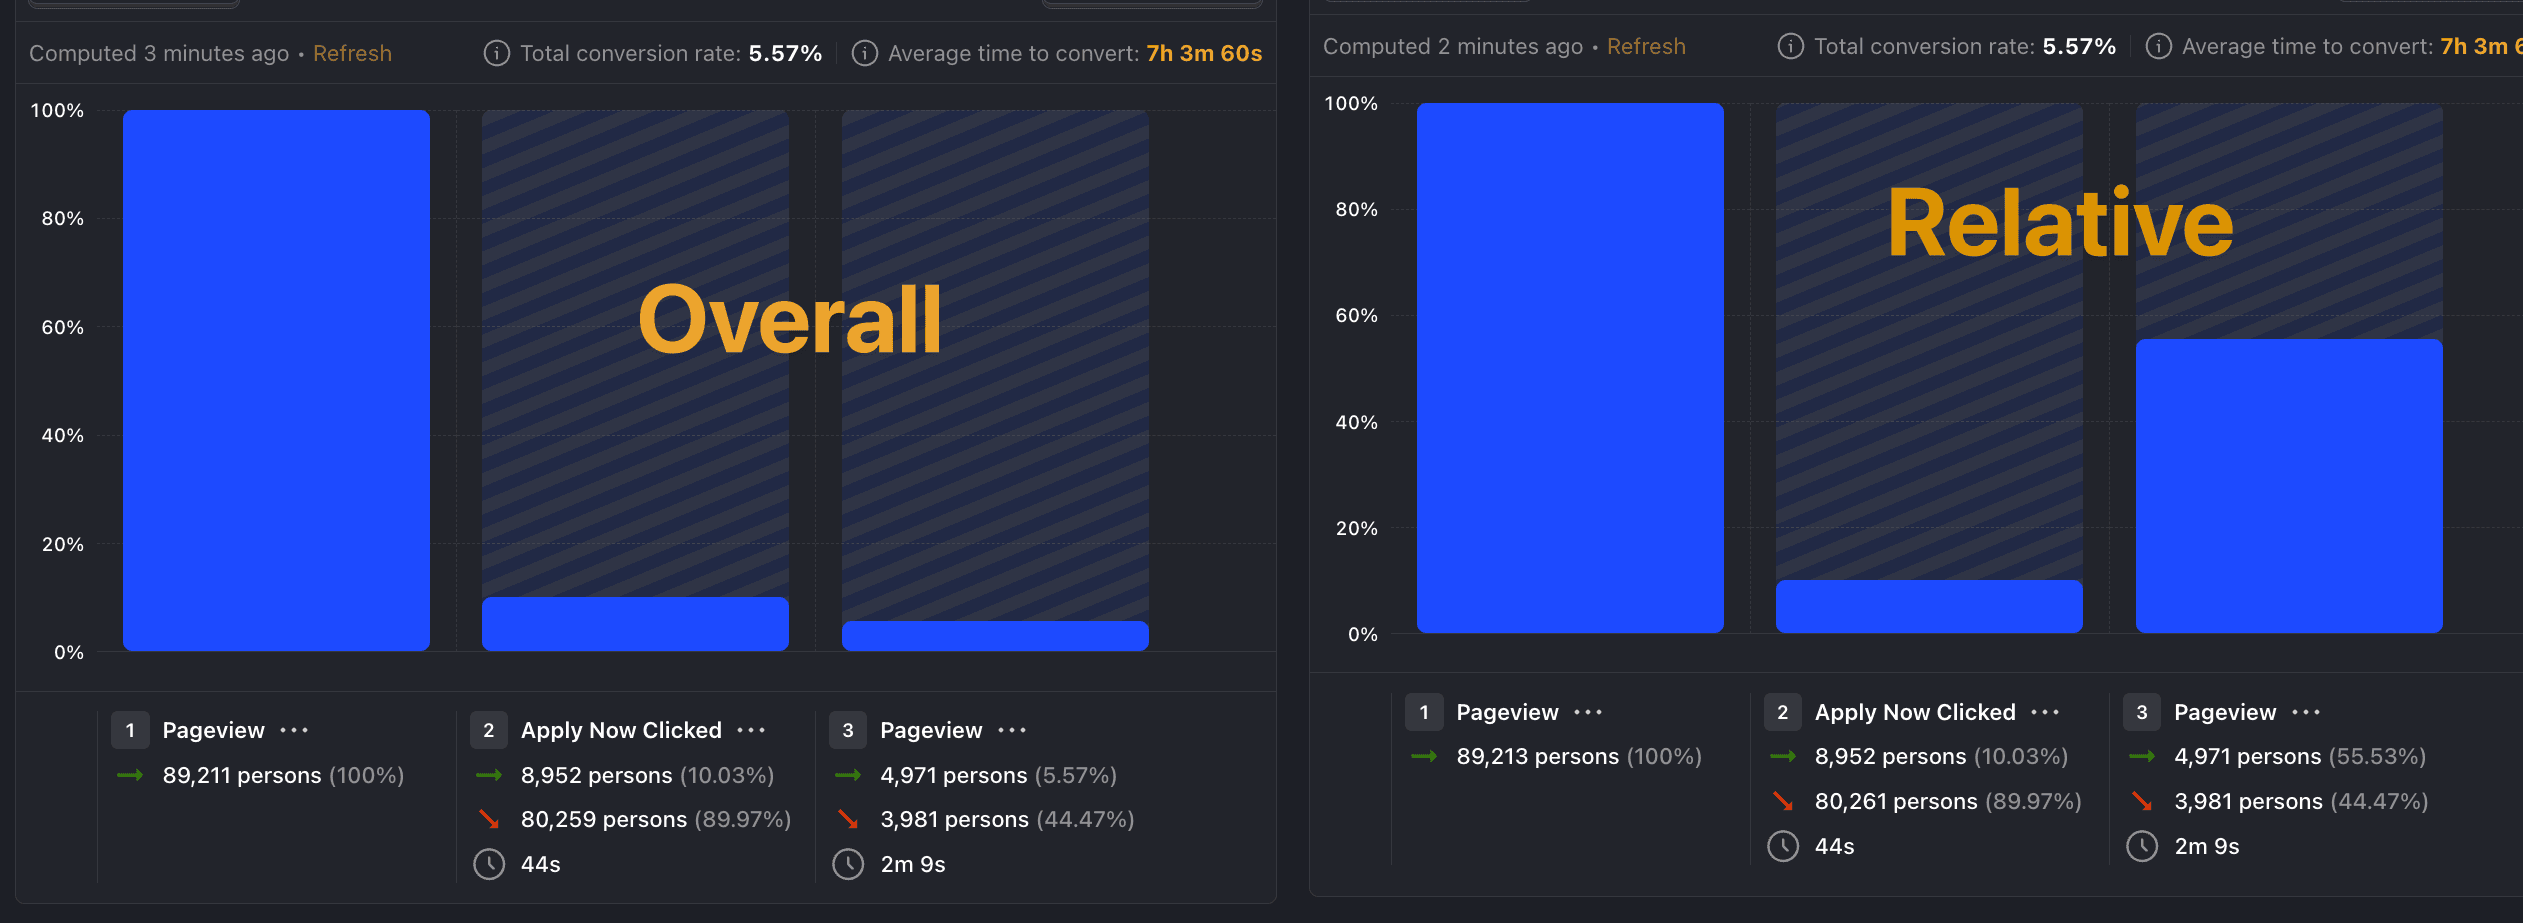
Conversion rate calculation
There are two options for showing conversion rates in a funnel:
- Overall conversion – for each step, this shows the conversion relative to the first step.
- Relative to the previous step – for each step, this shows the conversion relative to the previous step.
Overall conversion is helpful for understanding the entire funnel, whereas relative conversion shows you which steps have biggest opportunity for improvement.
Breakdowns
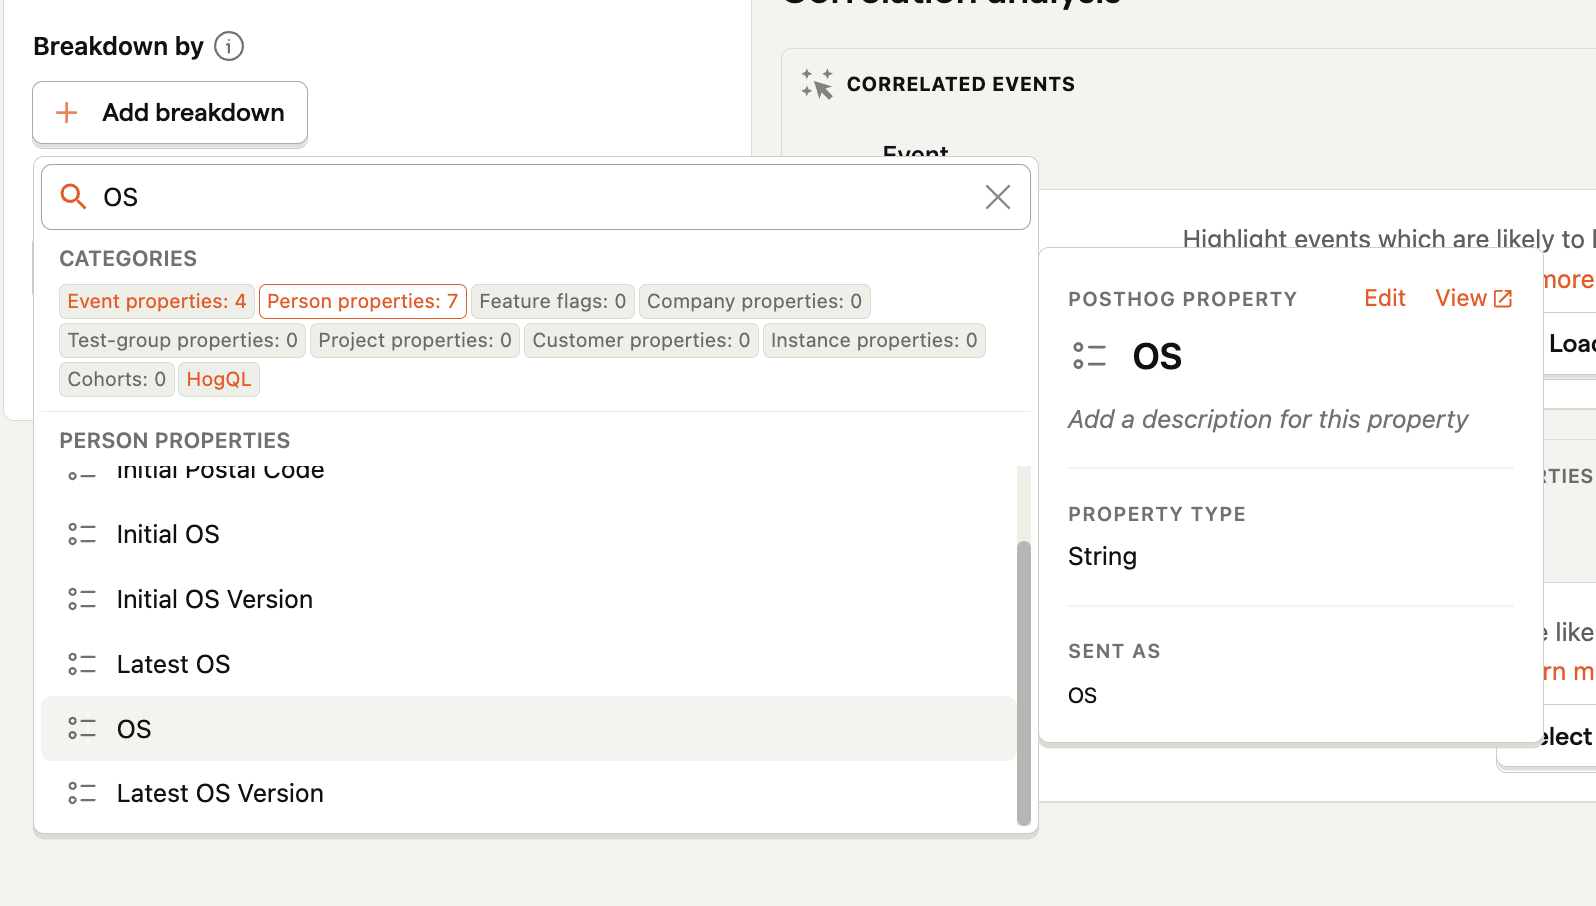
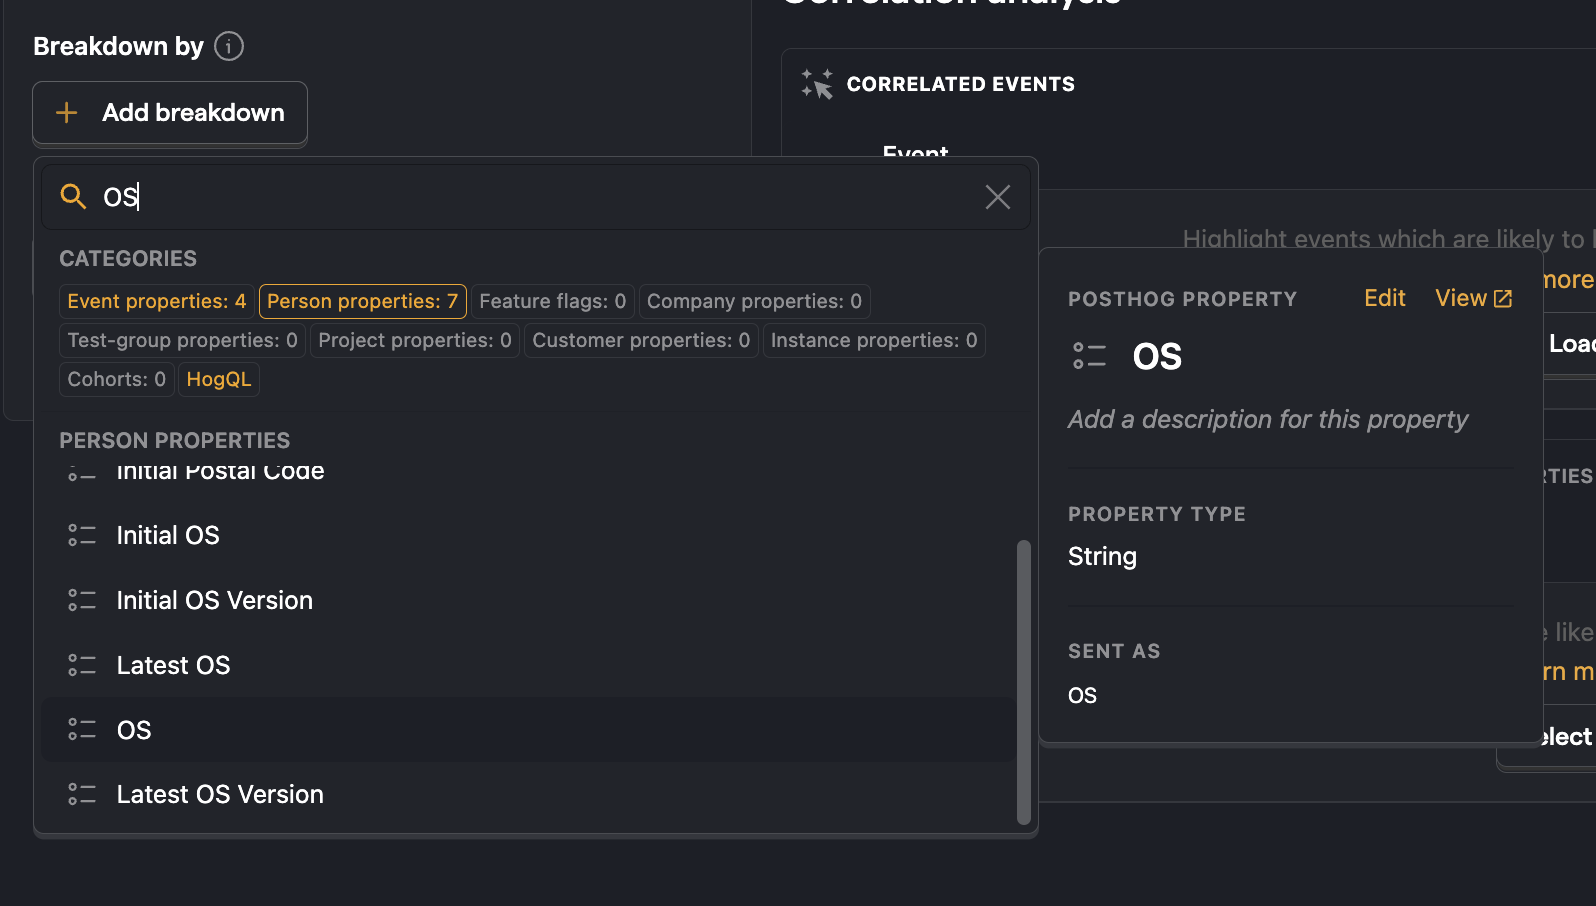
To understand how different types of user interact with your funnel, it's helpful to breakdown results. You can breakdown steps by event properties, person properties, and cohorts. To do this, click on the + Add breakdown button and select the property or cohort you want to break down by.
Note: Only one cohort can be used at a time for funnel breakdowns. This is because users can belong to multiple cohorts, which would produce confusing results.
Tip: When breaking down by
$current_urlor$pathname, your path cleaning rules automatically normalize dynamic URLs (like/user/123) into consistent patterns (like/user/:id).
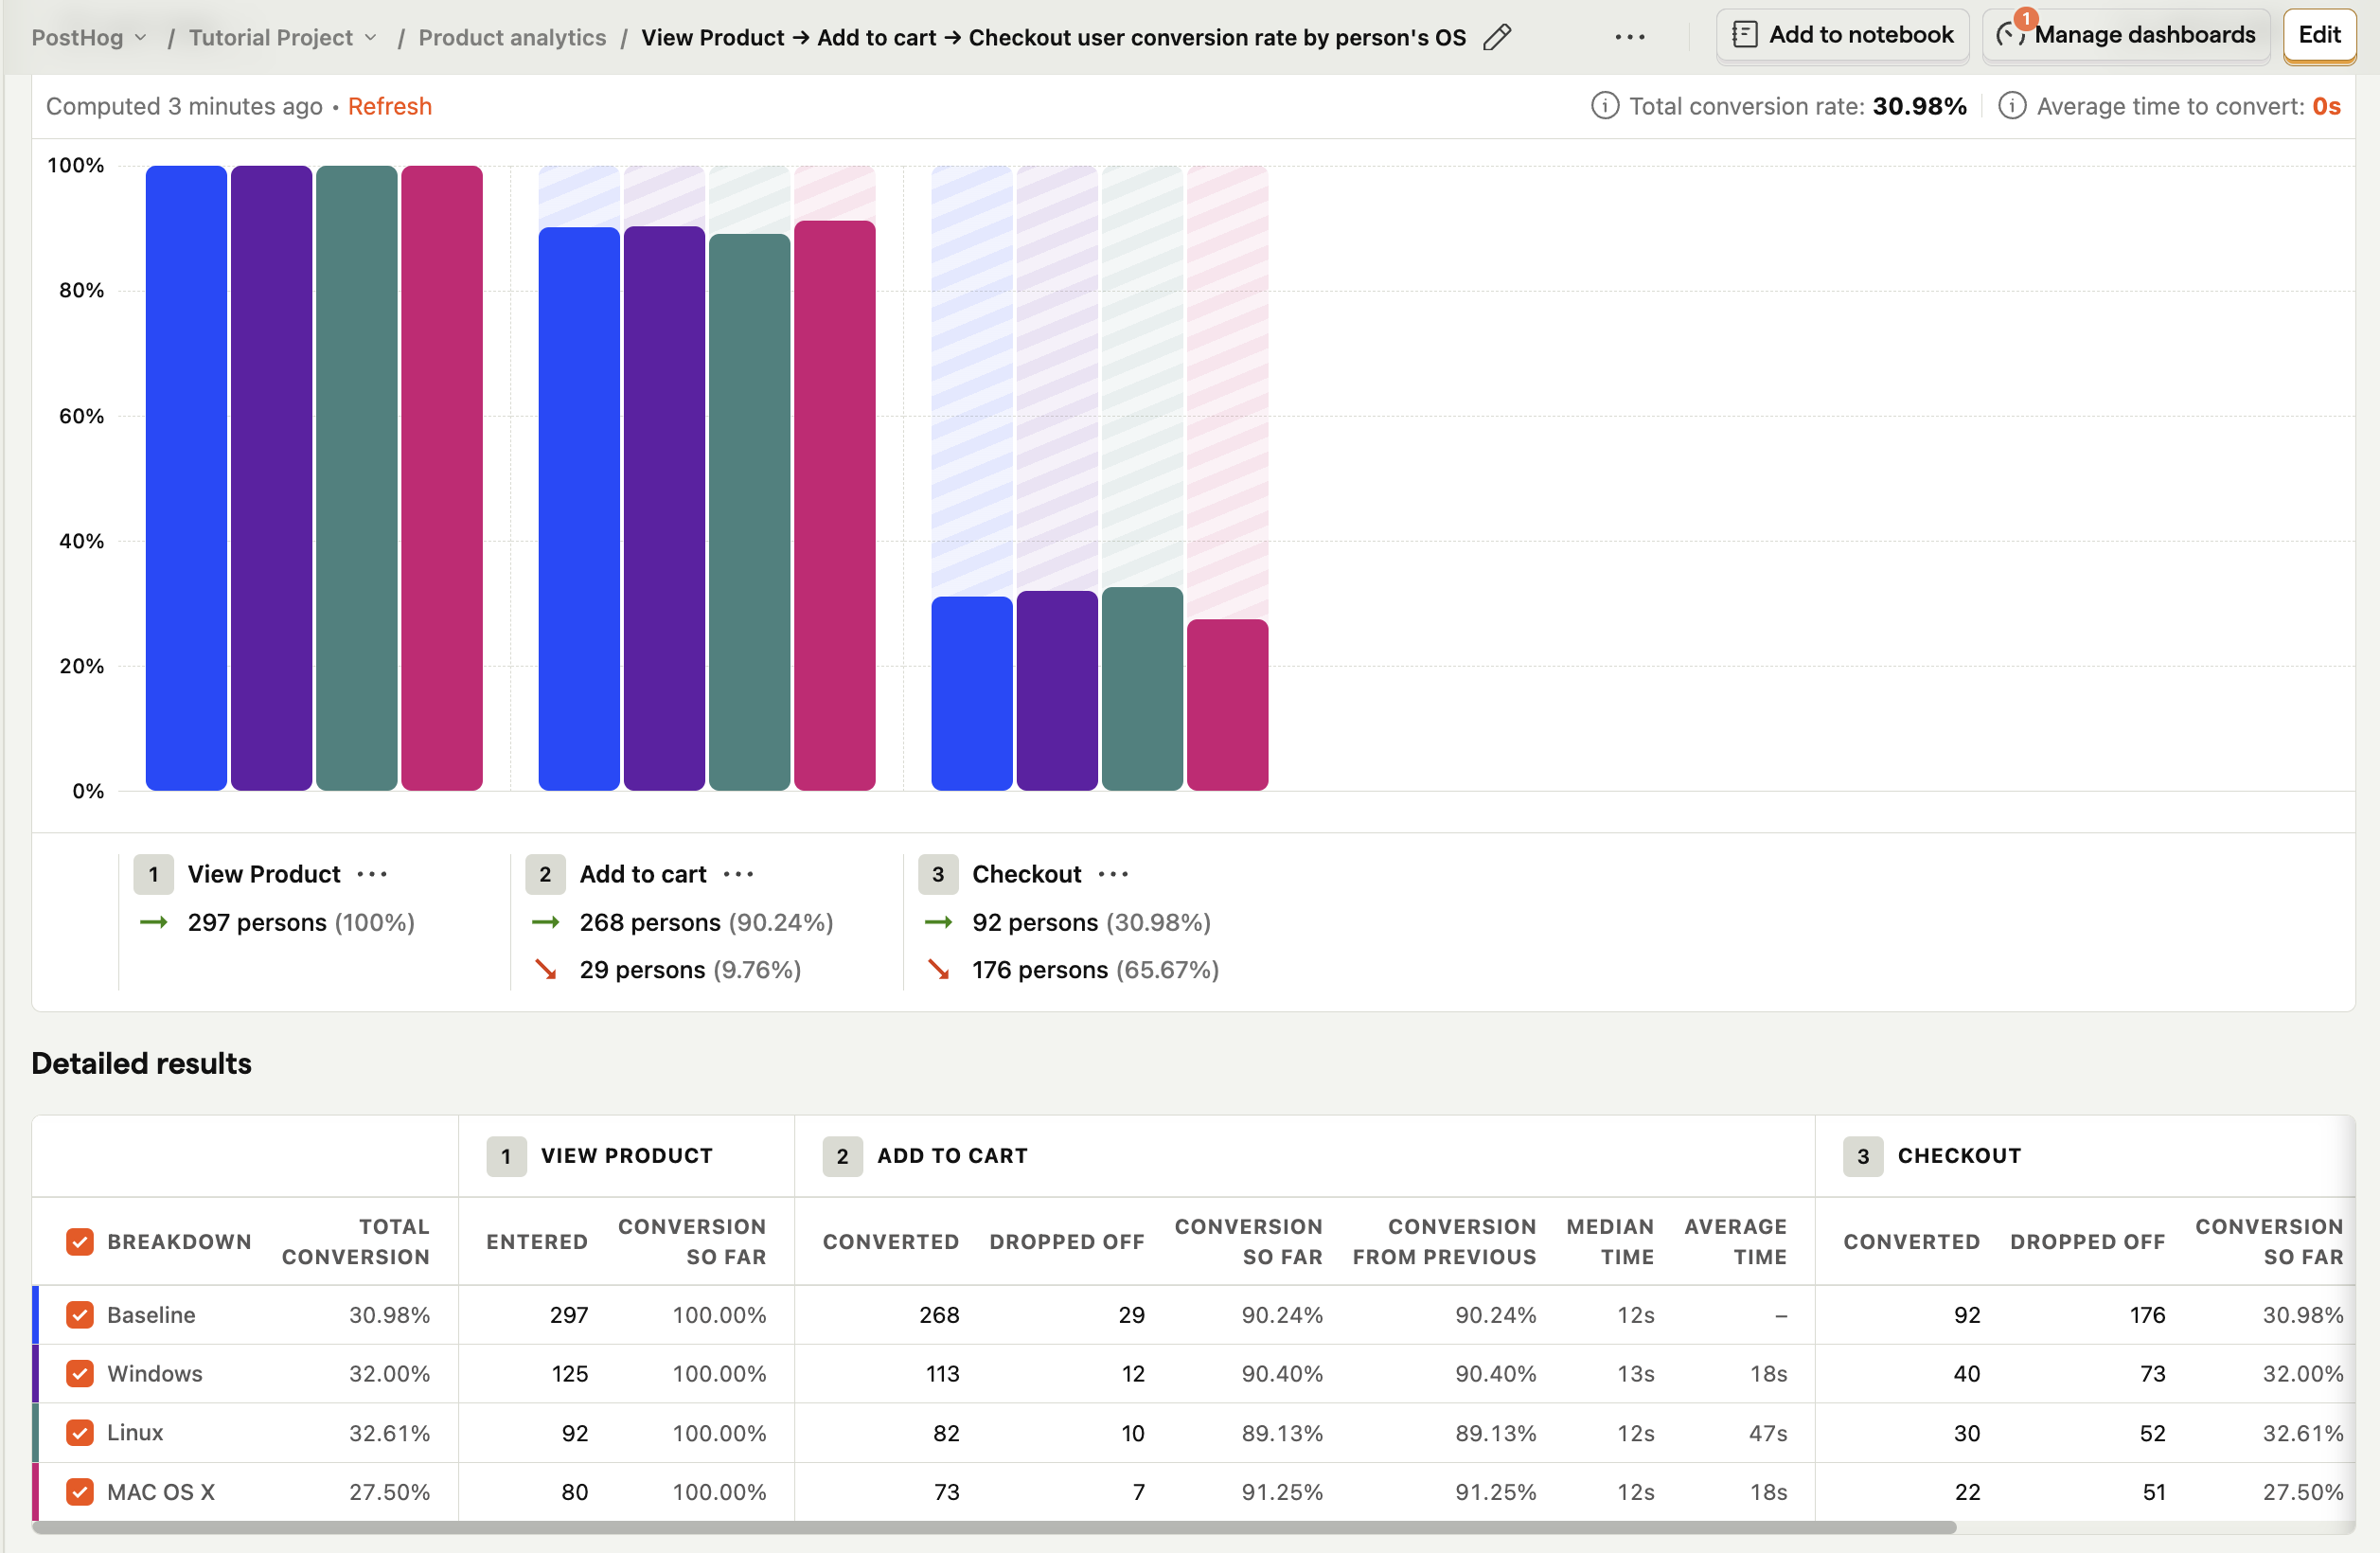
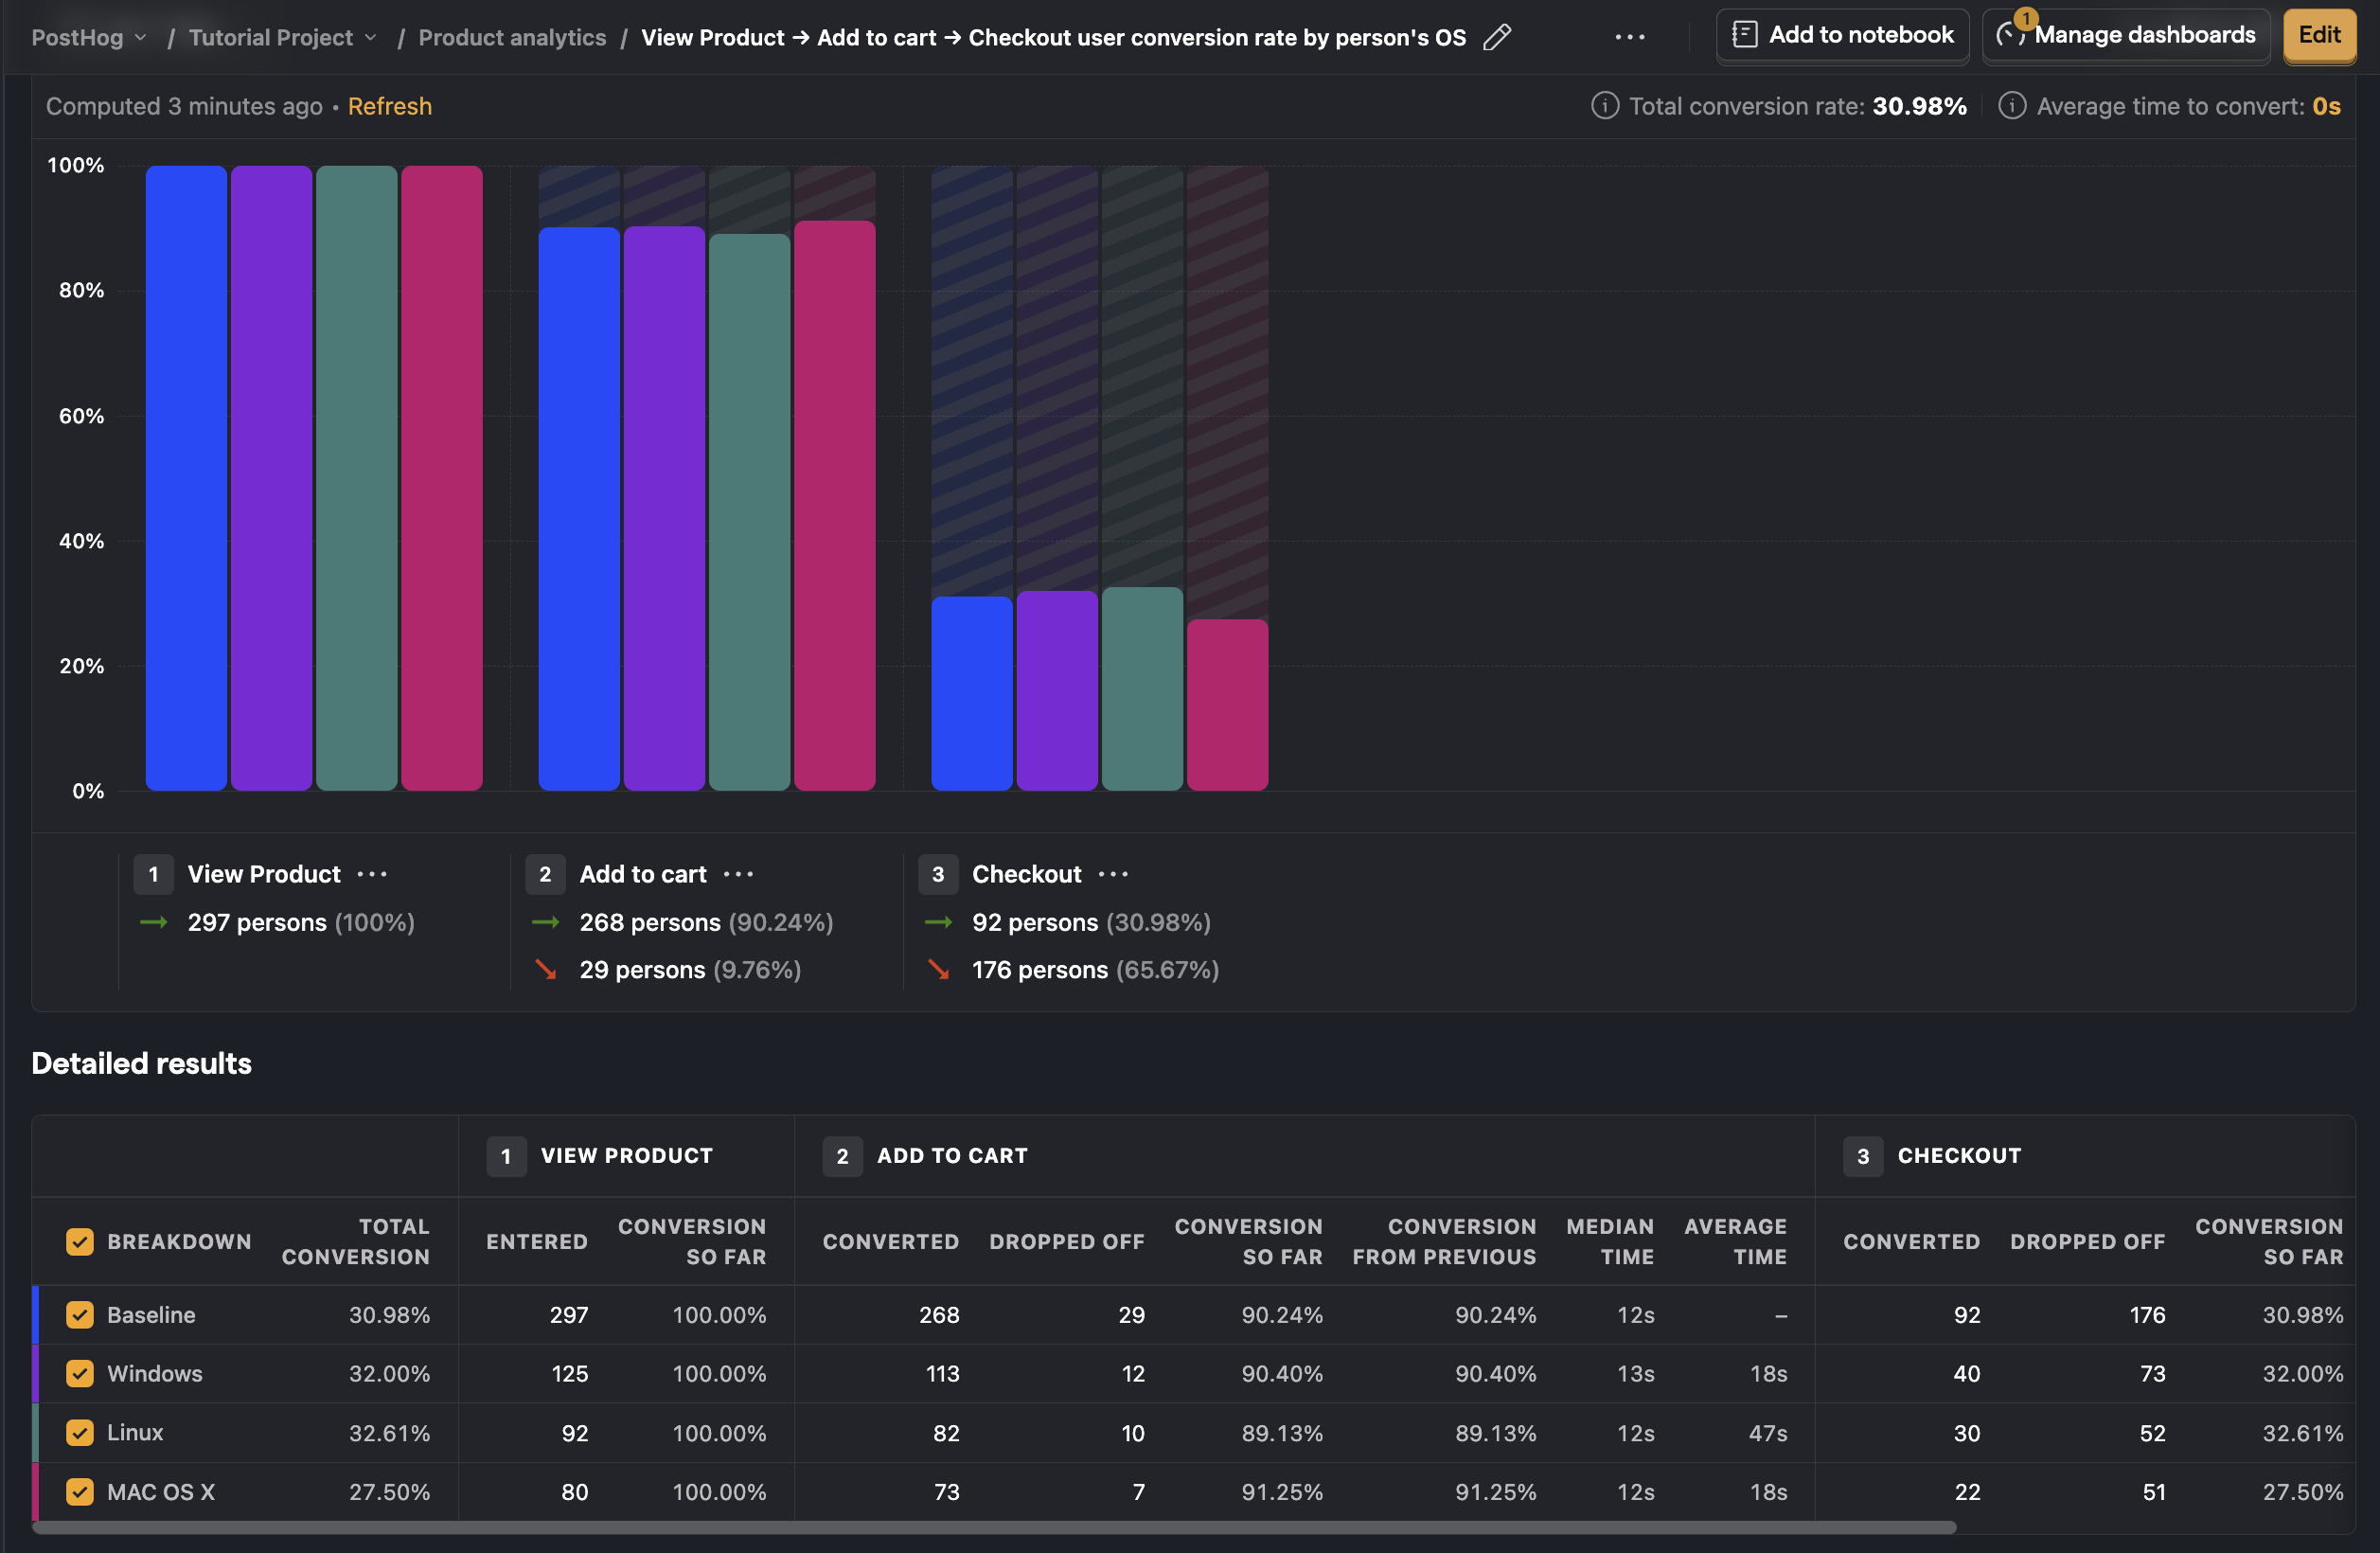
The example below shows a breakdown by operating system:
Attribution types
When breaking down funnels, it's possible that the same properties don't exist on every event. For example, if you want to break down by browser on a funnel that contains both of frontend and backend events.
In this case, you can choose from which step the properties should be selected from by modifying the attribution type. There are four modes to choose from:
1. First touchpoint
In this case, the first property value seen in any of the steps is chosen.
Consider this example sequence of events:
$pageviewwithbrowser = Chromeuser signed upwithbrowser = Firefox
The first touchpoint means that Chrome will be the breakdown value.
In the first touchpoint mode, one person will always only have one value.
2. Last touchpoint
In this case, the last property value seen from all steps is chosen.
Consider the same example as above:
$pageviewwithbrowser = Chromeuser signed upwithbrowser = Firefox
The last touchpoint means that Firefox will be the breakdown value.
In the last touchpoint mode, one person will always only have one value.
3. All steps
In this case, all events completed in your selected step order will be included in the funnel.
Consider the following entirely possible example of events from a single person:
$pageviewwithbrowser = Chrome$pageviewwithbrowser = Firefoxuser signed upwithbrowser = Chromeuser postedwithbrowser = Chromeuser postedwithbrowser = Firefox
With all steps mode, the person will be counted twice in the funnel, but in slightly different ways.
The person will be in the Chrome breakdown as having completed all three steps: $pageview, user signed up, and user posted. The person will also be in the Firefox breakdown, but only for the $pageview step because they didn't complete the user signed up step with Firefox.
4. Specific step
In this case, only the property value seen at the selected step is chosen. Importantly, this also means that the person won't be included in the funnel if they don't have a property value at the selected step.
Consider an example where we capture these two events for a person:
$pageviewwithbrowser = Chromeuser signed upwithbrowser = Firefox
When step two is chosen in this example, the value will be Firefox. Also, any people who only have a $pageview event will be excluded from the funnel.
With the specific step mode, one person can have more than one property value. For example, if the user captured the same event with different browsers:
$pageviewwithbrowser = Chrome$pageviewwithbrowser = Firefox
Then the person would have both Chrome and Firefox as their breakdown values.
Another common use for Specific step is to display only a single URL for pageview steps in the funnel columns. The default, First touchpoint uses the first property value seen from all steps, which will include the subdirectory URLs in the breakdown if they appeared in later steps.
For example, if you've
- set your first query step as
PageviewwhereCurrent URL= equalshttps://foo.com/bar, - and
/barhas subdirectories (e.g.https://foo.com/bar/foo1https://foo.com/bar/foo2etc.), - and
Breakdown byis set toCurrent URL
but you don't want pages under the subdirectories of https://foo.com/bar to appear in the funnel chart.
In this case, set the Attribution type to Specific step / Step 1 to see only https://foo.com/bar in the pageview column of the chart.
For an unordered funnel, the specific step is meaningless, as the first step can be the last step, and vice versa. So, it's referred to as "any step" in the UI. It has the same semantics as a specific step in an ordered funnel, but it looks at property values from all steps.
Filtering for first occurrence
When analyzing funnels, you can specify which event to count if a user performs it multiple times. This is configured in the dropdown for each step of the funnel.
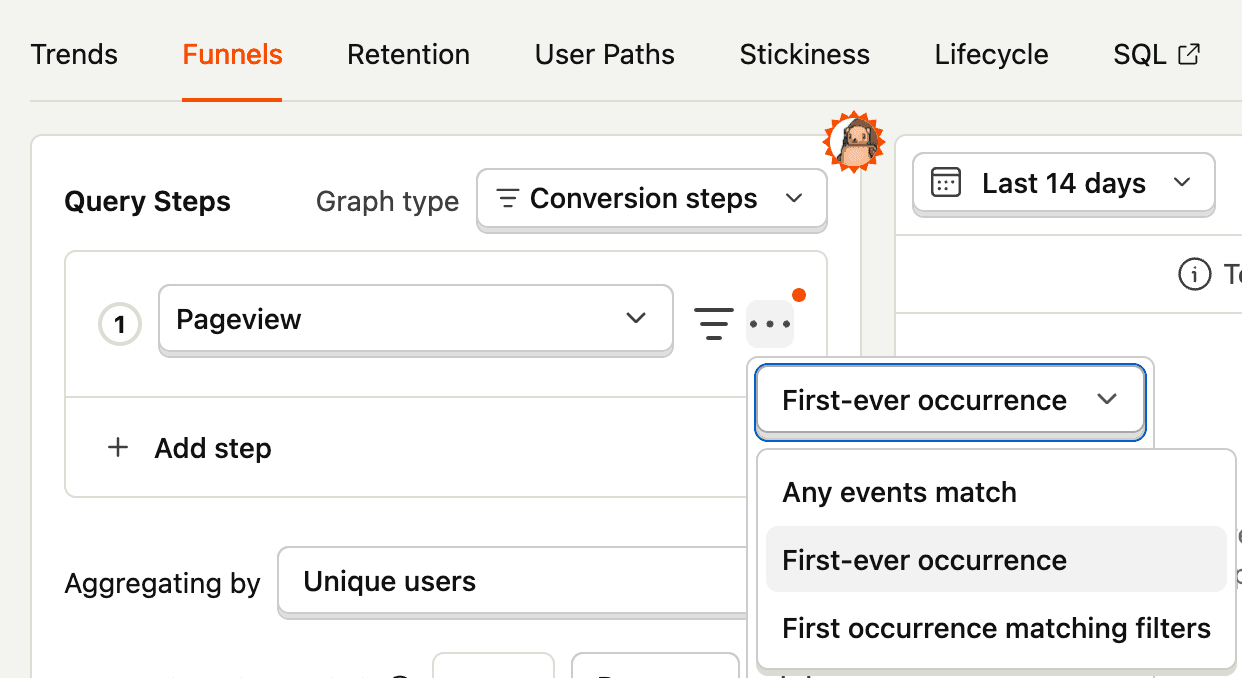
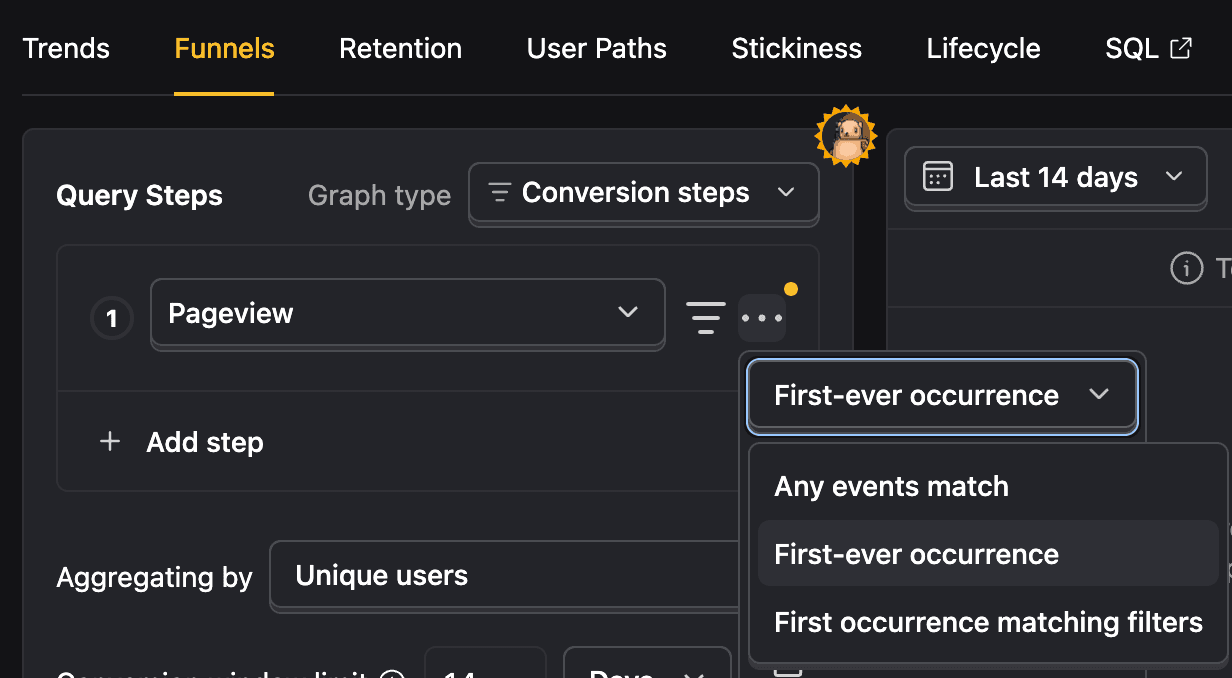
There are two options for this:
1. First-ever occurrence
First-ever occurrence matches only the first time a user performs a specific event type. If this first event doesn't match the filters for that funnel step, or is outside the funnel's date range, the user is excluded from the funnel entirely. This is true even if they perform the event again later with matching filters.
Example: You have a funnel step looking for page views to /about and the user's first-ever page view is to /pricing. PostHog will only consider the first $pageview event, which is on the /pricing page. Since the first page view doesn't match the /about filter, the user will be dropped from the funnel, even if they visit /about later.
2. First occurrence matching filters
First occurrence matching filters matches the first time a user performs an event that also matches the filters for that funnel step. Any previous events of the same type that don't match the filters are ignored.
Example: You have a funnel step looking for pageviews to /about. A user first visits /pricing and then later visits /about. PostHog ignores the /pricing view and matches the /about view, as it's the first one that fits the step's criteria.
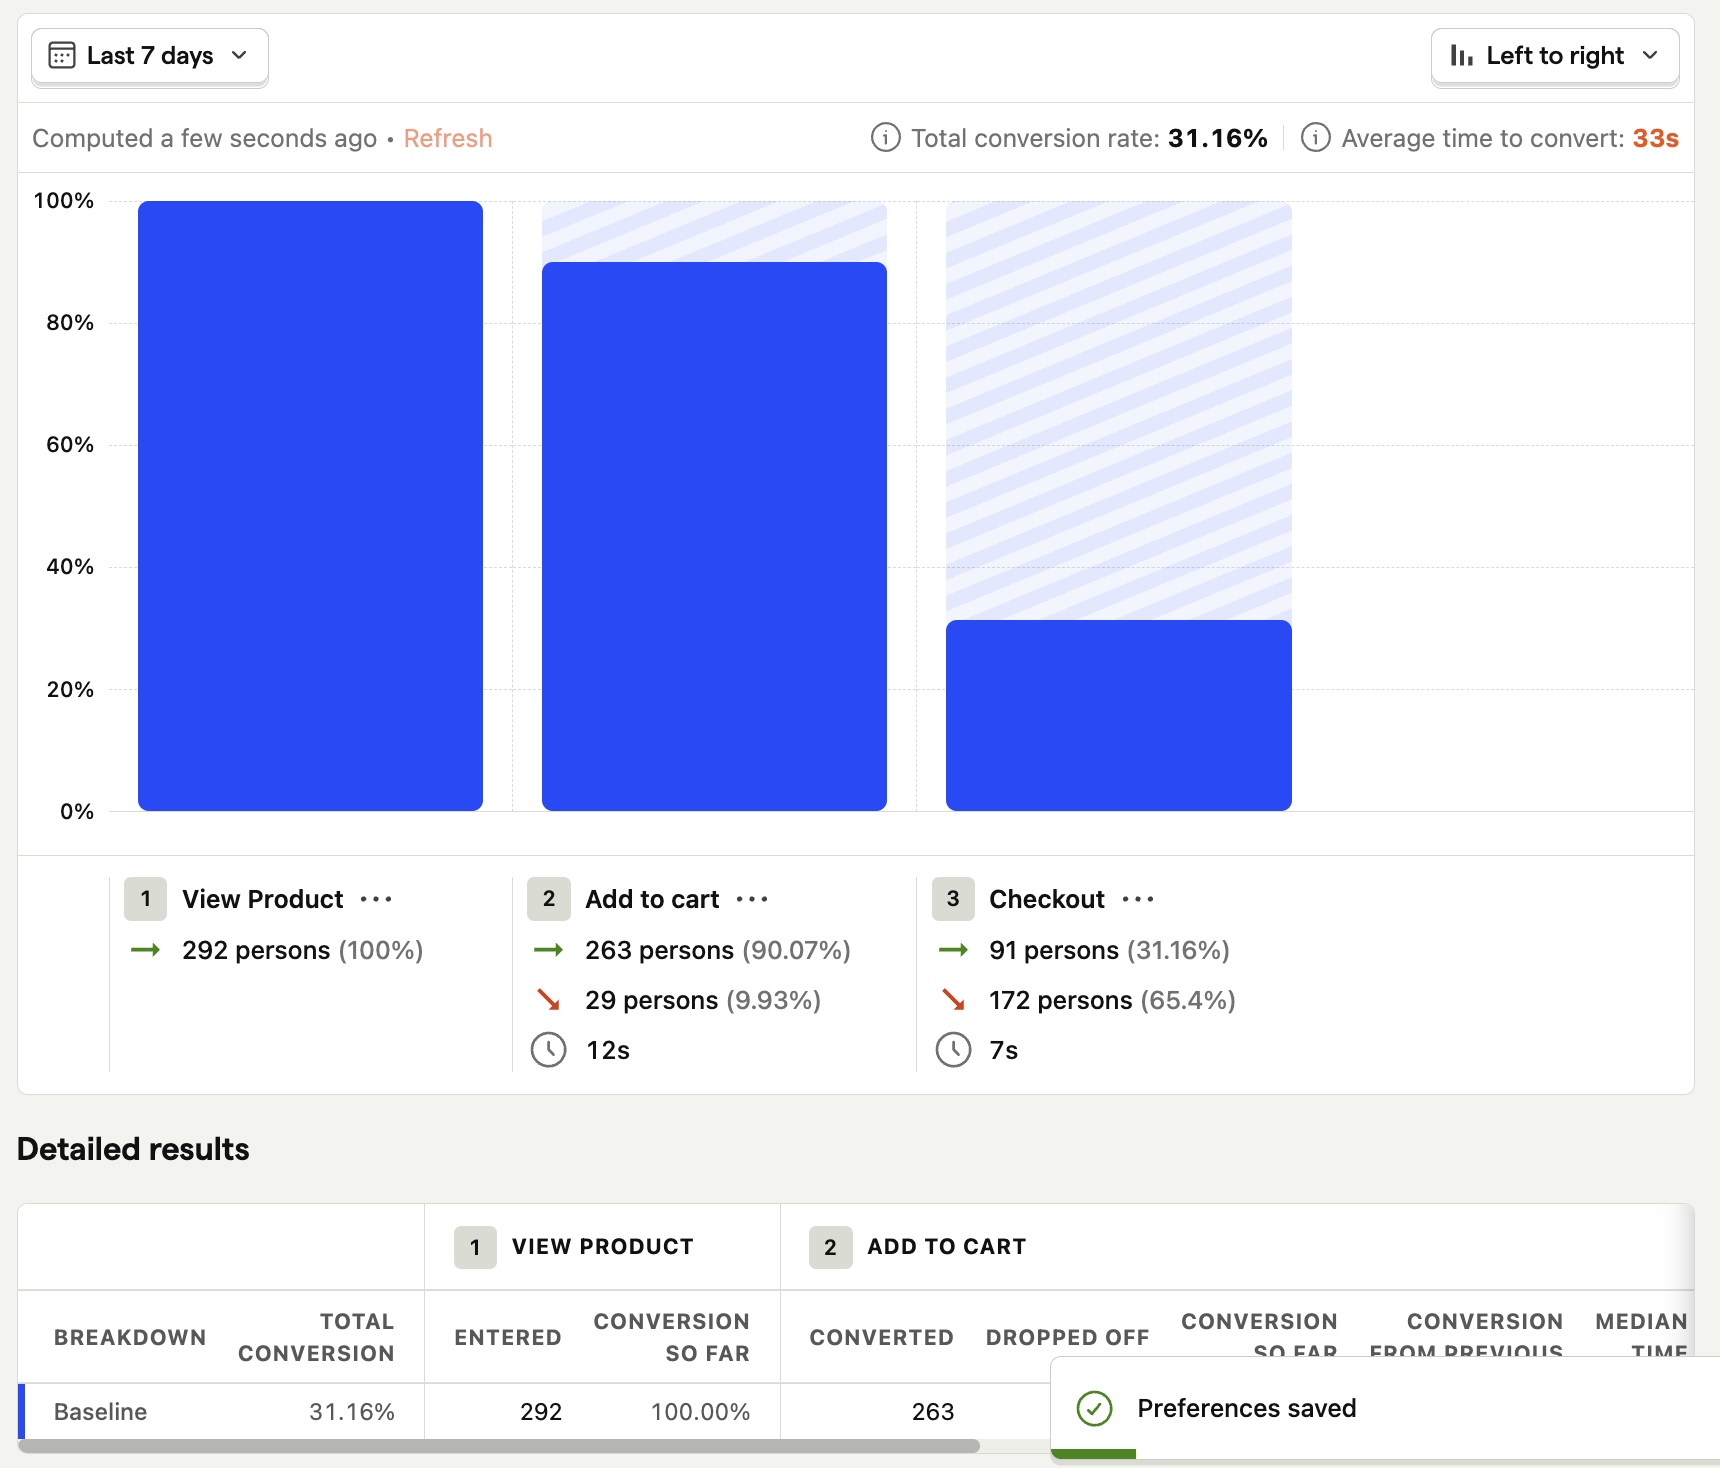
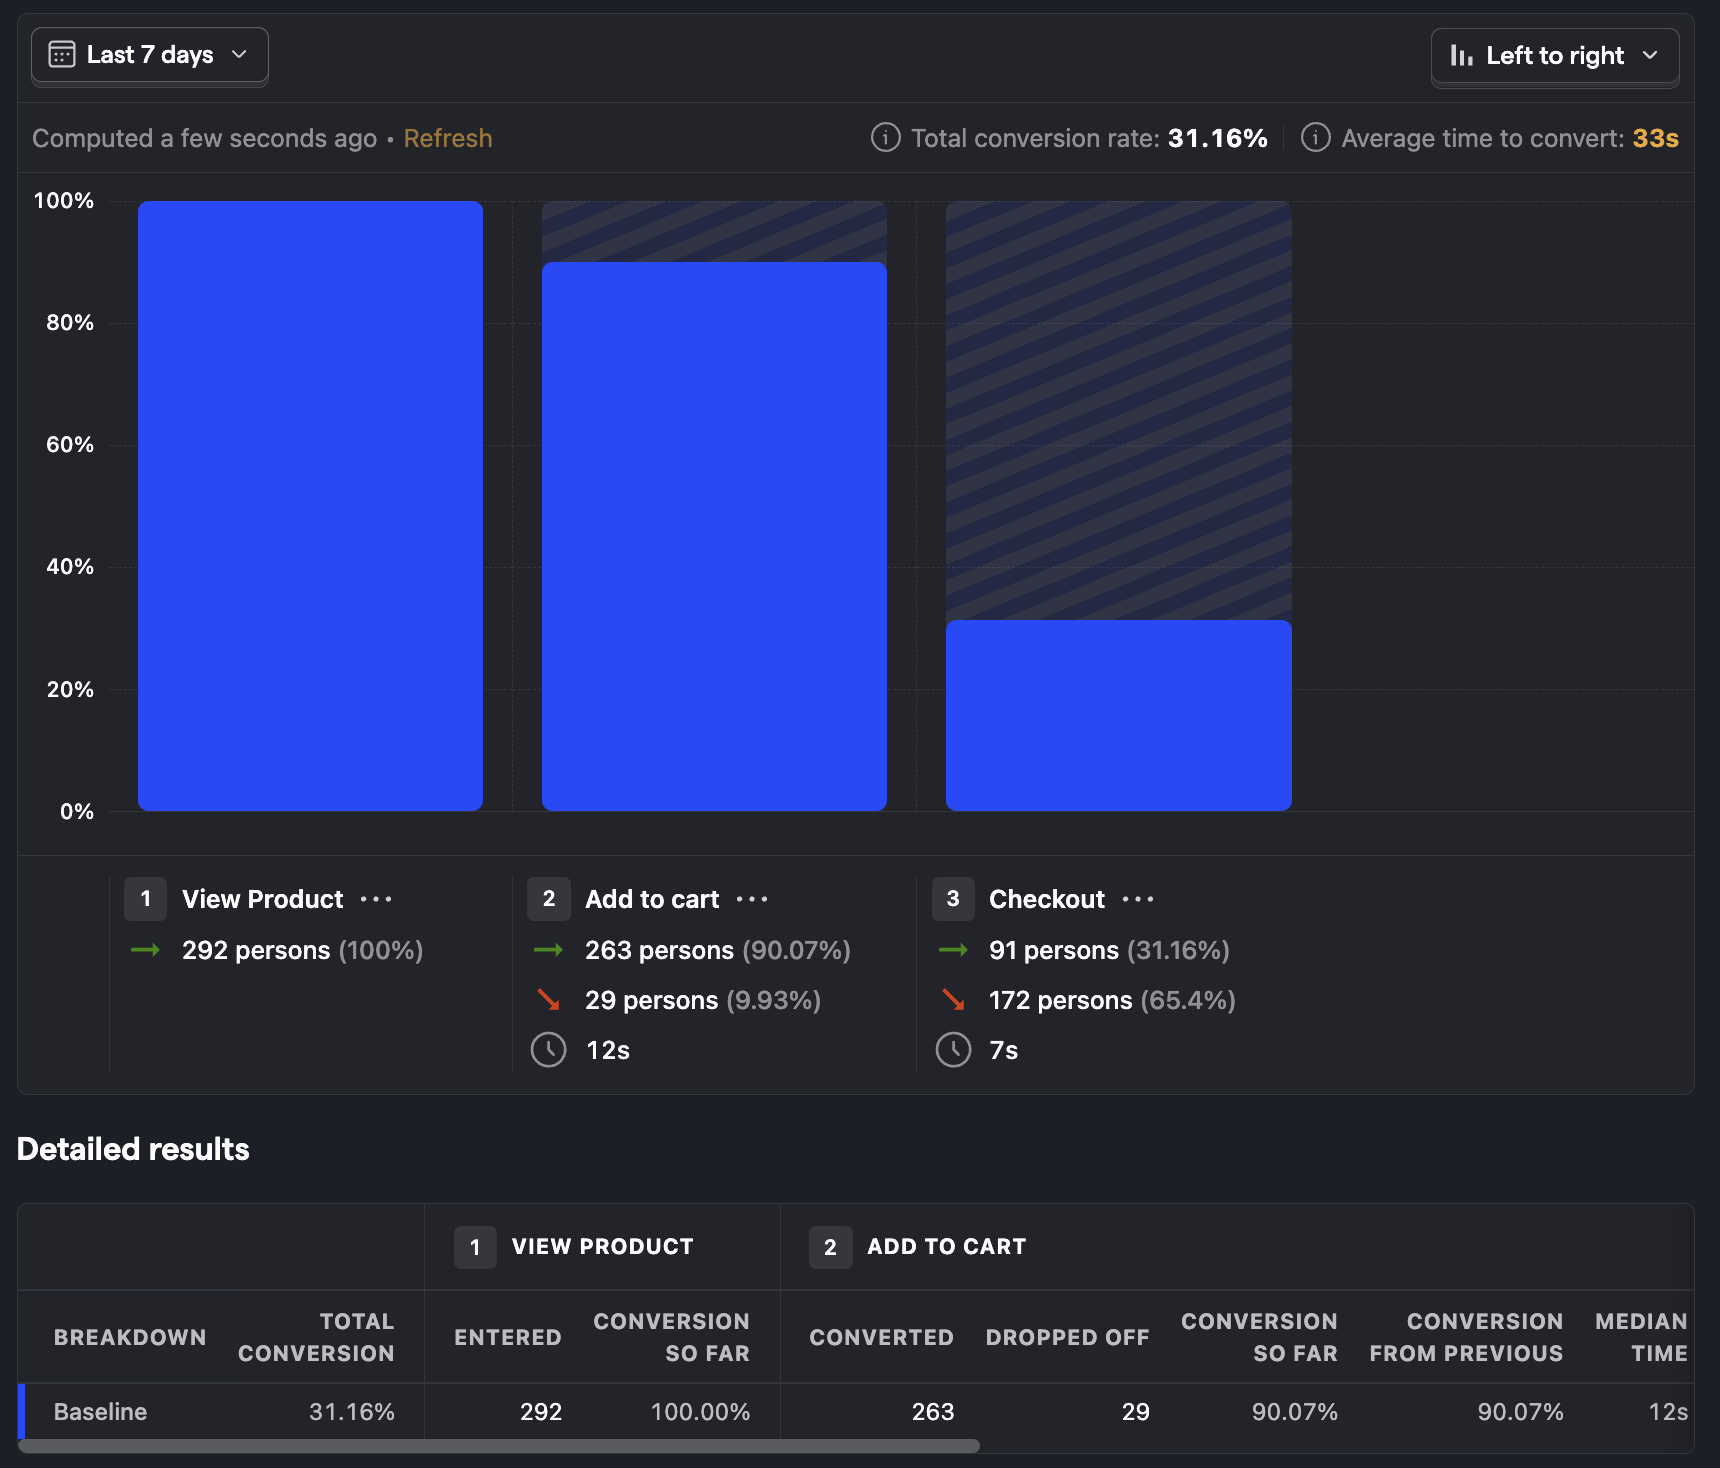
Graph type
The graph type dropdown let's you choose between conversion steps, time to convert, and historical trends.
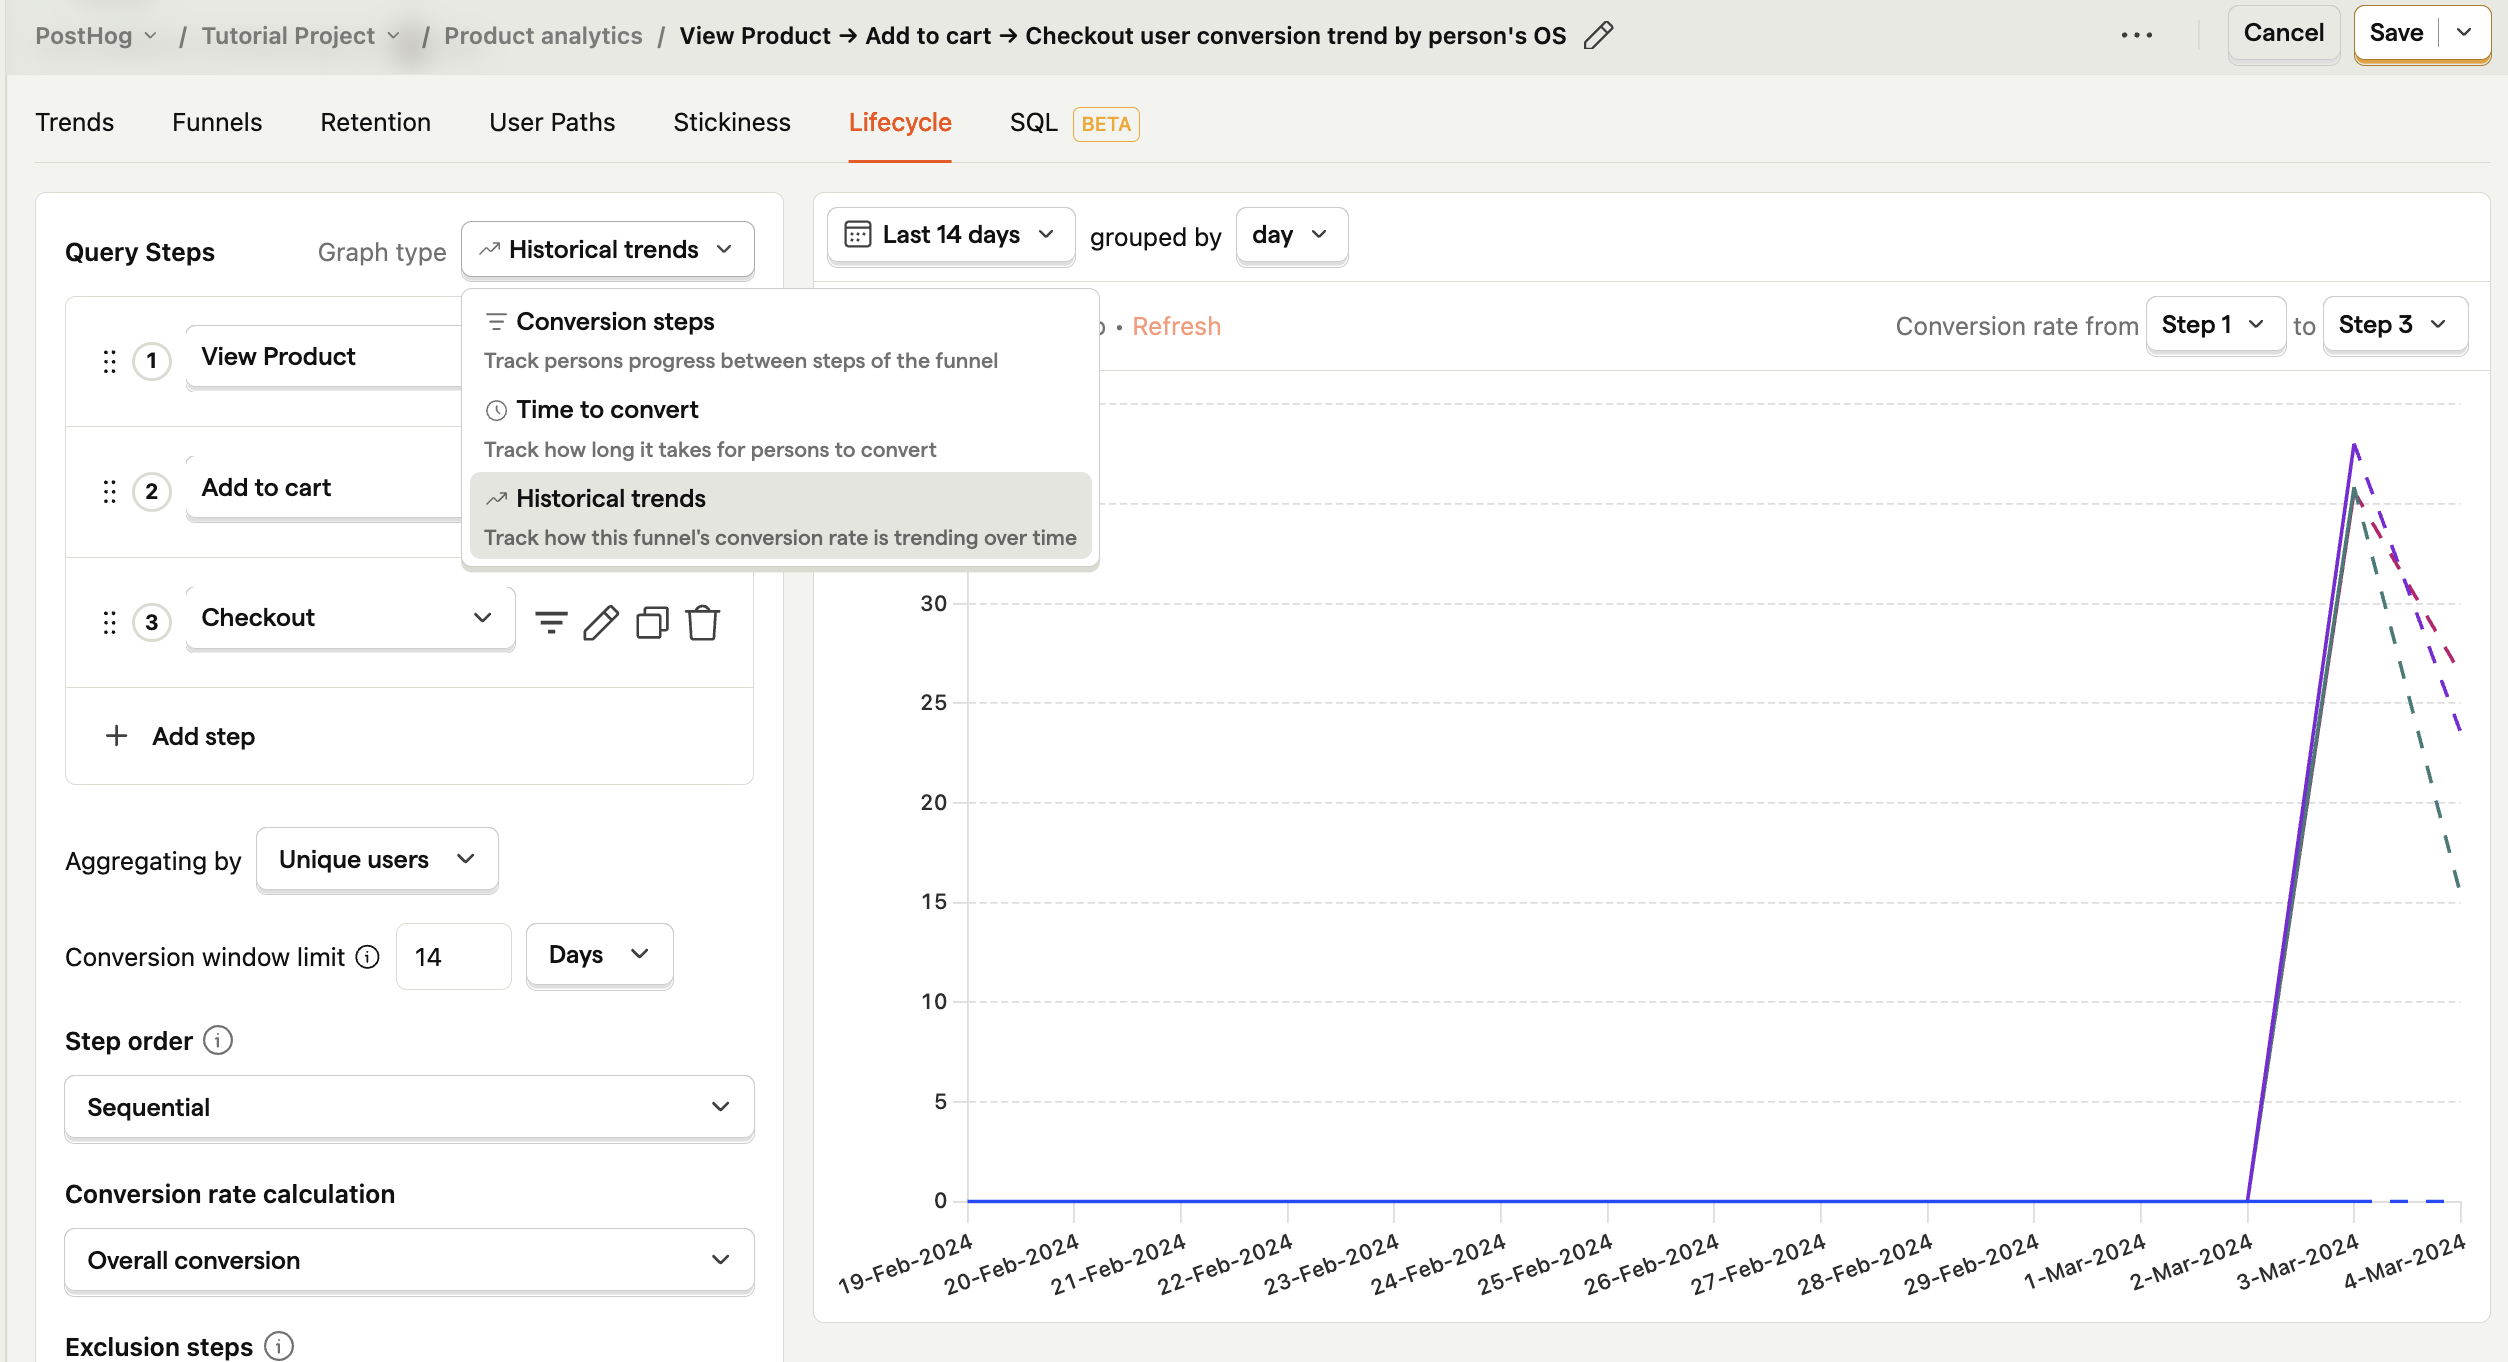
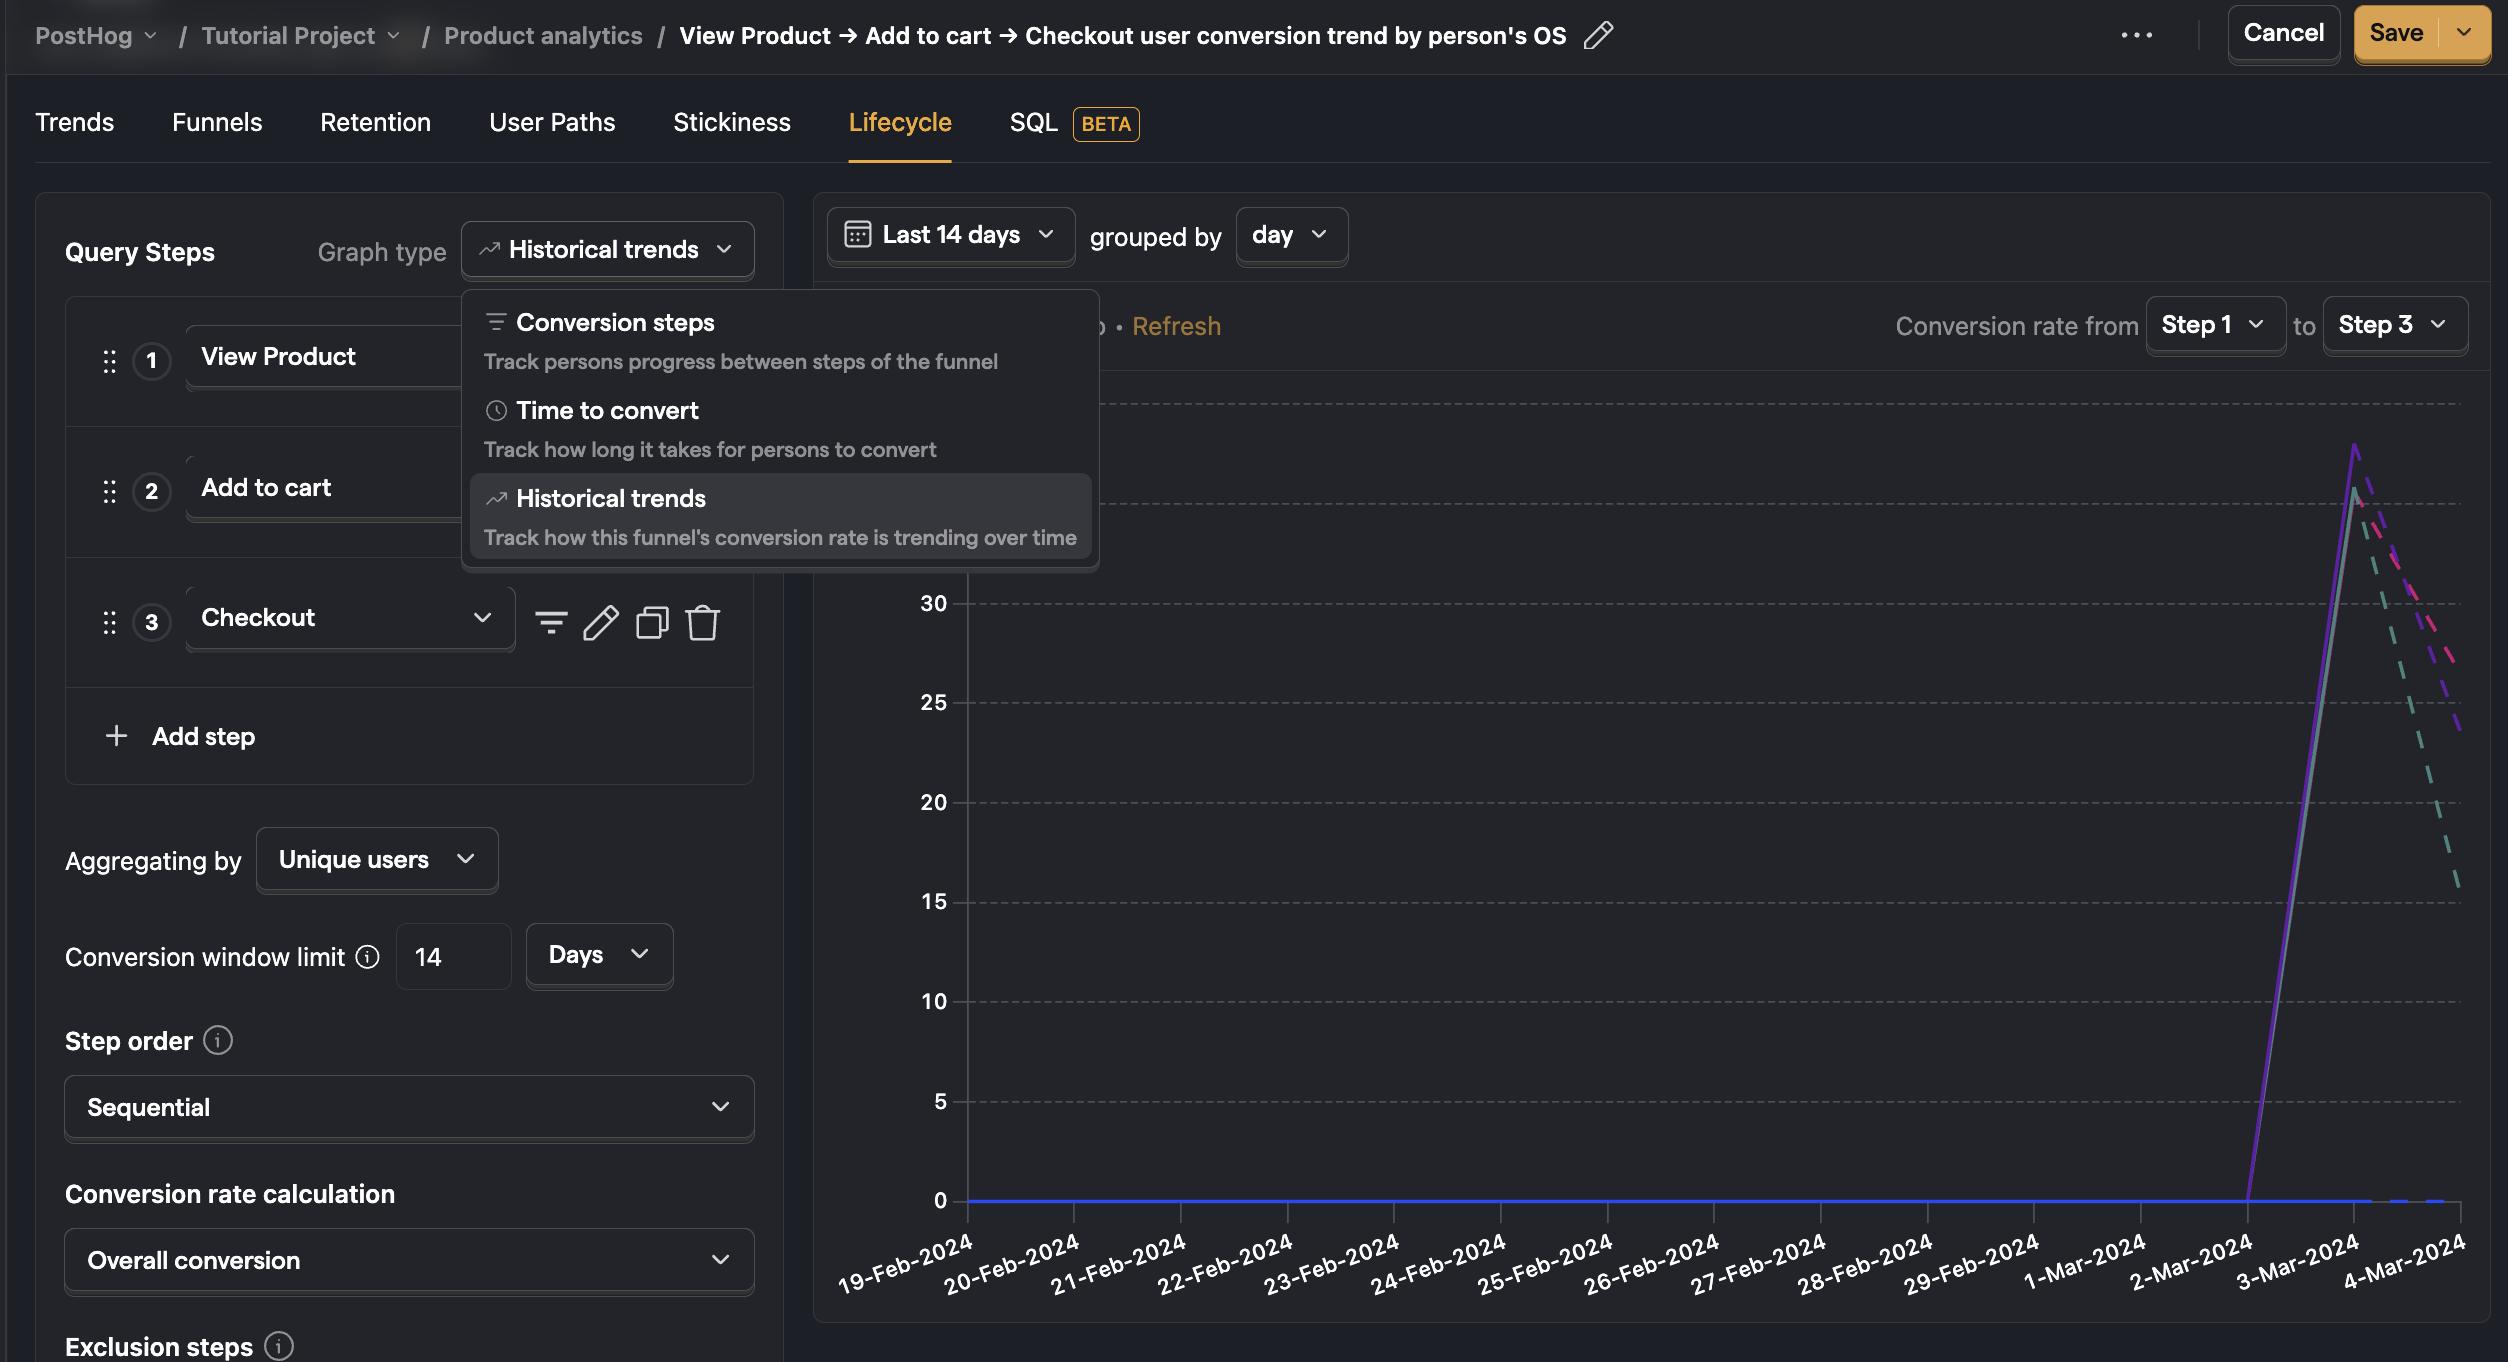
Each type serves a unique purpose:
Conversion steps – shows you where users are dropping off in your funnel and number of people converting between steps.
Time to convert – shows you steps with the highest friction. Steps with a long time to convert are likely much harder than steps with a short time.
Historical trends – shows you how your conversion rate has changed over time for users who entered the funnel on a given date. Useful for understanding how changes, fixes, and new features have affected your funnel success rate. You can enable trend lines from the Options menu to help identify patterns in noisy data. You can also enable Hide incomplete periods to exclude recent time periods where the full conversion window hasn't elapsed yet, preventing the trend from being dragged down by users who still have time to convert.
Tips for analyzing funnels
Understand where people are getting stuck during your flow
The most common use case for funnels is understanding where people are getting stuck or dropping off in your flow.
There a few ways to identify problem steps:
- Absolute numbers show you where you're losing the most people.
- Relative conversion rate show you which steps have the greatest impact on your overall conversion rate.
Usually the steps with the lowest relative conversion rate are where the largest opportunities are.
Identify unsuccessful users
Once you have a funnel drop-off you'd like to explore further, the first step is to find out why users are struggling. There are many ways to get this information, from talking to users directly to replaying their sessions.
Click on the chart or the linked column values below the funnel to view the individual people who COMPLETED or DROPPED that step of your funnel.
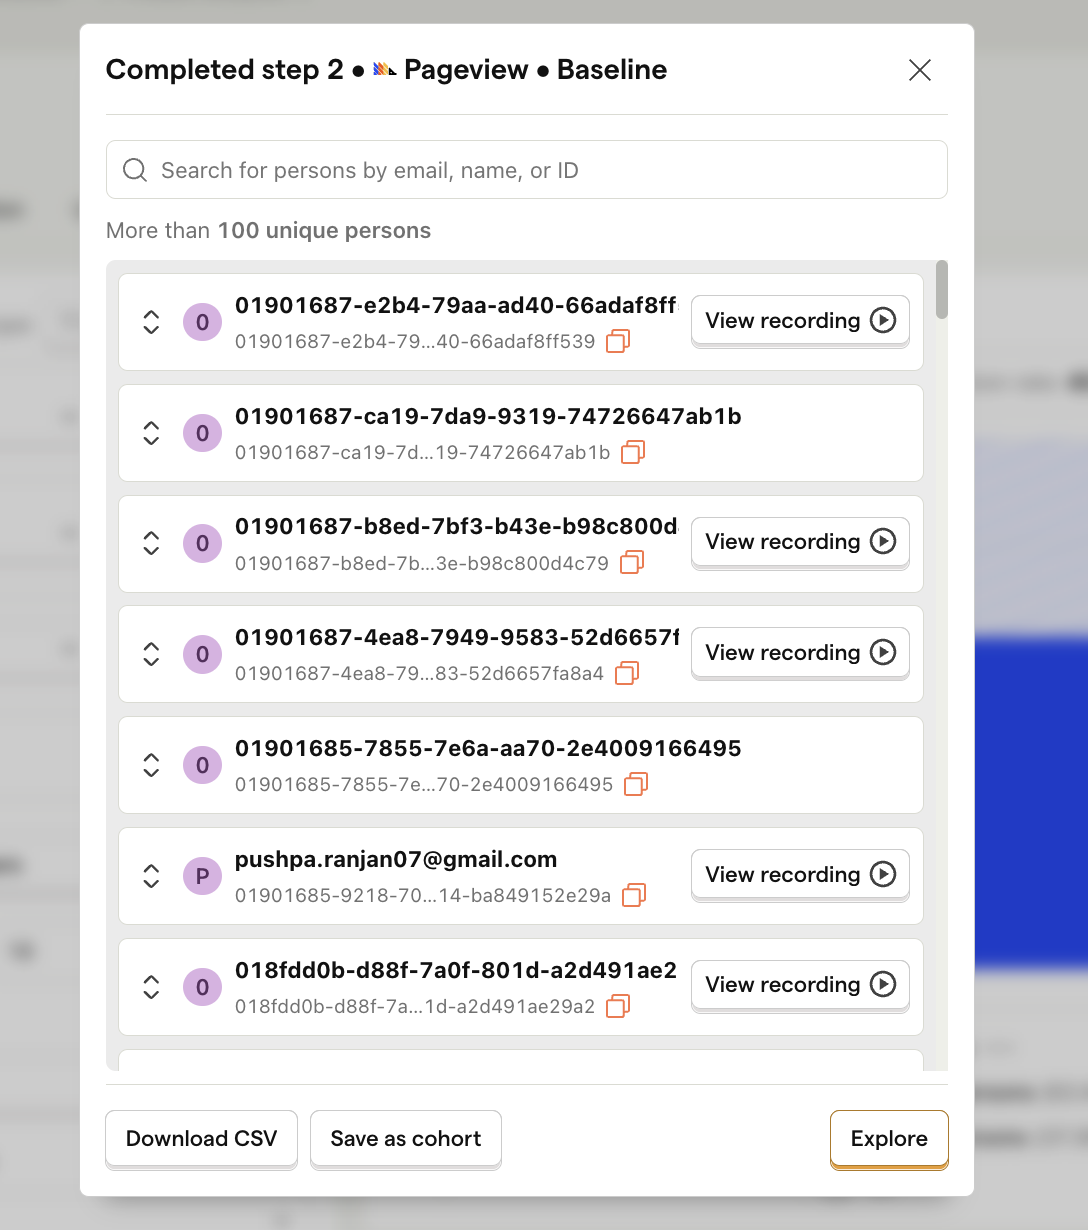
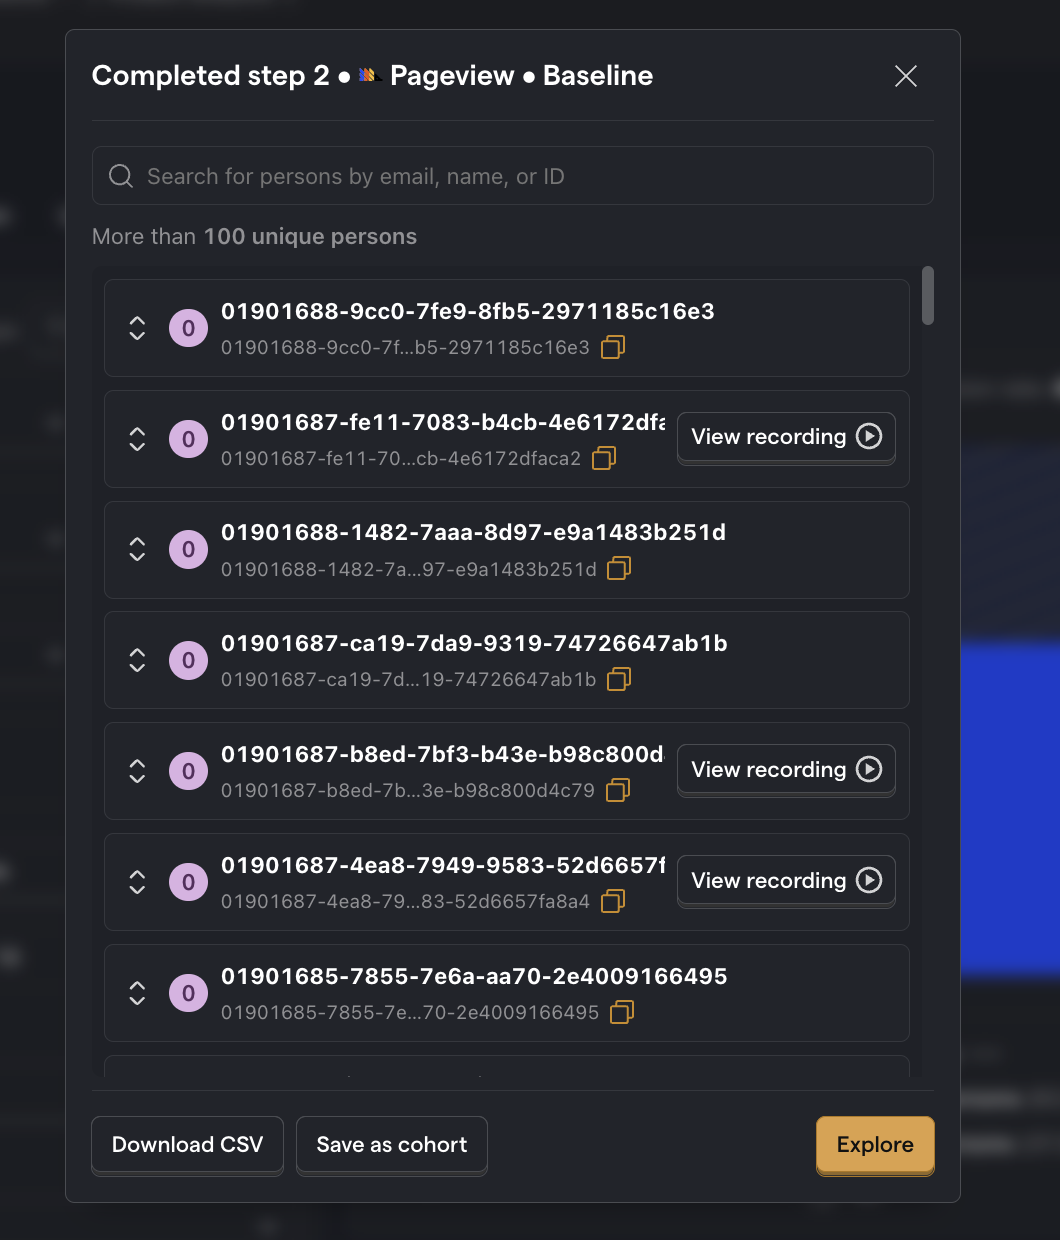
You can also save this list of users as a cohort for further analysis.
Explore user paths
It can be useful to explore the paths people take between steps in your funnel.
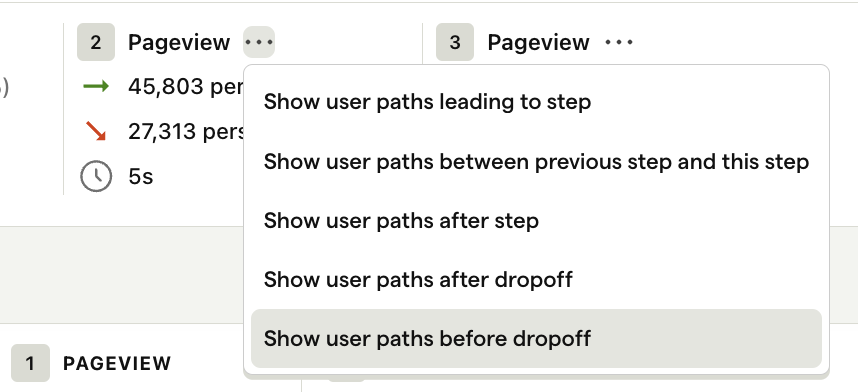
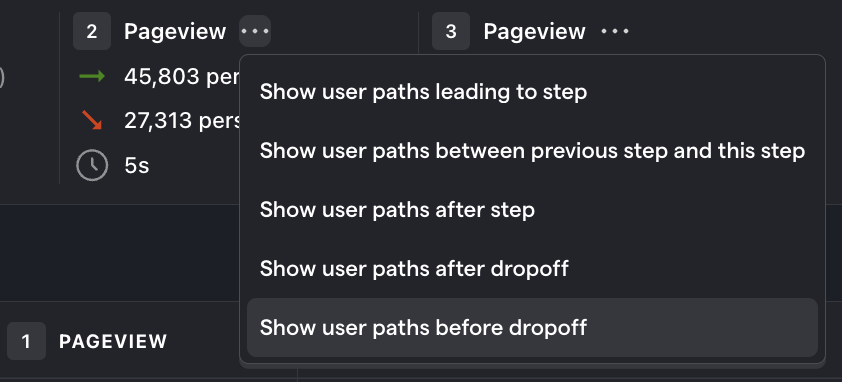
Click on the '...' next to any step in your funnel and, depending on which step you're selecting, you'll be presented with options to "show user paths":
- leading to step
- between previous step and this step
- after step
- after drop off
- before drop off
Selecting any option creates a new insight showing the paths users took. This is useful for getting a complete picture of the real funnel created by user interactions, rather than the imagined perfect funnel engineers and designers have in their head. Spoiler: the real funnel and the perfect funnel are rarely the same!
Understand seasonality in your conversion rates
It's unlikely that your conversion rate will remain stable every day or every week. This is normal, but it's important to understand the external factors that can cause these fluctuations so you don't jump to conclusions too quickly when analyzing a big change or drop-off.
To look at the seasonality of your conversion rates, set the graph type to historical trends and set the time period to when you may expect seasonal variations.
A common seasonality to watch out for is weekends, particularly if your product is B2B. Another one is a yearly sale such as "Black Friday", which increases the number of people visiting your site and increases the expectation of discounts, making it difficult to compare against the rest of the year.
In this view, you can adjust the date ranges to observe key seasonal trends. You can then look at your funnel to determine if it's just a seasonal trend or whether something else has affected the experiece of your product (like a product change).
Correlation analysis
Where is this feature available?
Free / Open-source
Paid
Enterprise


Correlation Analysis automatically highlights significant factors that affect the conversion rate of users within the funnel.
Correlation analysis works well when you don't already have a hypothesis for what is affecting conversion through a funnel. This report will automatically highlighting significant events or properties that either negatively or positively impact conversion rate.
Further reading
Want to know more about what's possible with Funnels in PostHog? Try these tutorials:
- Getting started with AARRR
- Building an AARRR 'Pirate' Funnel
- Building and measuring a sign up funnel with Next.js, Supabase and PostHog
Want more? Check our full list of PostHog tutorials.