

Web analytics dashboard
Contents
The web analytics dashboard provides an overview of your website's traffic.
For the selected time range, it starts with the number of visitors, views, sessions, along with trends for each, as well as average session duration and bounce rate. Each of these is compared with the previous time range, showing how much they increased or decreased.
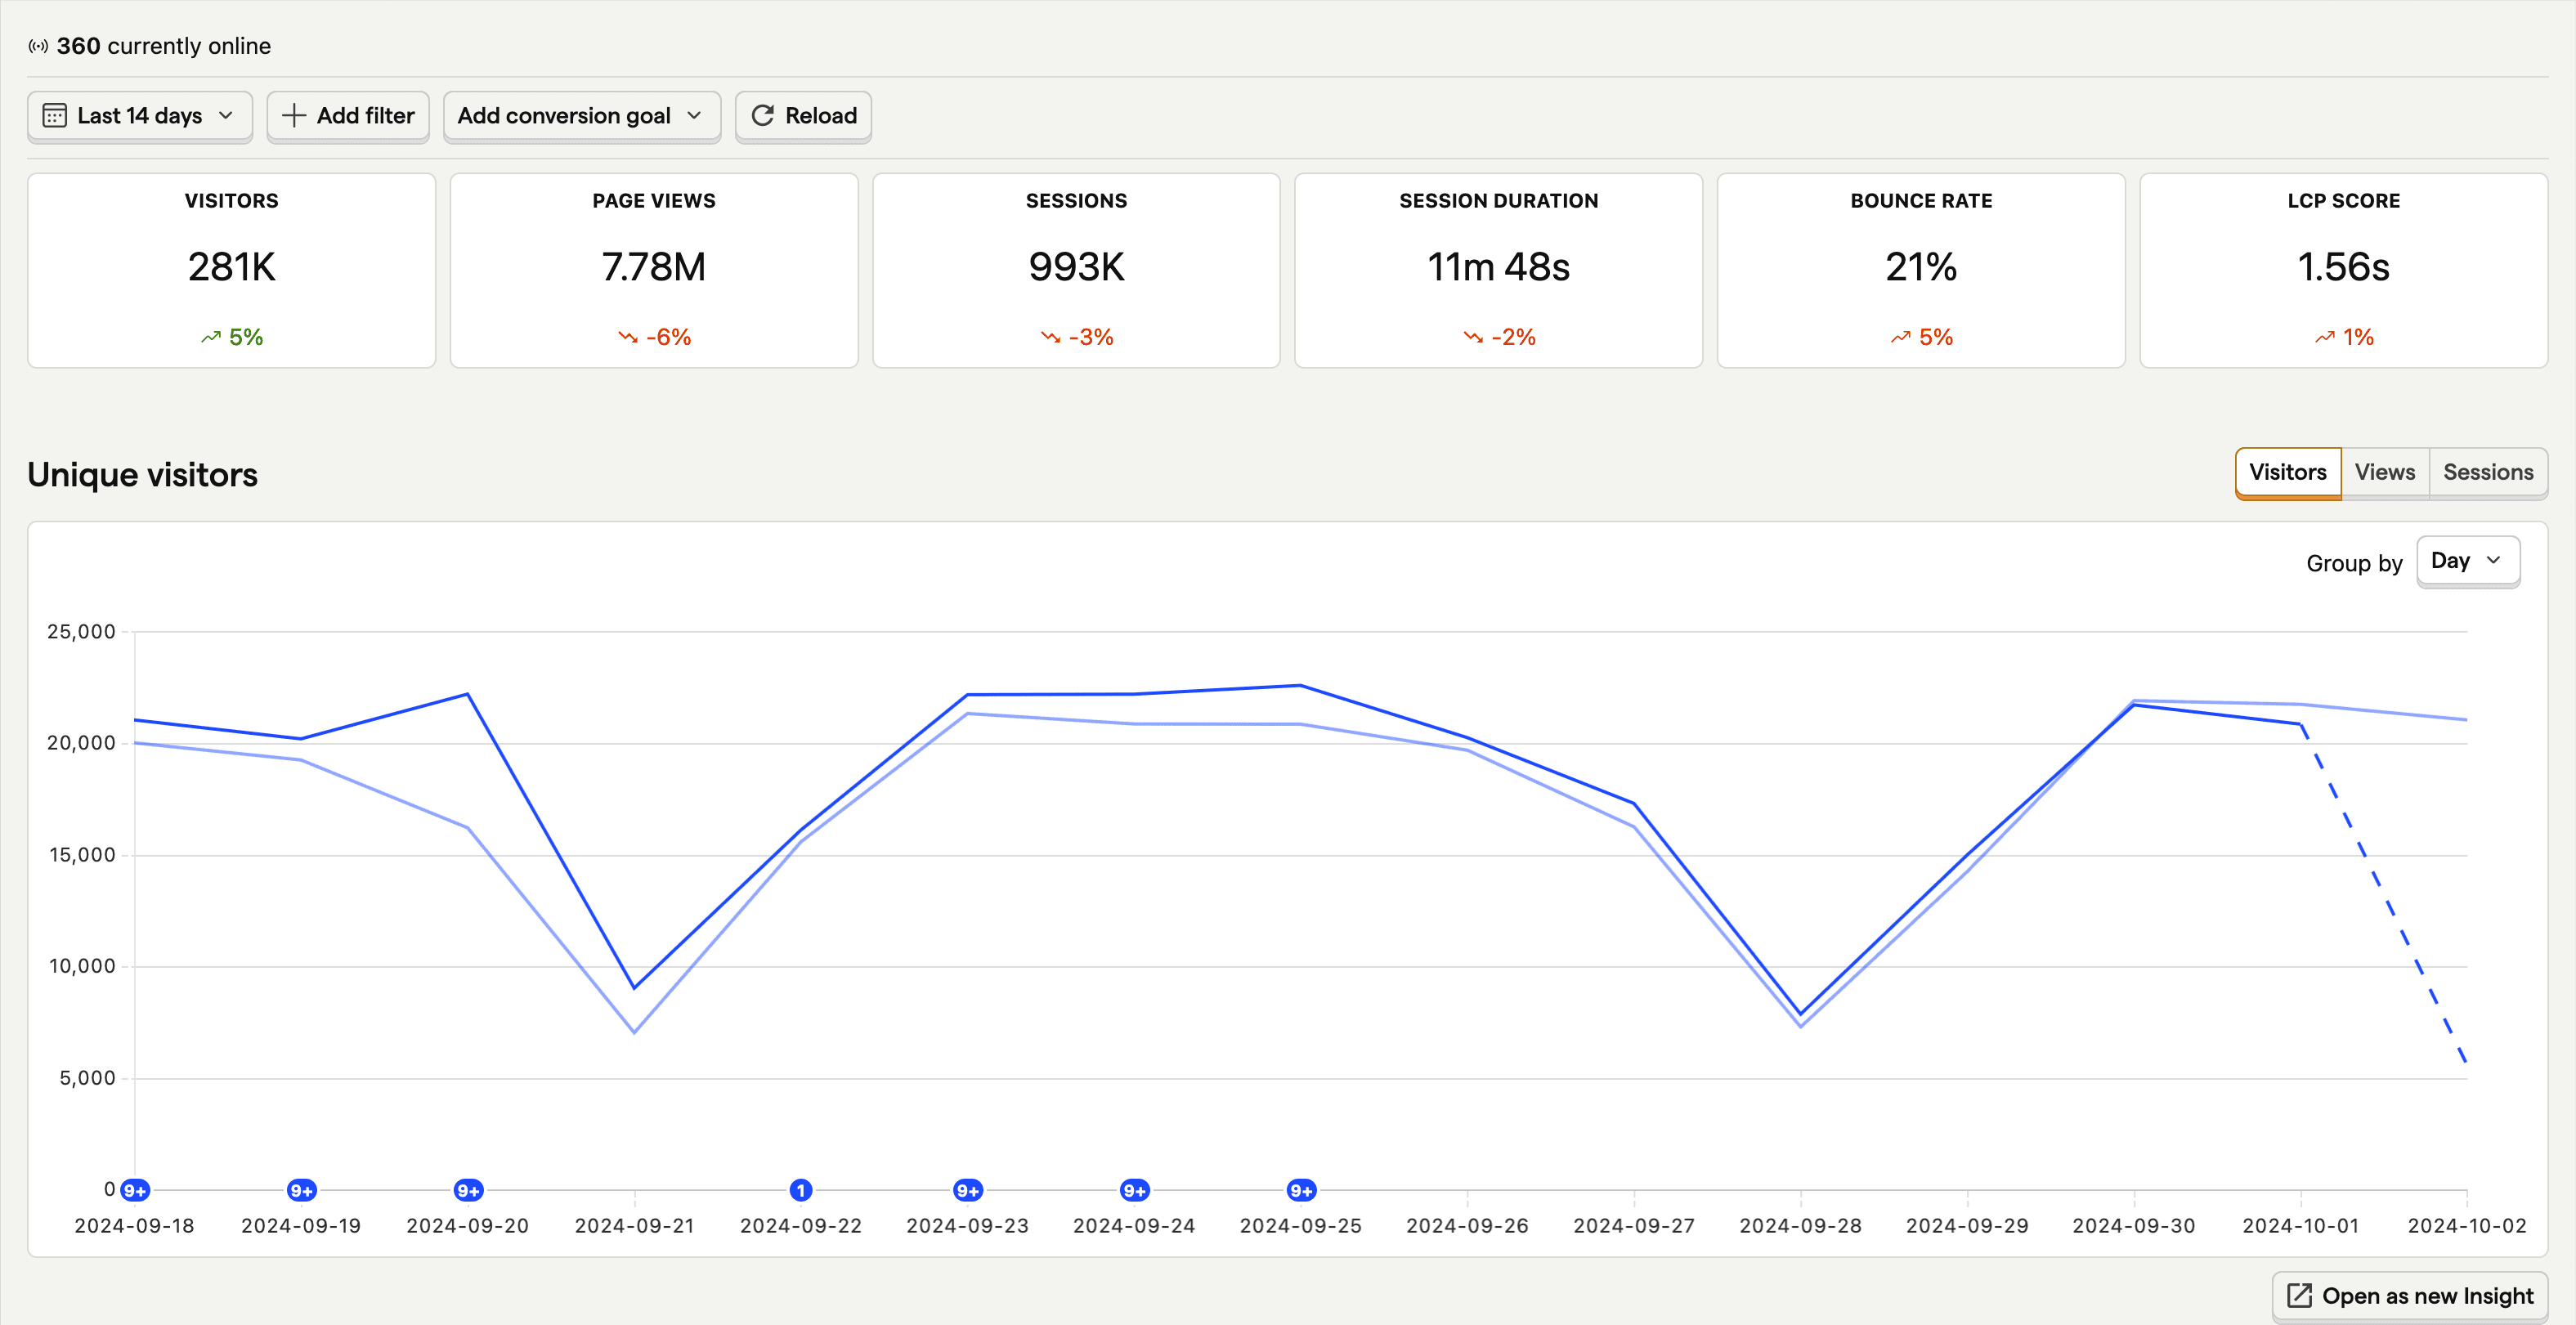
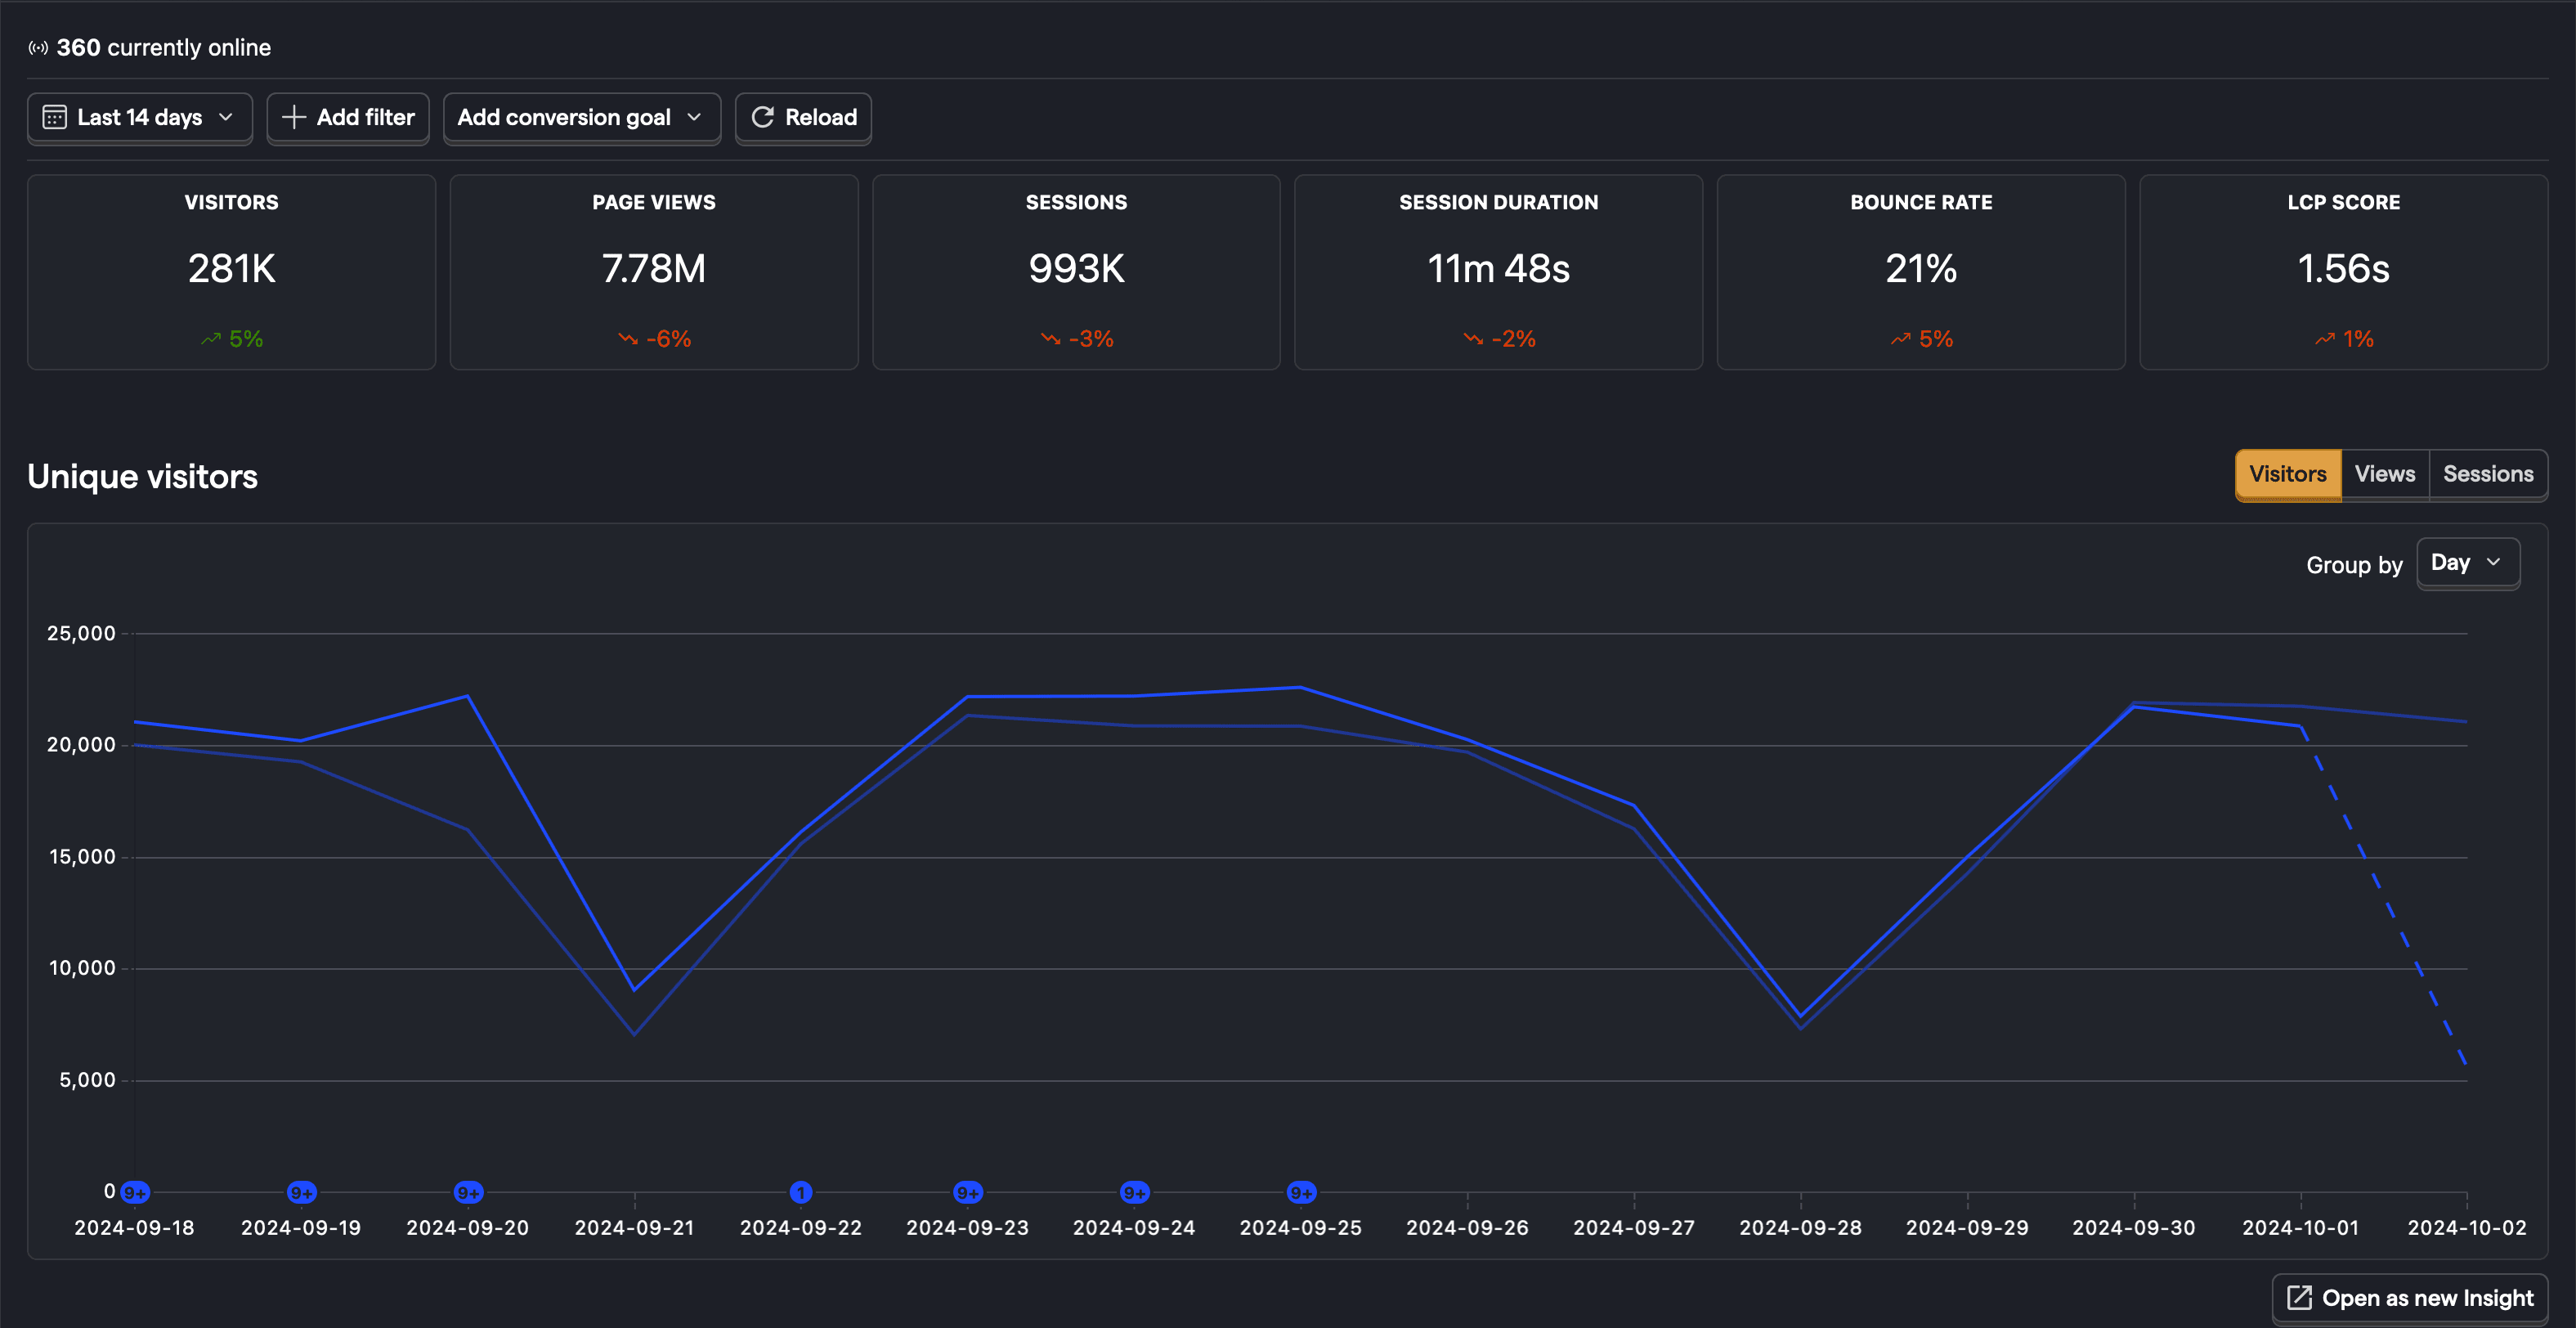
If you add a conversion goal, you can see the number of conversions and conversion rate as well.
Bounce rate
A bounce is a session where the user only had one pageview, no autocaptures, and spent less than 10 seconds on the page. Your bounce rate is the percentage of sessions that resulted in a bounce.
PostHog uses autocaptured events to calculate this. To make sure this value is accurate, make sure you enable autocapture and are capturing both $pageleave and $autocapture events.
You can change the duration threshold in the web analytics settings.
LCP Score
Largest contentful paint (LCP) is a web vital metric that measures how long it takes for the largest content element on a page to load.
To calculate the score, we take the 75th percentile of the LCP values for the first pageview of each session. A good LCP score is less than 2.5 seconds, and a poor score is more than 4 seconds.
Paths
Top paths drill down into specific pages on your site to show their views, visitors, bounce rate, and scroll depth. You can click on any of the paths to filter the dashboard for that path.
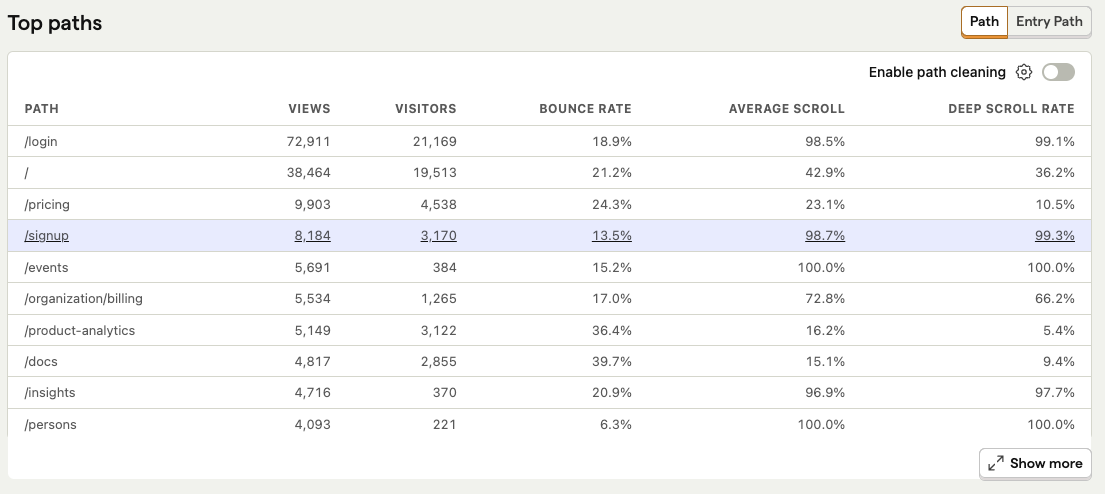
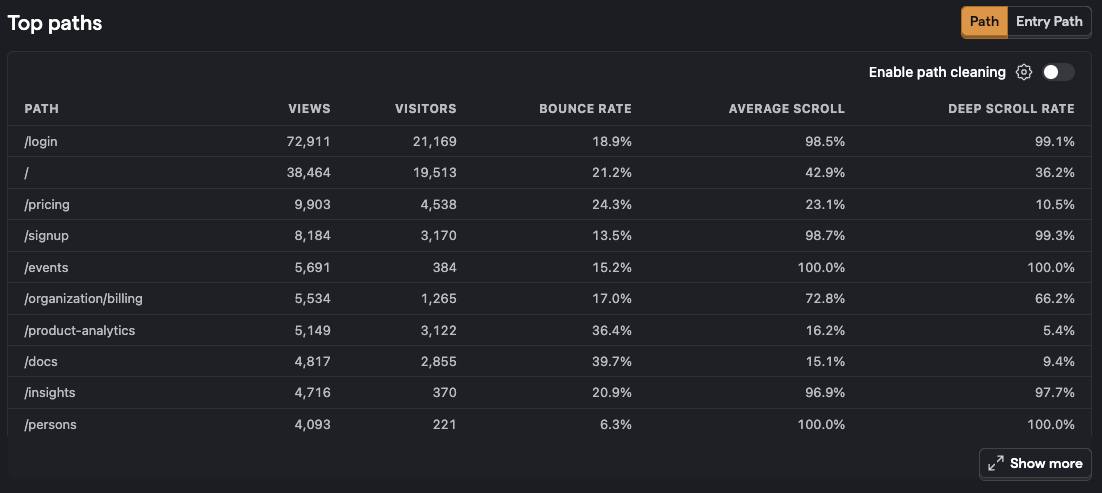
Entry and end paths show these stats for the first and last pageviews of each session, while outbound clicks shows the URLs that users clicked on to leave your site.
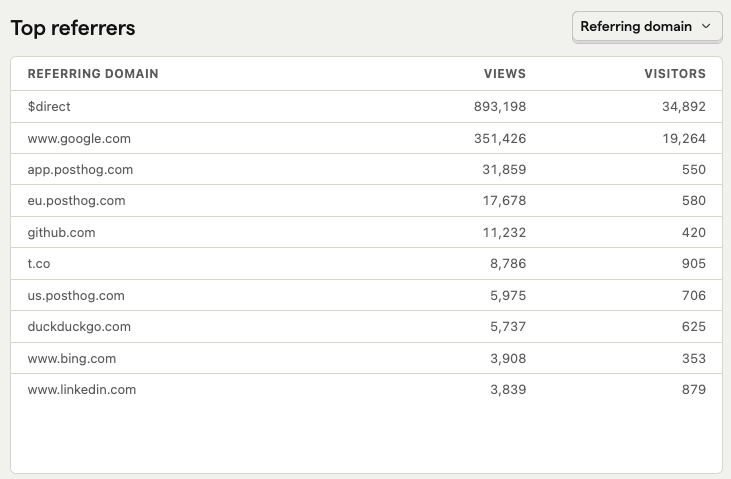
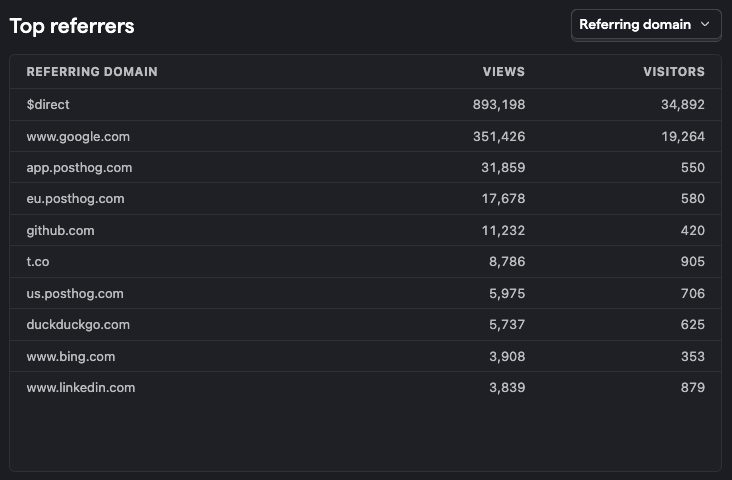
Channels, referrers, UTMs
To get an idea of where users are visiting your site from, you can see top referrers, channels, and UTMs.
You can dive deeper into how your sessions are attributed using the session attribution explorer. This shows the session count for each combination of channel type, referrer, and UTM as well as example entry URLs and the SQL query used to generate the data.
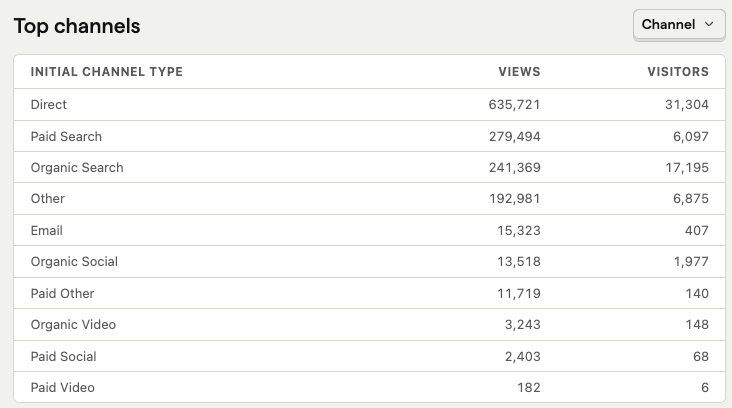
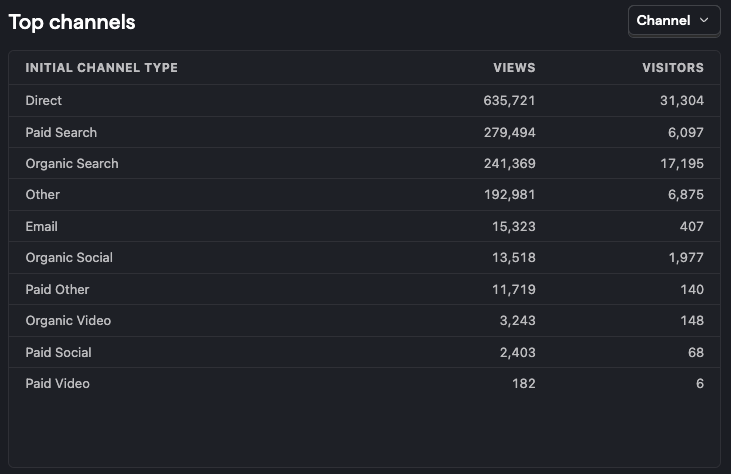
Channel types
Based on UTMs, referring domains, and more, PostHog automatically classifies traffic into specific acquisition channel types such as:
| Channel Type | Description of where the user came from |
|---|---|
| Direct | Typed in the URL directly or used a saved link. |
| Paid Search | An ad from a search engine, e.g. Google, Bing, or Baidu. |
| Paid Social | An ad from a social media platform, e.g. Facebook, LinkedIn, or Twitter |
| Paid Video | An ad from a video platform, e.g. YouTube or Twitch. |
| Paid Shopping | An ad from a shopping platform, e.g. Amazon or eBay. |
| Paid Other | An ad from an unknown platform. |
| Cross-Network | A cross-network ad |
| Organic Search | A non-ad search result from a search engine, e.g. Google, Bing, or Baidu. |
| Organic Social | A non-ad link from a social media platform, e.g. Facebook, LinkedIn, or Twitter |
| Organic Video | A non-ad link from a video platform, e.g. YouTube or TikTok. |
| Organic Shopping | A non-ad link from a shopping platform, e.g. Amazon or eBay. |
| Affiliate | An affiliate link. |
| Referral | A referral link. |
| A link from an email. | |
| Display | A display ad, e.g. an ad on Google Display Network. |
| SMS | A link from an SMS. |
| Audio | An audio ad, e.g. a podcast ad. |
| Push | A push notification. |
| Other | A link from an unknown source. |
Read more: How channel type is calculated
Custom channel type
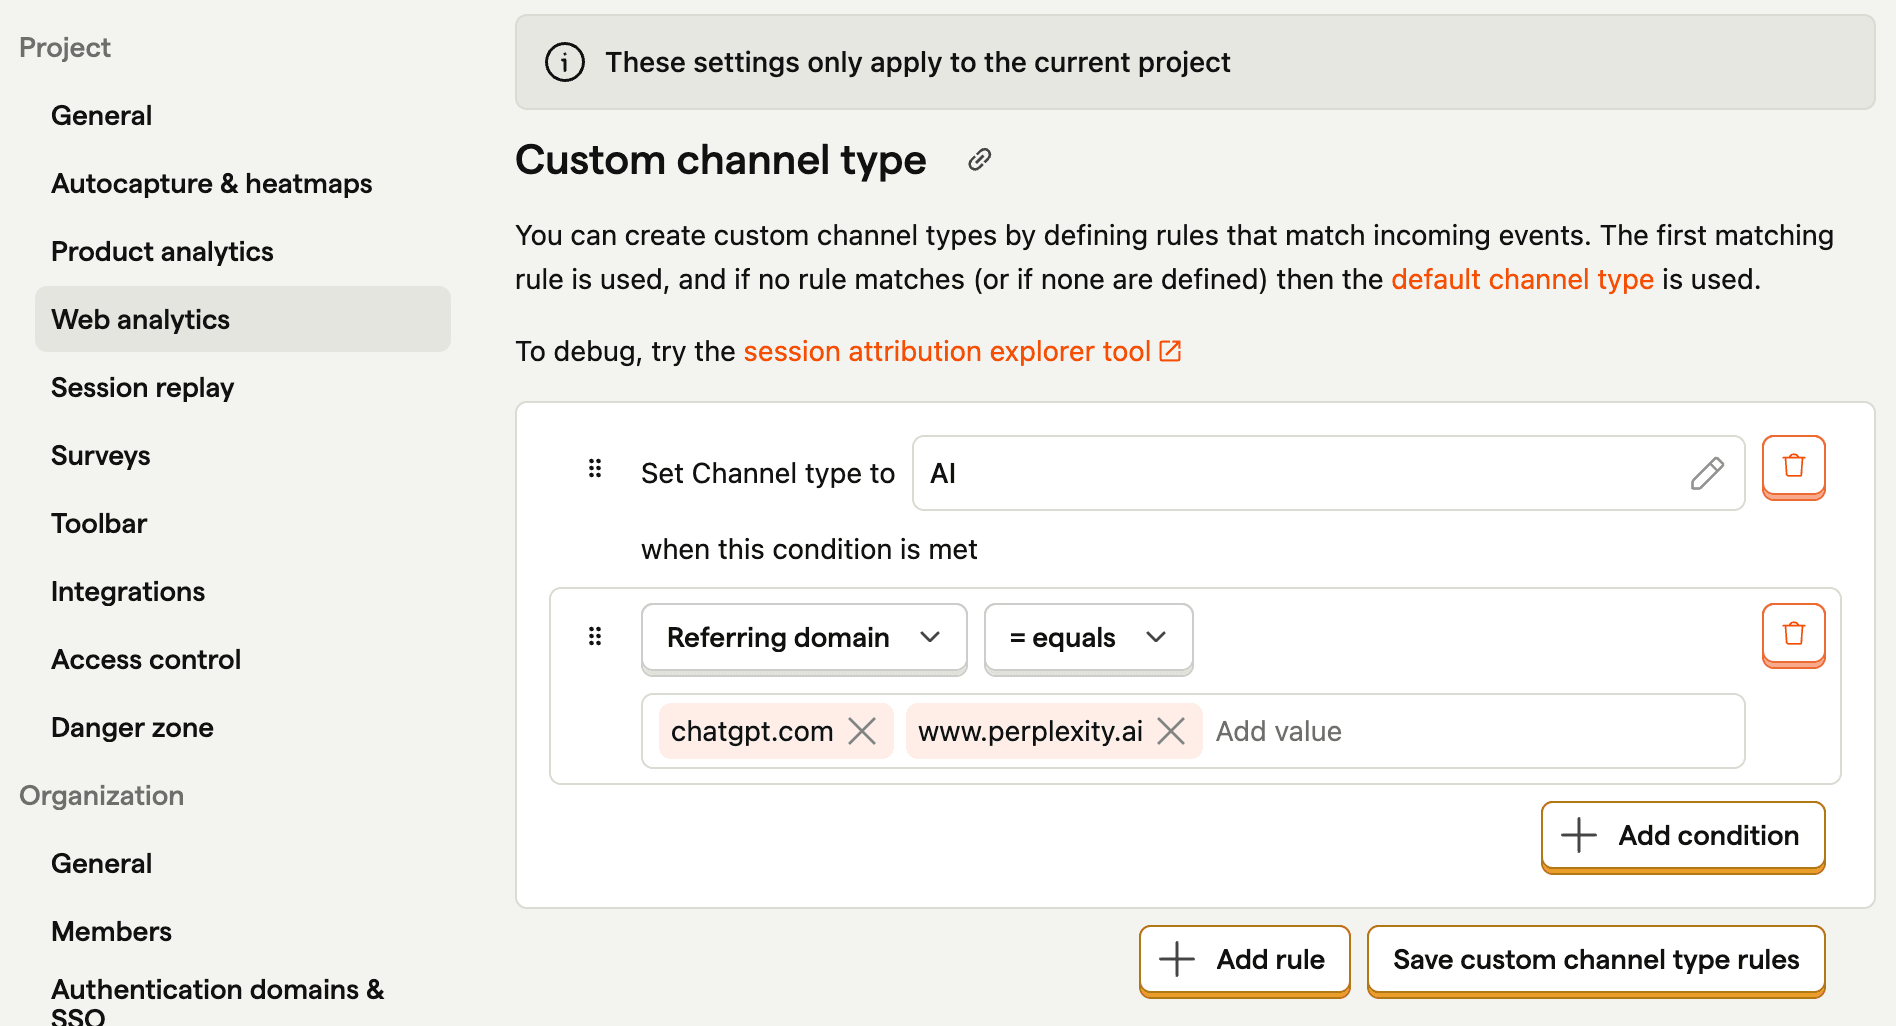
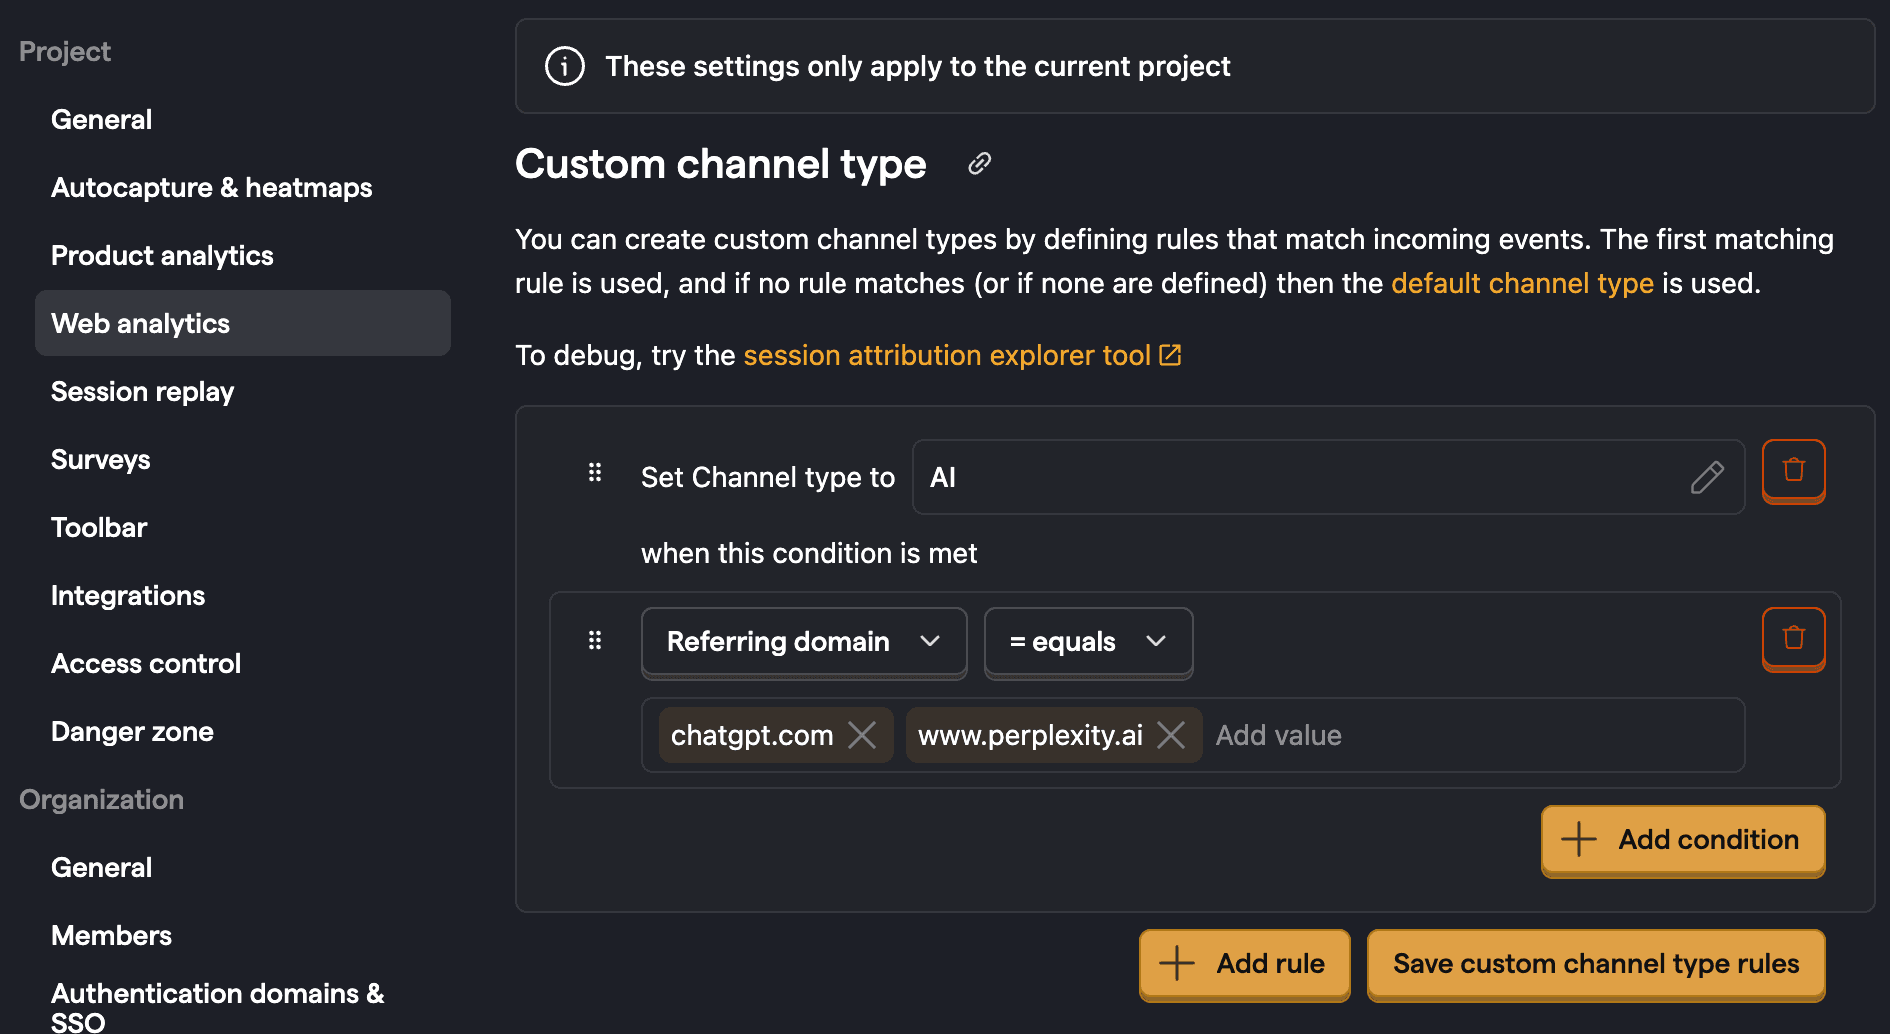
If our predefined channel types don't work for you, you can define rules to match incoming events to your own custom channel types in your project settings. The first matching rule is used, and if no rule matches (or if none are defined) then the default channel type is used.
For example, you could create an AI channel type where the referring domain equals chatgpt.com, www.perplexity.ai, and other AI services.
UTMs
UTMs include source, medium, campaign, content, and term. Each are set as URL parameters and autocaptured by PostHog. For example, the following URL has the source of twitter, medium of social, and campaign of twitter-campaign:
https://posthog.com/?utm_source=twitter&utm_medium=social&utm_campaign=twitter-campaign
Setting UTMs correctly is crucial for accurately classifying your traffic, not only for UTMs, but for channel types as well.
Read more: How to capture, customize, and filter UTM parameters
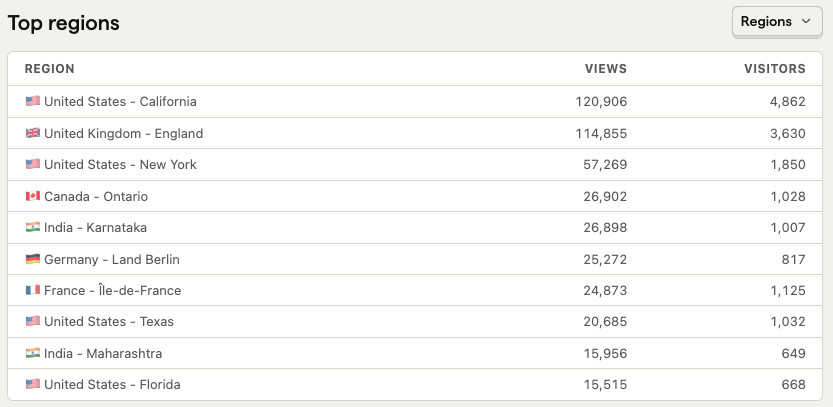
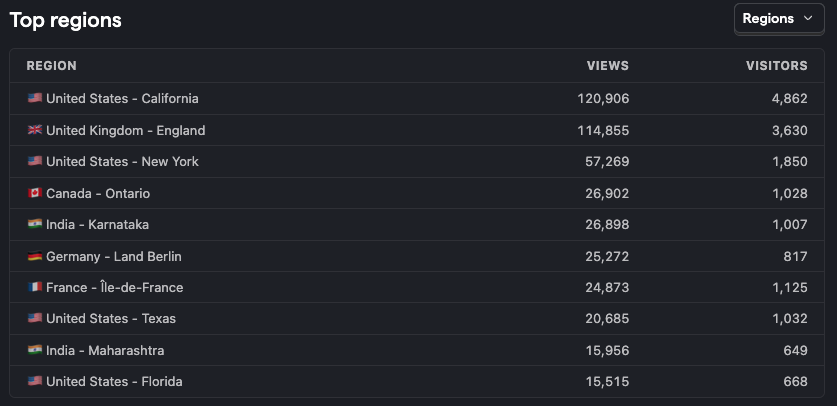
World map
The world map shows where your users are located, but you can also select it to show top countries, regions (like California, England, or Ontario), cities, timezones, or languages.
Retention
Retention creates a cohort of unique users who performed any event for the first time in the last week. It then tracks the percentage of users who return to perform any event in the following weeks.
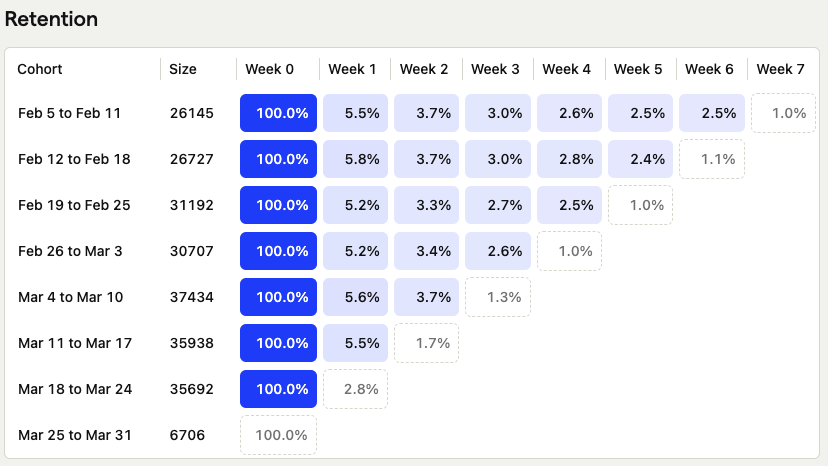
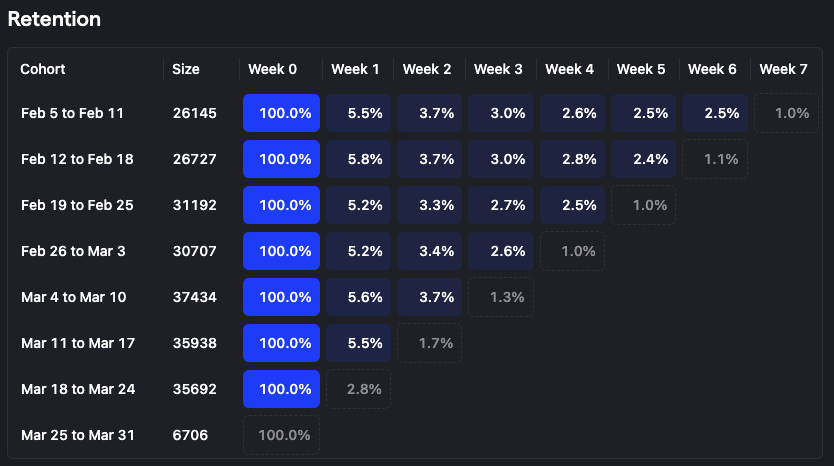
Read more: Creating and understanding retention
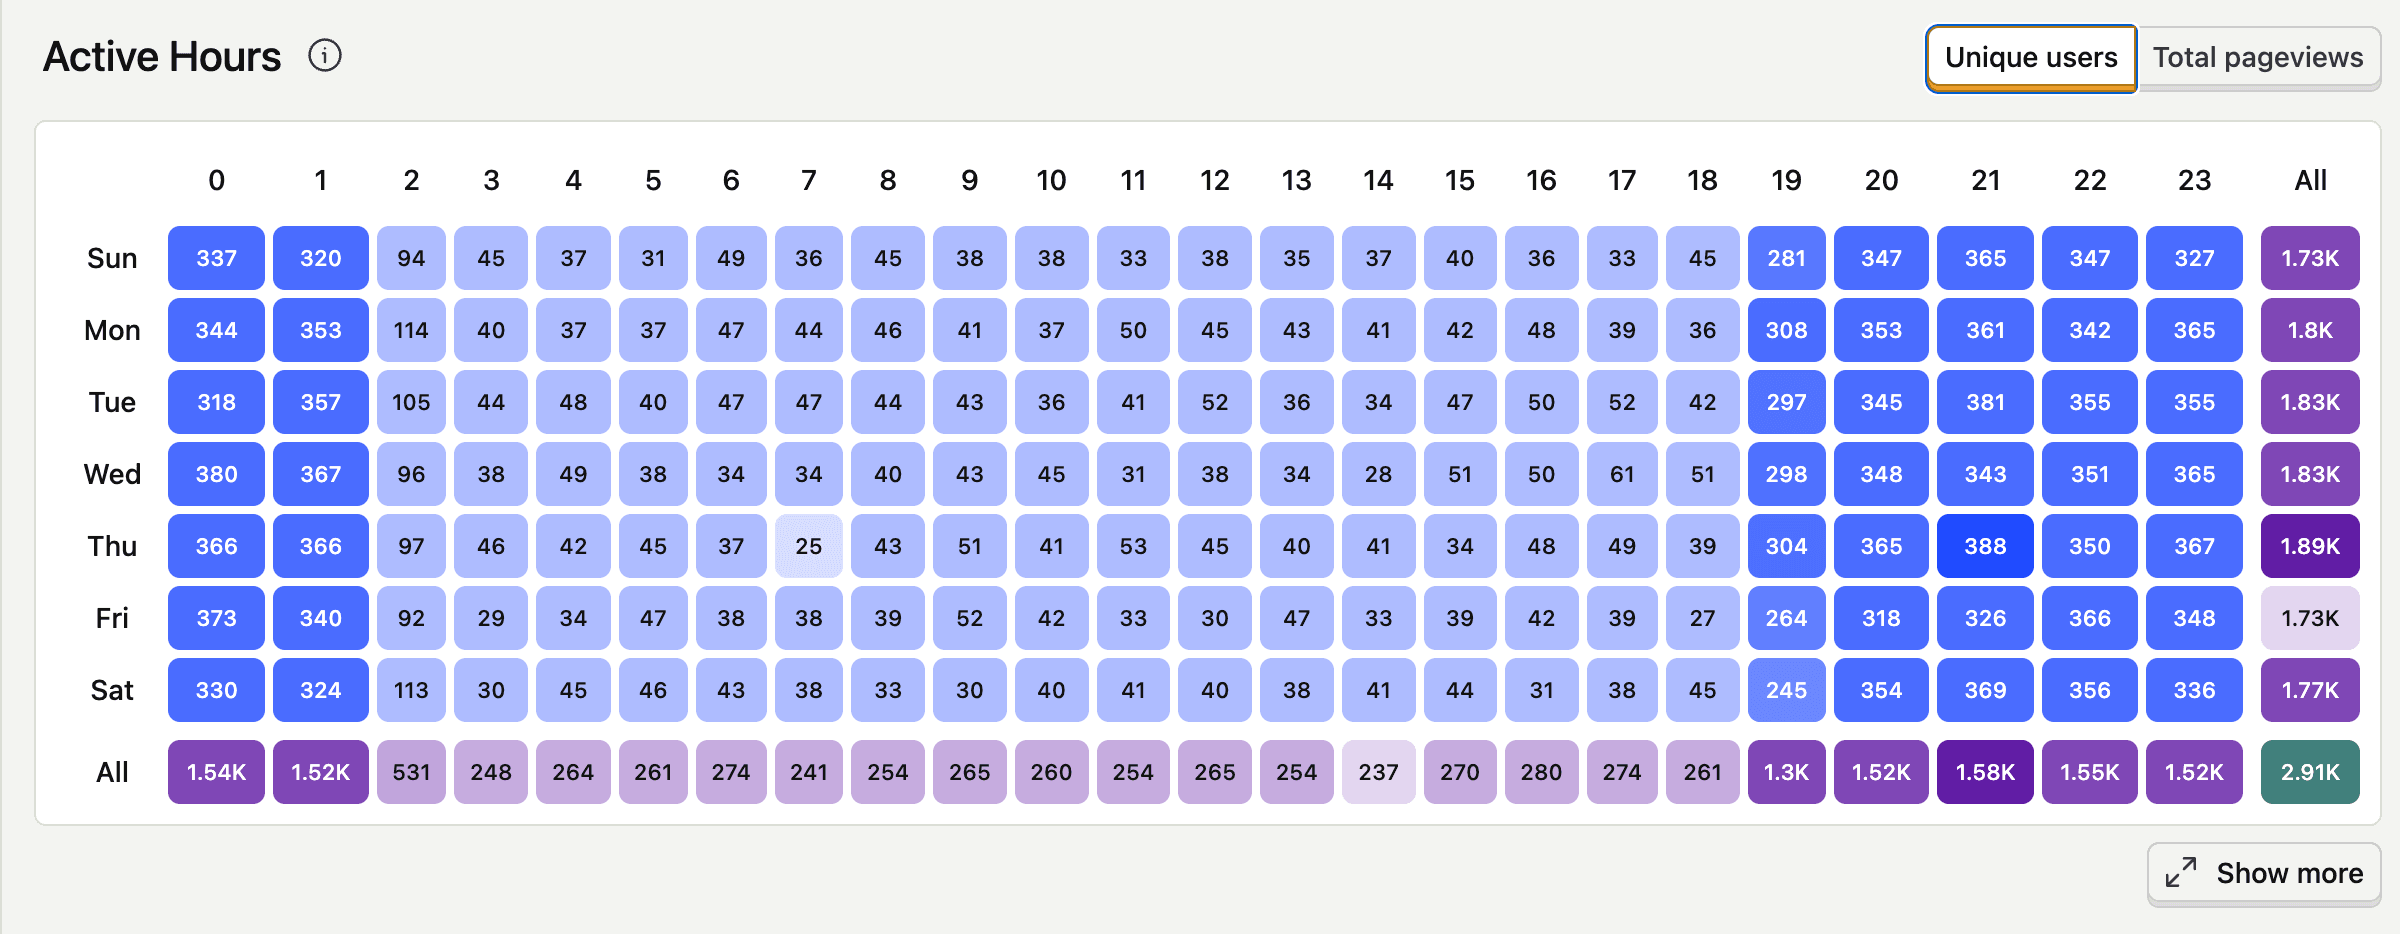
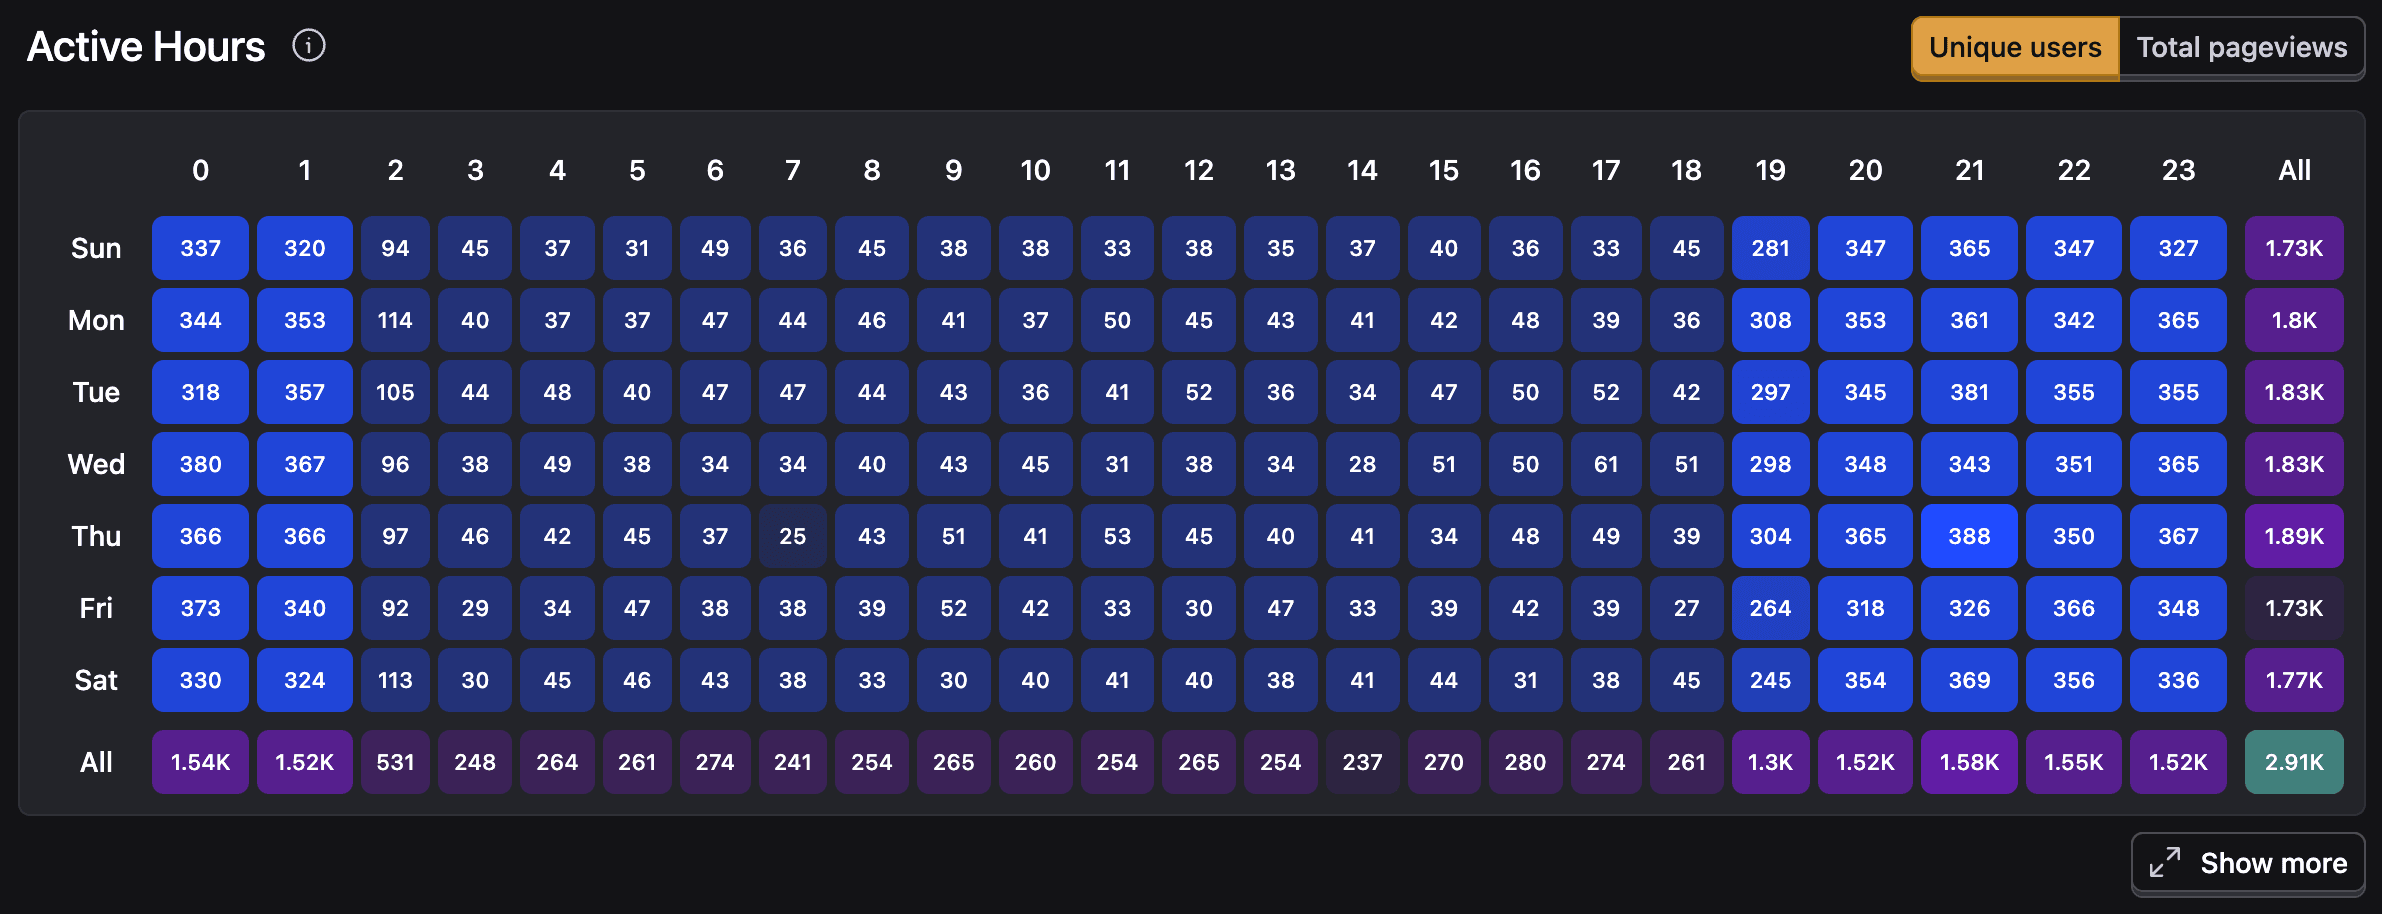
Active hours
The Active hours feature displays a heatmap showing either the number of unique users or total pageviews for any pageview event, broken down by hour of the day and day of the week You can switch between these two metrics using the tabs at the top right of the heatmap (Unique users or Total pageviews).
What the heatmap shows:
- Each cell represents the number of unique users or total pageviews during a specific hour of a specific day. Numbers are formatted for readability (e.g., 1.73K for 1,730).
- The "All" column on the right aggregates the total for each day across all hours, and is highlighted in a different color.
- The bottom row ("All") aggregates the total for each hour across all days, also highlighted in a different color.
- The bottom-right cell shows the grand total for the selected metric (unique users or total pageviews) across all days and hours in the selected time range, with a distinct color.
- Use the "Show more" button to expand the heatmap and view additional details if available.
- The displayed time for each cell and the starting day of the week are based on your project's date and time settings. By default, the time is UTC, but you can change the timezone in your project settings.
Note: Selecting a time range longer than 7 days will include additional occurrences of weekdays and hours, potentially increasing the counts in those buckets. For best results, select 7 closed days or a multiple of 7 closed day ranges.
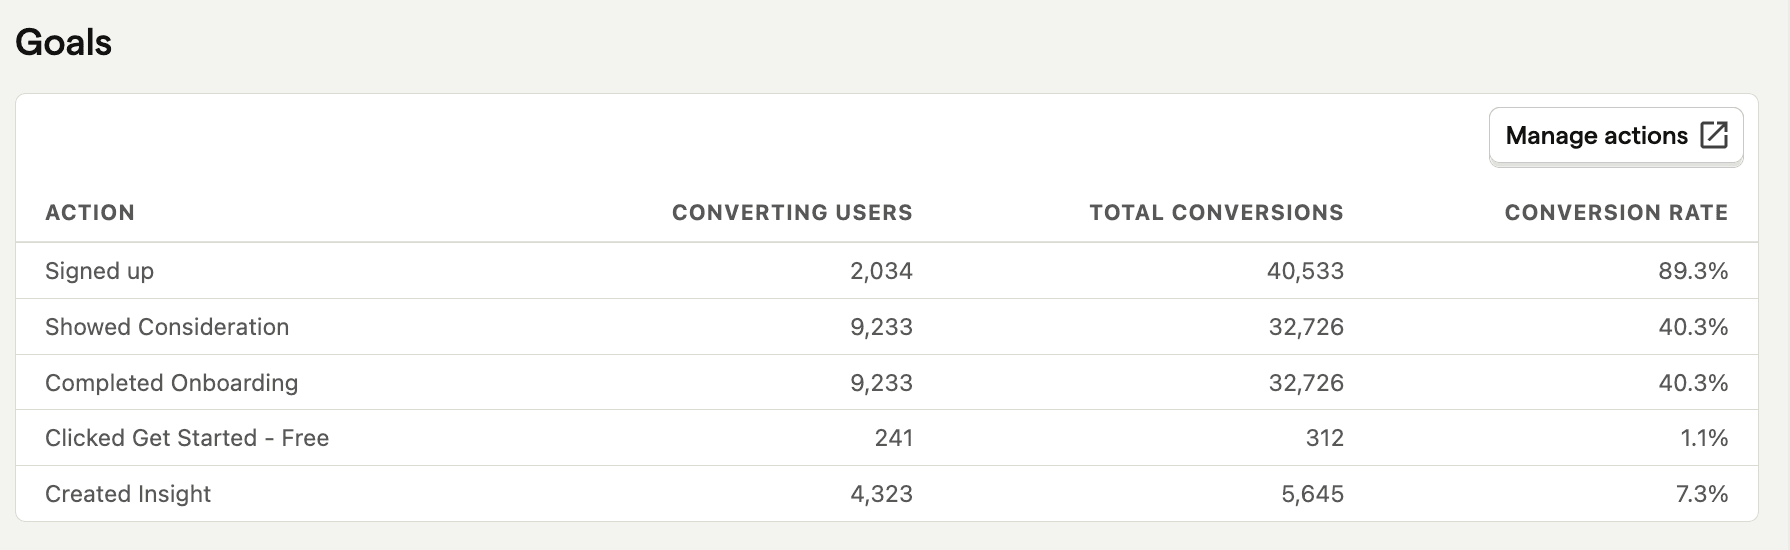
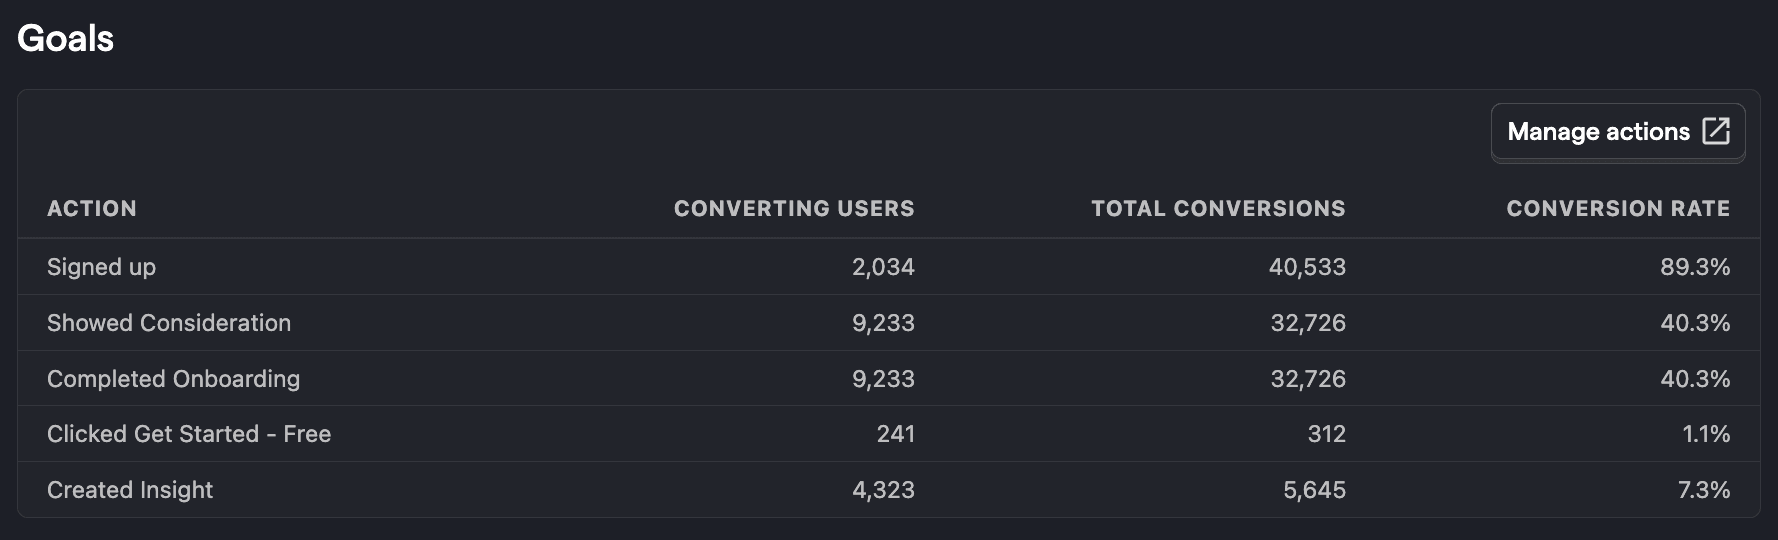
Goals
Goals shows your pinned or most recently created actions and the number of conversions they've had. You can set a custom event or action as a conversion goal at the top of the dashboard for more specific metrics.
Filtering your dashboard
Like other dashboards in PostHog, the web analytics dashboard is filterable. This means you can filter for data with certain event or person property values. Options include browser, path name, device type, country, and UTMs. Just click the "Add filter" button next to the date range at the top of the dashboard.
This enables you to dive into specific stats for regions, parts of the site, and specific marketing campaigns.
For more complex queries, you can still use the product analytics tab as usual.
And for more on web analytics, check out our getting started guide.