Web vitals
Contents
PostHog can automatically capture web vitals like largest contentful paint, first input delay, cumulative layout shift, and first contentful paint. This means you don't need to manually add web vitals logging.
You can also see them in the web vitals dashboard.
What are Web vitals?
Web vitals are a set of metrics that measure the performance of your site. PostHog provides a dashboard for the following:
- FCP: First Contentful Paint
- LCP: Largest Contentful Paint
- INP: Interaction to Next Paint
- CLS: Cumulative Layout Shift
FCP - First Contentful Paint
First Contentful Paint (FCP) measures the time from when the page starts loading to when any part of the page's content is rendered on the screen. This could be text, images, SVGs, or even <canvas> elements. FCP is important because it indicates when users first see something happening on your page, giving them confidence that the page is actually loading.
A good FCP score is 1.8 seconds or less. Poor FCP scores can be caused by render-blocking resources (like CSS or JavaScript files), slow server response times, or large HTML documents that take time to parse.
Improving FCP often involves optimizing critical rendering paths, reducing server response times, and minimizing or deferring non-critical resources.
LCP - Largest Contentful Paint
Largest Contentful Paint (LCP) measures how long it takes for the largest content element visible in the viewport to be rendered. This is typically an image, video, or large block of text. LCP is important because it tells you when the main content of a page has finished loading from a user's perspective.
A good LCP score is 2.5 seconds or less. If your LCP is higher, users might perceive your site as slow or unresponsive. Common causes of poor LCP include slow server response times, render-blocking JavaScript and CSS, slow resource load times, and client-side rendering.
Improving LCP often involves optimizing server response times, minimizing render-blocking resources, optimizing images, and implementing effective caching strategies. Key techniques include using a CDN to serve content closer to users, deferring non-critical JavaScript, compressing and properly sizing images, using modern image formats like WebP, implementing browser caching, and optimizing the critical rendering path by minimizing critical resources and prioritizing visible content.
INP - Interaction to Next Paint
Interaction to Next Paint (INP) measures the responsiveness of your site by measuring the time it takes to respond to user interactions like clicks or taps. It's important because it tells you how quickly your site reacts to user input, which is a key factor in user experience.
A good INP score is 100ms or less. Poor INP scores can be caused by slow JavaScript execution, blocking the main thread, or excessive layout thrashing.
To improve INP, optimize JavaScript performance, reduce unnecessary layout changes, and ensure smooth animations.
CLS - Cumulative Layout Shift
Cumulative Layout Shift (CLS) measures visual stability by quantifying how much unexpected layout shifts occur during the entire lifespan of the page. A layout shift happens when a visible element changes its position from one rendered frame to the next. CLS is important because unexpected movement of page content can be extremely frustrating for users, especially if they were about to click or tap on something that suddenly moves.
A good CLS score is 0.1 or less. Common causes of poor CLS include images or ads without dimensions, dynamically injected content, web fonts causing FOIT/FOUT (Flash of Invisible/Unstyled Text), and actions waiting for a network response before updating the DOM.
To improve CLS, always include width and height attributes on images and video elements, reserve space for dynamic content, and ensure web fonts don't cause layout shifts. Modern web frameworks should help you with this.
Web vitals dashboard
You can access web vitals in PostHog by opening Web Analytics and clicking the Web Vitals tab at the top left.
The dashboard provides you with a summary of your web vitals and allows you to drill down into the data.
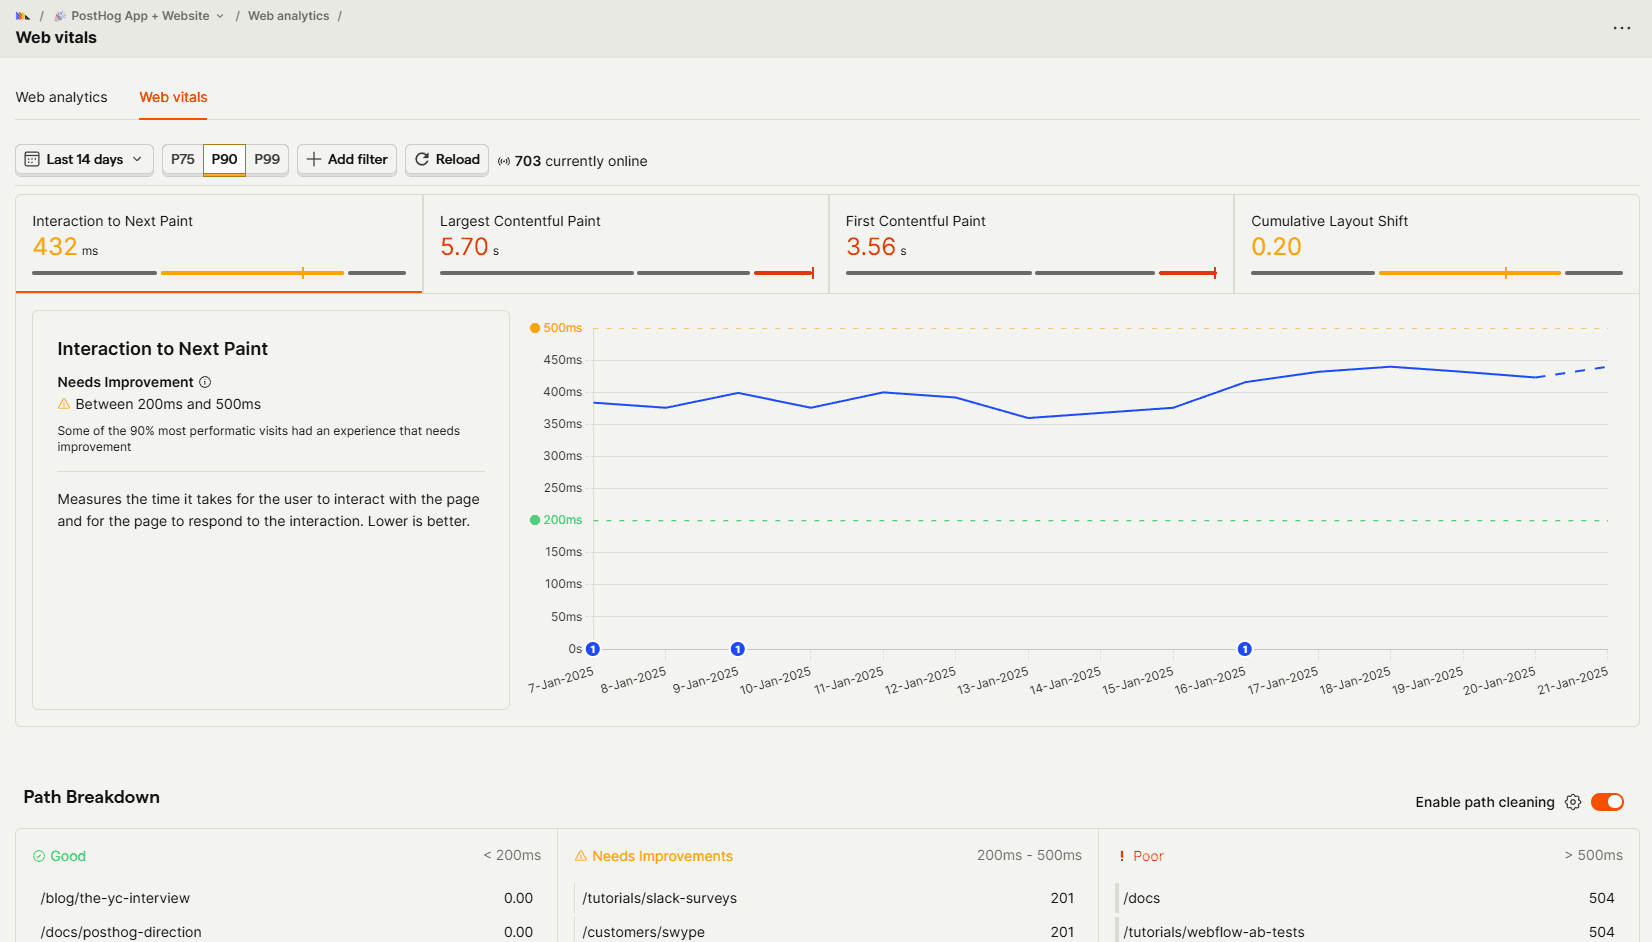
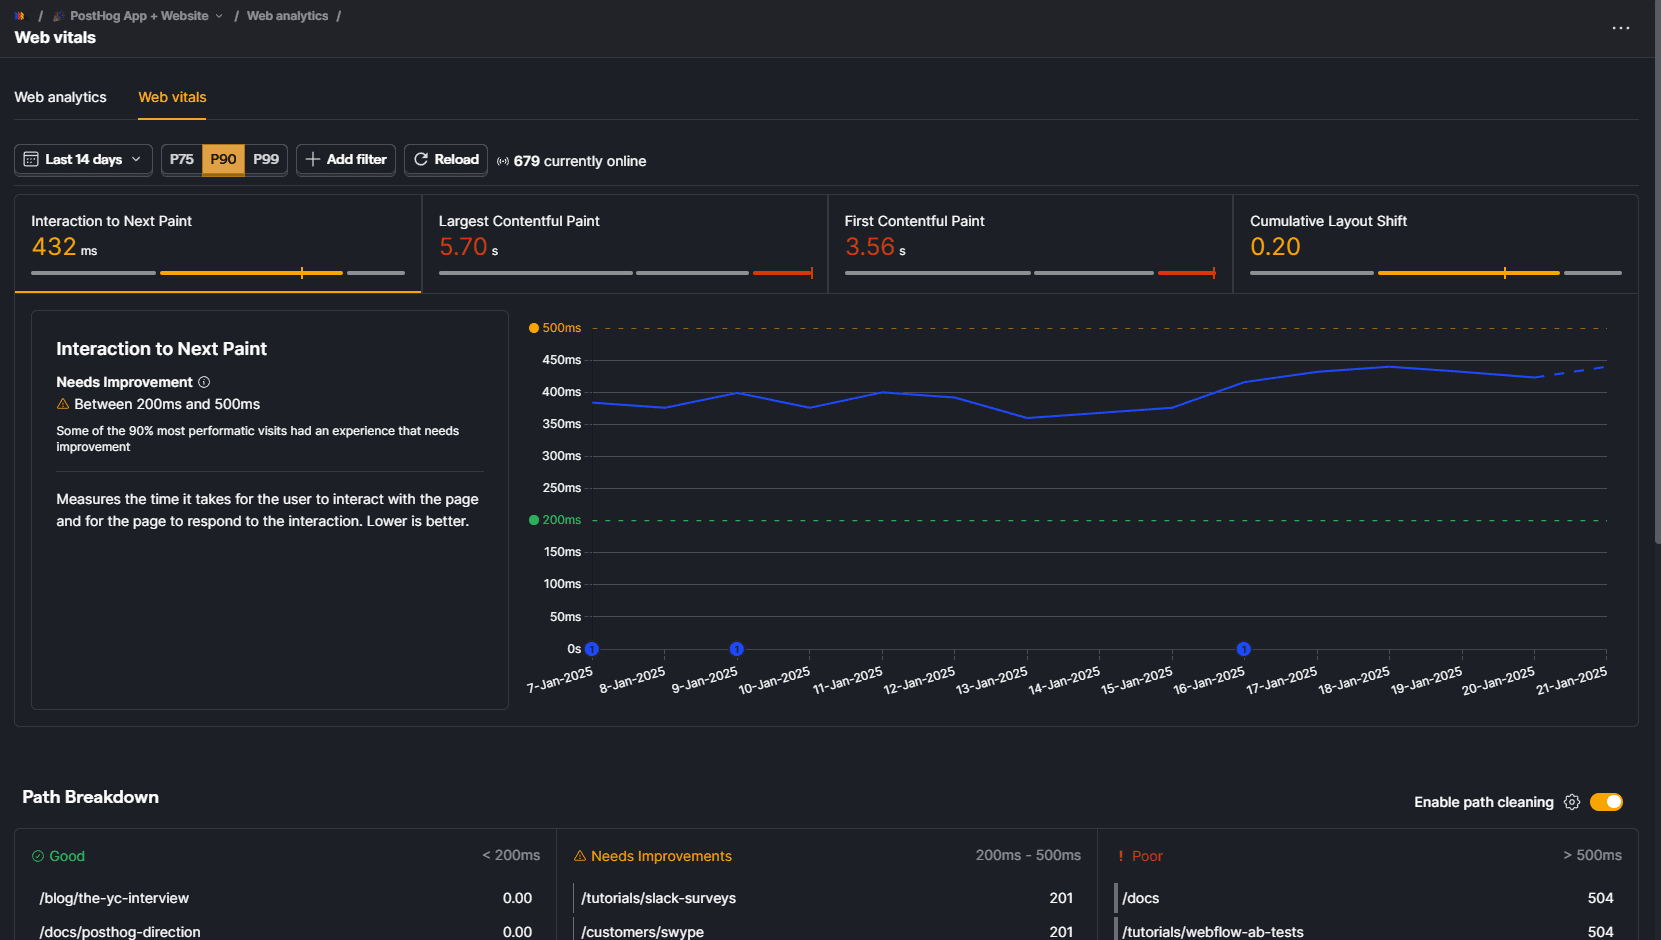
In this dashboard, you can see how that data changed over time for the 4 different metrics we keep track of, allowing you to specify a time period, and also add the same filters you can already set in Web Analytics.
At the bottom of the dashboard, you can see a table with a breakdown of the pages with good, needs improvement, and poor scores. You should focus on optimizing the pages with poor scores.
What are the thresholds for good web vitals?
Web vitals can be categorized in 3 categories: Good, Needs improvement, and Poor.
They differ according to the specific metric:
| Metric | Good | Needs improvement | Poor |
|---|---|---|---|
| FCP (First Contentful Paint) | ≤ 1.8s | 1.8s - 3.0s | > 3.0s |
| LCP (Largest Contentful Paint) | ≤ 2.5s | 2.5s - 4.0s | > 4.0s |
| INP (Interaction to Next Paint) | ≤ 200ms | 200ms - 500ms | > 500ms |
| CLS (Cumulative Layout Shift) | ≤ 0.1 | 0.1 - 0.25 | > 0.25 |
What is the recommended percentile?
PostHog allows you to look at performance for p75, p90 and p99. We suggest you to use the p90 percentile to verify your web vitals. This means that 90% of your users will have an experience better than the one displayed. This is for a couple reasons:
- It is the most common percentile used by web developers to verify their web vitals.
- It provides a good balance between capturing real user issues while filtering out extreme outliers that may be due to factors outside your control (like very poor network conditions or device performance)
- Looking at p99 may lead to unnecessary over-optimization. Web vitals are a good starting point for improving your site, but they are not the only metrics you should focus on.
What are the top-level values displayed in the web vitals dashboard?
The top-level values displayed in the web vitals dashboard is the value from the last day in the time period you've currently selected. Some people would expect it to be the average of the selected percentile, but that's not the case. We want you to easily see the current state of your Web vitals and for that reason displaying the latest (non-zero) value is more useful.
Web vitals in the toolbar
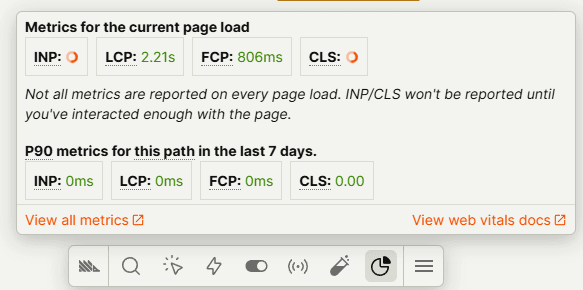
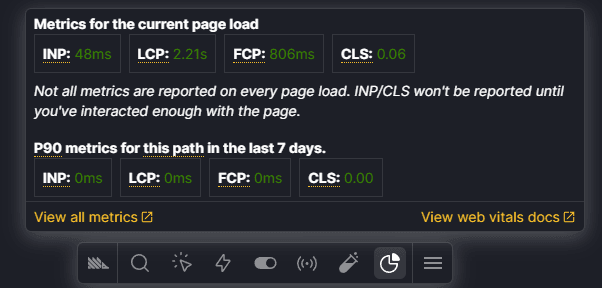
Our toolbar also includes Web Vitals information. In it you can see what the metrics for the current page load are, but also look at historical data for the same page.
How to enable web vitals autocapture
Go to your autocapture settings. Then, in the Web vitals autocapture section, click Enable.
Note: Web vitals autocapture is separate from our regular autocapture feature. Web vitals can be captured regardless of whether autocapture is enabled.
Note: You'll need to be using SDK v1.141.2+ to use web vitals autocapture.
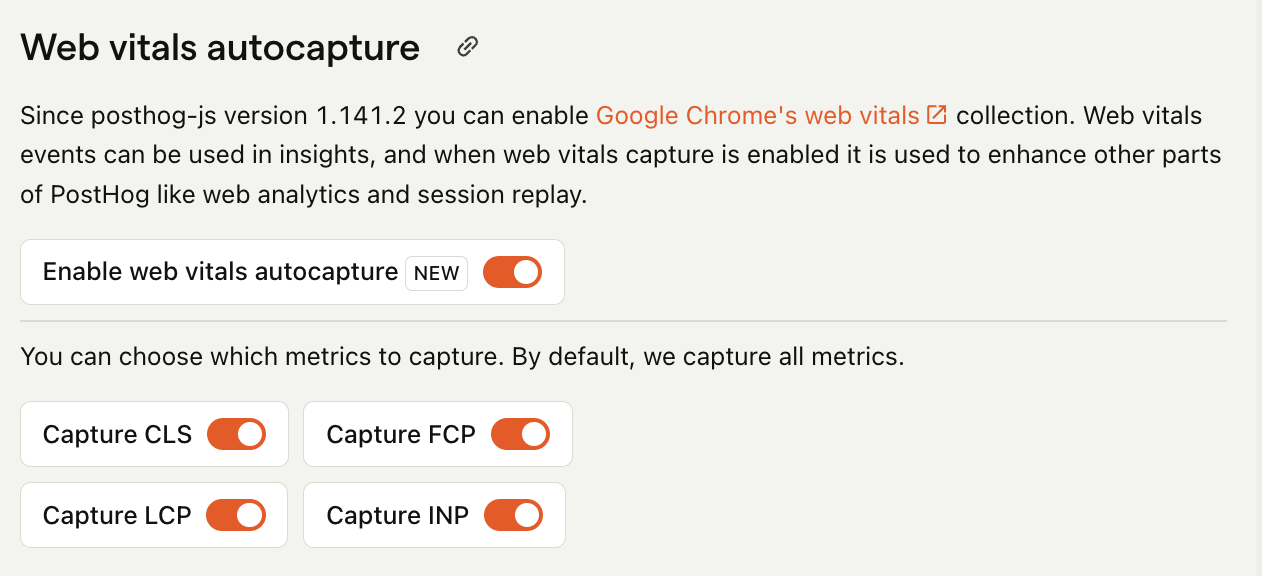
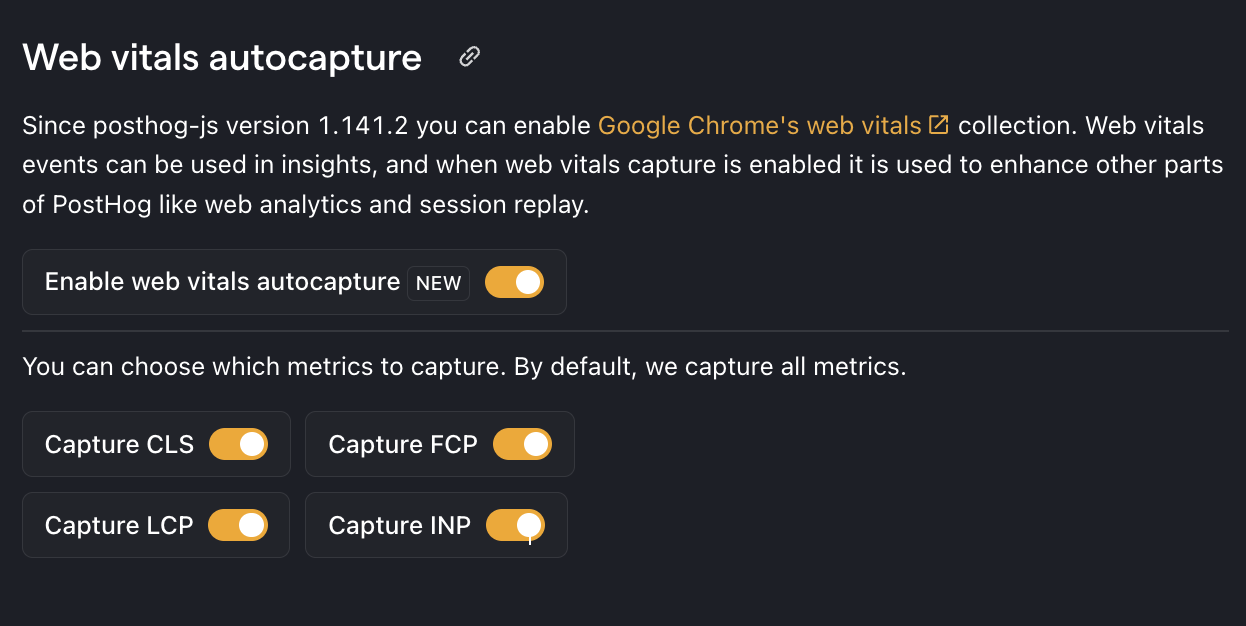
Once enabled, web vitals are captured under the $web_vitals event name. These events include properties for each of the metrics like $web_vitals_FCP_value and $web_vitals_FCP_event.
You can choose which metrics to capture by using the toggles.
Configuring web vitals autocapture
You can provide a client side config to tune web vitals autocapture. These are set on the capture_performance key in the PostHogConfig interface.
| Attribute | Description |
|---|---|
__web_vitals_max_valuedefault: 15 minutes | We observe very large values reported by the Chrome web vitals library. These outliers are likely not real, useful values, and we exclude them. You can set this to 0 in order to include all values |
web_vitals_allowed_metricsdefault: ['LCP', 'CLS', 'FCP', 'INP' ] | By default all 4 metrics are captured. You can set this config to restrict which metrics are captured. e.g. ['CLS', 'FCP'] to only capture those two metrics. This does not override whether the capture is enabled |
web_vitals_delayed_flush_msdefault: 5000 | We delay flushing web vitals metrics to reduce the number of events we send. This is the maximum time we will wait before sending the metrics. |
When and how are events captured?
The SDK attempts to send as many of the available metrics as possible in each $web_vitals event. By default, we wait up to 5 seconds since the page load or last $web_vitals event to try and catch all four metrics in one event. See the section on configuring web vitals capture to change this behavior.
Metrics are made available when the web vitals library triggers them:
- FCP and LCP are relative to a page being rendered and are made available soon after loading a page.
- INP and CLS are measured across the lifecycle of a page and don't have a fixed time they become available.
You can look at our Web vitals capturing code in web-vitals/index.ts.
Sampling $web_vitals events
If you're concerned about the cost of $web_vitals events, you can enable sampling for $web_vitals events.
This will reduce the amount of events you send at the cost of some accuracy.
We offer a pre-built function to sample by event name. You can import this using a package manager, or add the customization script to your site. You can also roll your own function if you prefer a tighter control over the sampling rate.
Pricing
Web vitals ($web_vitals) events are charged as regular events, and the first 1M are free.
On average, you'll send 30% of the amount of $pageview events as $web_vitals events.
Check our pricing page for more information, and we have a calculator there too!
