


Console logs recording
Contents
PostHog can capture console logs, info, warnings, and errors from your application. This is useful for debugging and providing extra context on what is happening in your user's browser or mobile device environment.
As console logs can contain sensitive information, we do not capture these logs automatically. You can enable this feature globally either from your project settings or client-side by setting enable_recording_console_log: true in our JavaScript Web SDK config.
Important: Individual console logs are truncated at 2000 characters. The rest of the log is not sent to PostHog. When truncating a log message we add
...[Truncated]to the message.
You can enable this feature from your client-side by setting captureLogcat = true in your Android Session Replay configuration. Remote configuration via project settings requires Android SDK version 3.32.0 or higher.
You can enable this feature from your client-side by setting captureLog: true in our React Native SDK config.
As console logs can contain sensitive information, we do not capture these logs automatically.
You can enable this feature from your client-side by setting captureLogs = true in our iOS SDK config.
Important: Individual console logs are truncated at 2000 characters. The rest of the log is not sent to PostHog. When truncating a log message we add ...[Truncated] to the message.
Sanitizing or skipping logs
PostHog iOS SDK allows you to customize how log messages are processed and categorized by providing a custom logSanitizer handler.
This handler is called for each new line printed to the console. It receives the line's content and can return either a processed log entry with its severity level, or nil to skip the log entirely:
Configuring minimum log level
By default, the SDK only captures error-level logs to minimize noise in session replays.
You can adjust this using the minLogLevel setting:
Only logs with a level greater than or equal to the minLogLevel will be captured. For example, if set to .warn, both warning and error logs will be captured, but info logs will be filtered out.
Default behavior
Log level
The SDK captures raw console output directly, independent of any specific logging framework or implementation. Since the raw output doesn't inherently carry log level information, the SDK deduces severity levels by analyzing the log content. By default, the SDK automatically classifies log messages into three severity levels:
Error (highest severity)
- Messages containing: "error", "exception", "fail", "failed"
- OSLog entries with type "Error" or "Fault"
Warning (medium severity)
- Messages containing: "warning", "warn", "caution", "deprecated"
- OSLog entries with type "Warning"
Info (lowest severity)
- All other messages that don't match error or warning patterns
Filtering and processing
- Log filtering based on
minLogLevel(default:.error). Only logs with equal or higher severity are captured. - Multi-line logs are automatically split into separate entries
- OSLog metadata (e.g., subsystem, category) is automatically removed for cleaner output
The SDK captures logs from:
- Standard output (stdout)
- Standard error (stderr)
- OSLog messages
- NSLog messages
Viewing and searching console logs
Once enabled, you can then view captured console logs by clicking the "Inspector" button and choosing the console tab.
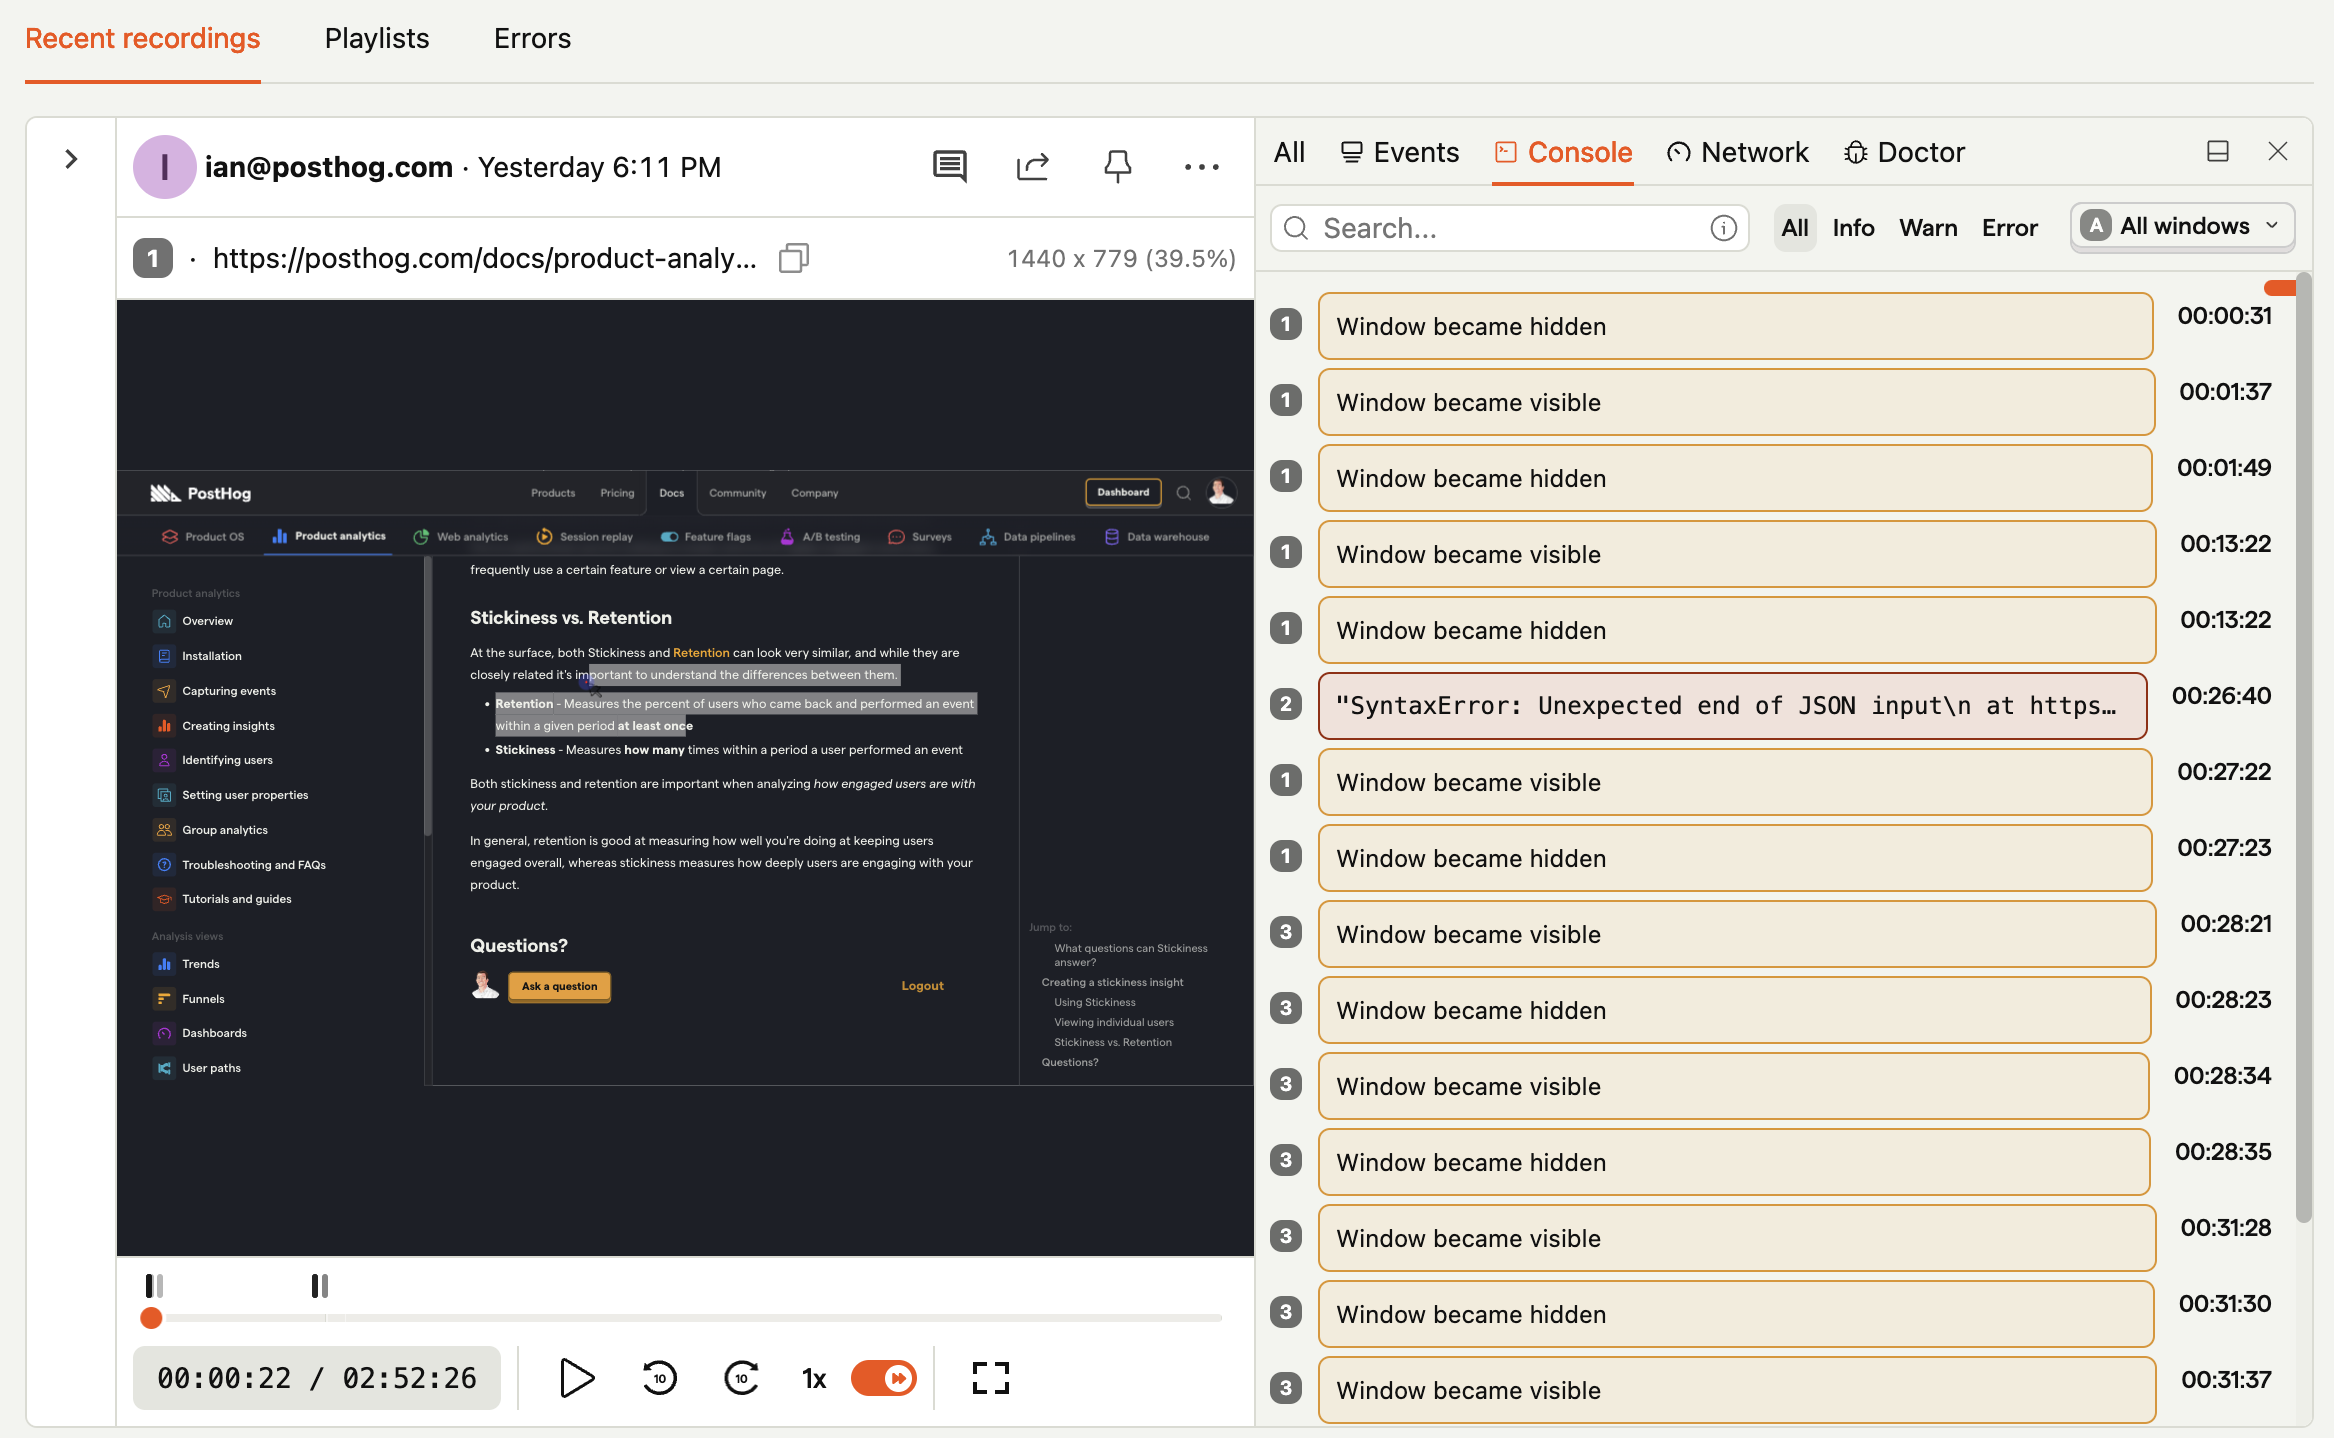
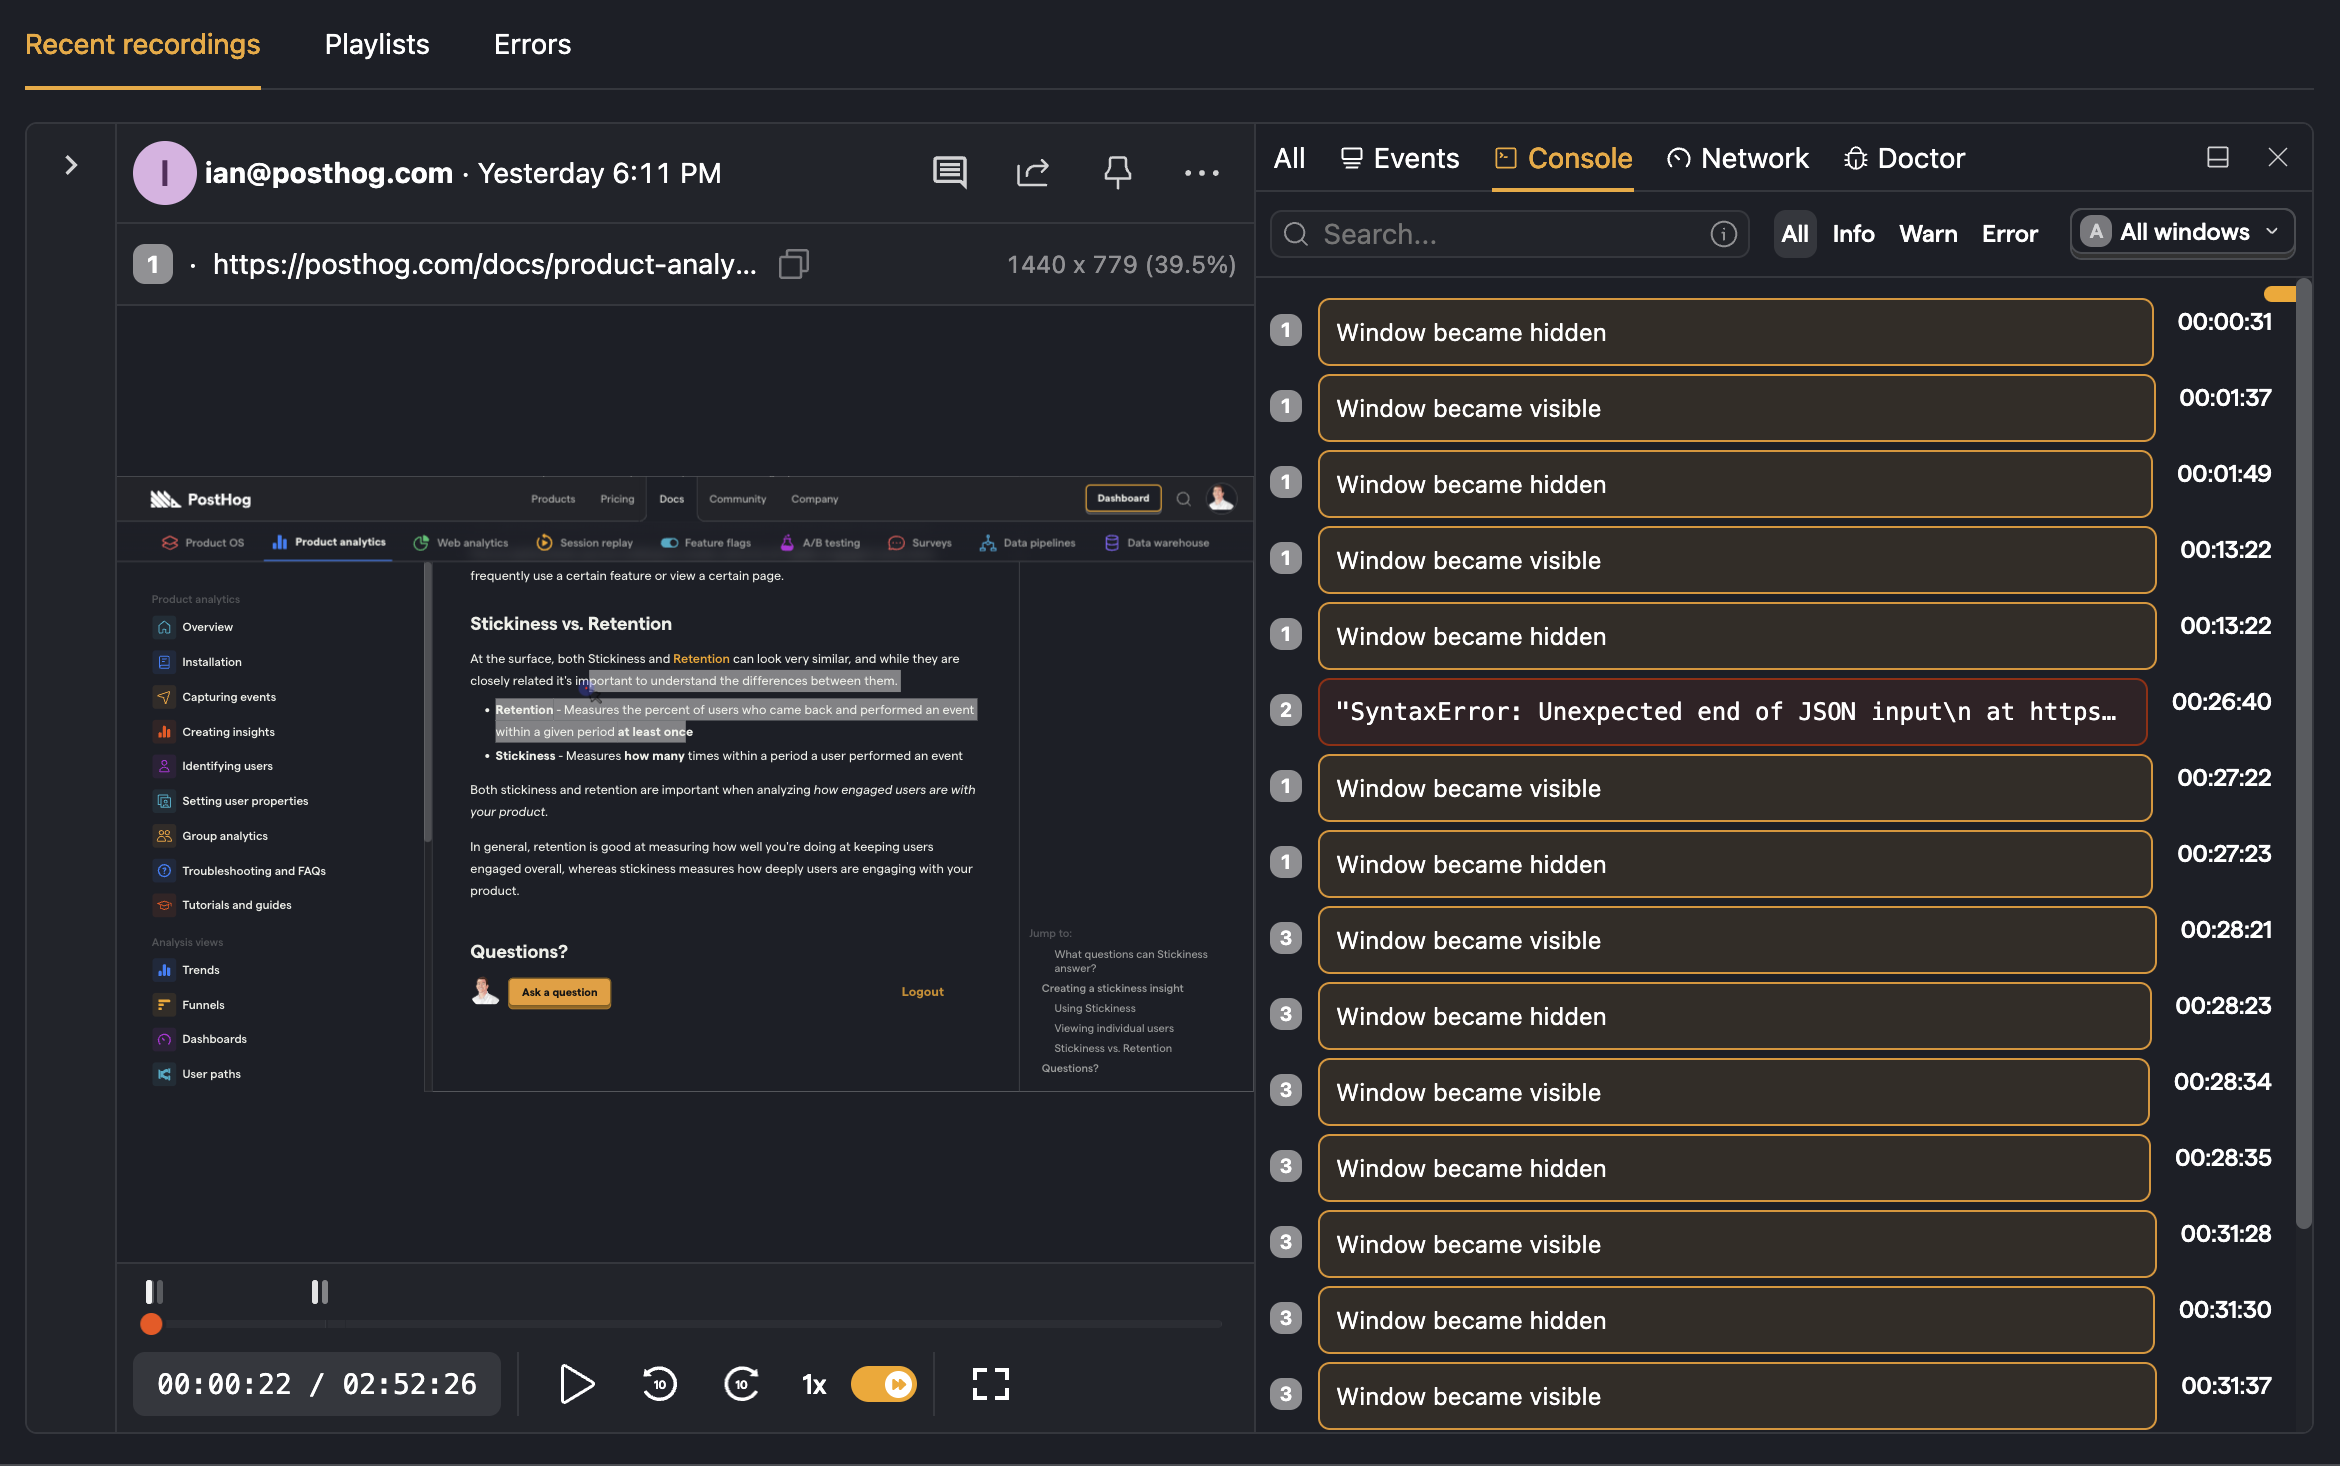
In that tab, you can search for specific logs with the following patterns:
| Token | Match Type | Description |
|---|---|---|
jscript | fuzzy-match | Items that fuzzy match jscript |
=scheme | exact-match | Items that are scheme |
'python | include-match | Items that include python |
!ruby | inverse-exact-match | Items that do not include ruby |
^java | prefix-exact-match | Items that start with java |
!^earlang | inverse-prefix-exact-match | Items that do not start with earlang |
.js$ | suffix-exact-match | Items that end with .js |
!.go$ | inverse-suffix-exact-match | Items that do not end with .go |