


An engineer's guide to behavioral analytics

Contents
The measurement and analysis of user behavior, AKA behavioral analytics, is critical to building successful products. This has long been a responsibility of product managers, marketers, and analysts, but that is changing. Many engineers are taking on product responsibilities, and with that, are developing a need for behavioral analytics.
We know because we build behavioral analytics tools, like product analytics and session replay, for these engineers. We've seen a growing trend of engineers using analytics to track user experience, measure the impact of their work, and discover areas needing improvement.
We also know that engineers are busy and behaivoral analytics is, at most, a small part of their job. To help you get the most value out of behavioral analytics as fast as possible, this guide covers the most practical and relevant parts of behavioral analytics for engineers.
1. Start small
Most guides recommend doing a lot of planning before implementing behavioral analytics. They encourage you to "map your customer journey" and develop a foolproof "tracking plan". We disagree. Strongly, in fact.
Why?
Because striving for a "perfect" plan is just a recipe for frustration. There's so much you can track and often the most the most valuable things are the least predictable. We're in the "jump off the cliff and build an airplane on the way down" camp. You'll just learn faster this way.

Start by tracking one specific area and expanding from there — e.g. track the usage of a specific feature. If you're using PostHog you can either:
Rely on PostHog's autocapture and create an action representing usage.
Capture a custom event. Customer events we track include
insight analyzed,dashboard created, andsurvey launched.A bit of both — we recommend this.
Starting small enables you to get the basics implemented and begin to develop a sense of the value of data. You can create trends, breakdowns, retention charts, and more with just a single data point. Once you grasp this, it reveals other data points you'd like to include and you can build on what you've done.
2. Get user identification right
It's hard to retroactively change user data on large volumes of historical events, so it pays to nail user identification early.
To ensure you set up accurate user identification, start by understanding how user data works. In PostHog, user data — known as persons — is included in all events. With the JavaScript web library, users are anonymous until you identify them with a distinct ID. Other libraries and the API require a distinct ID for event capture.
Beyond this, it is important to:
- Use a unique distinct ID.
- Avoid using many different
distinct_idvalues for the same user. - On the frontend, call identify as soon as possible (on load or login).
- Reset on logout or when a user changes.
As an engineer, it is up to you to get user identification right. Everyone relying on behavioral analytics (both technical and not) will assume the data is right, and from our experience, this goes wrong more than you think. Double-check and test your identification code. To be even more careful, tie it to your authorization code.
Tip: For examples of what "right" looks like, check out our logic for identifying users, look for other examples of
posthog.identify()on GitHub, or integrate with an auth provider like PropelAuth.
3. Utilize session replay
Session replay is one of the fastest time-to-insight analytics tools you can set up. It's not just a tool of marketers and product managers. In fact, it's arguably more useful to engineers than anyone else.
Replays focus on the behavior of an individual user. This gives them a high density of information. It isn't only a single event or an aggregate of events, rather all of their behavior visualized as they do it. This reveals gaps between expected experience and reality.
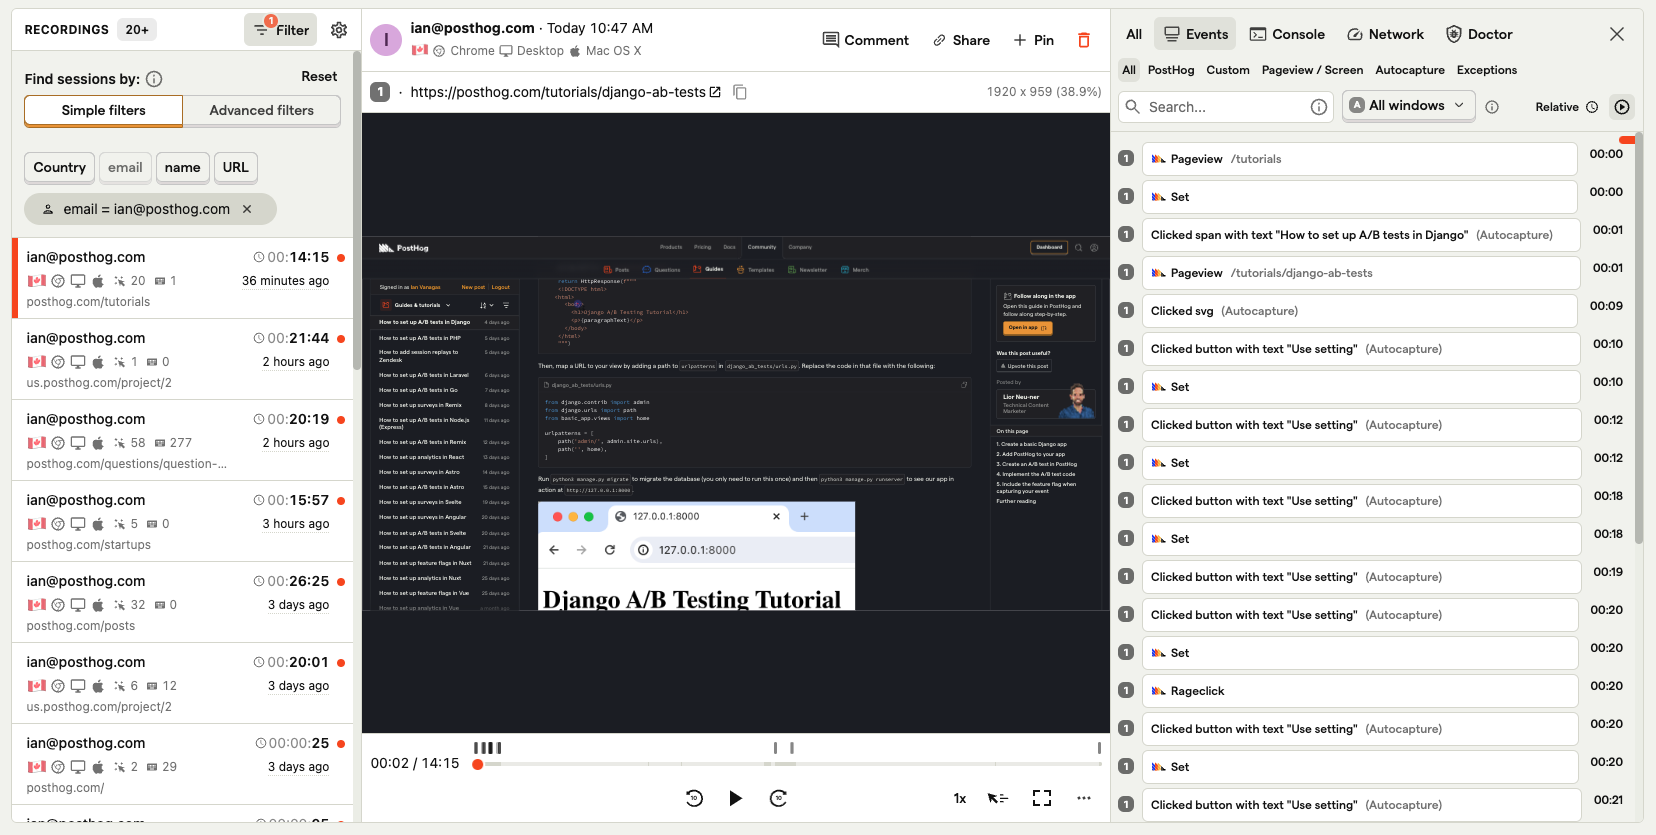
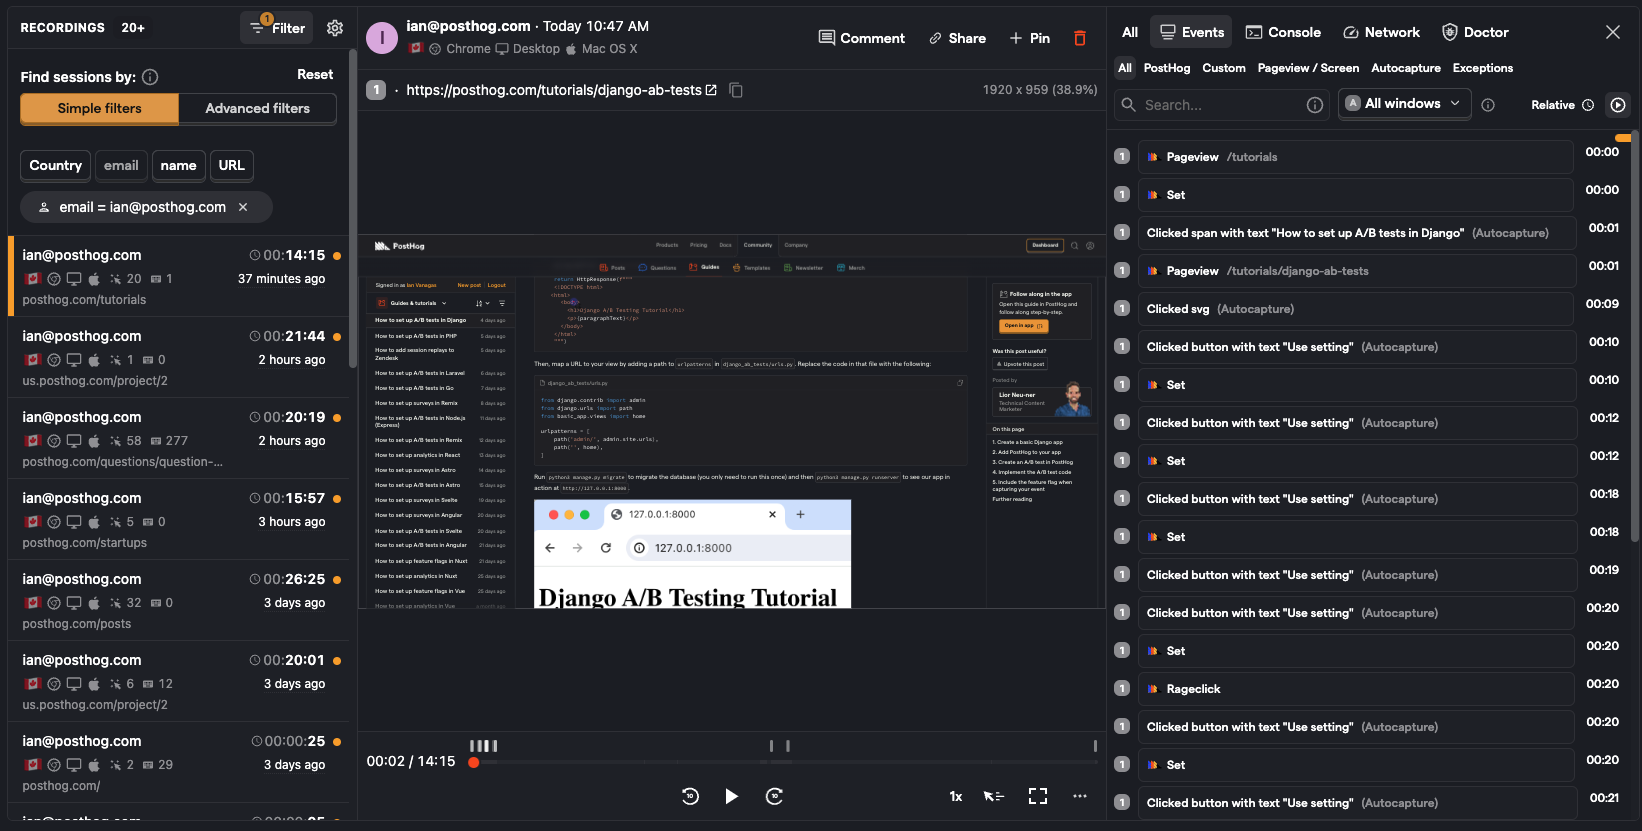
A unique benefit to engineers is that session replays are a great tool for debugging user issues. Instead of asking for information, you can see where the issue happened, its recreation, and get important context like person information, network performance, and console logs.
Tip: Add session replay links to your support tickets for easy access. We have a tutorial for how to do this with Zendesk.
4. Track releases and measure success
Analytics can be addictive, especially if it's heading in the right direction, but it's most powerful when monitoring new feature launches.
Whatever you build, users always find ways to break or use features in unintended ways. Behavioral analytics enables you to monitor launches, visualize if something unexpected is happening, and pinpoint potential areas needing fixes.
PostHog is an especially good tool for this because it combines behavioral analytics tools, such as product analytics and session replay, with developer tools like:
A/B testing to ensure the changes make a statistically significant impact on the behavioral metrics you care about.
Feature flags to target users based on properties and safely rollback features when data looks bad.
When you use either of these, you can easily filter insights, dashboards (including web analytics), and replays for users interacting with that feature.
Tip: Check out our guide on how we build features users love for more on tracking feature success.
5. Weave data into your decision-making
When writing about behavioral analytics, other guides tell you to use the data to "make better decisions." They just tell you to "analyze your data" but rarely provide details about where, when, and how.
We've already covered some, but here are three more ways:
Monitor your direction. Track metrics over the long term and make changes if heading in the wrong direction. Look at product health, product-market fit, and north star metrics. This helps you prioritize and tweak what you're focusing on. Dashboards are a great tool for this.
Dive deeper into hunches. If some area is underperforming, behavioral analytics can provide evidence. For example, you might get feedback saying onboarding is too complicated. You can research this by checking for behavior across the onboarding funnel and use those insights to test improvements. Notebooks are a great tool for this.
Fit functionality to user behavior. Behavioral analytics enables you to predict and plan for different scenarios. For example, what performance levels do you need to support? By understanding the average, minimum, and maximum use cases, you get more guidance on what you need your system to do and make better tradeoffs.
The use cases beyond these likely are beyond the scope of your work as an engineer. If you can use all of these, you likely grasp behavioral analytics better than 95% of engineers, and are well on your way to becoming a product engineer.
Further reading
- The 80/20 of early-stage startup analytics
- How successful startups use growth loops (with examples)
- How, when, and where to run your first A/B test
Subscribe to our newsletter
build mode
Read by 75,000+ founders and builders
We'll share your email with Substack
PostHog is the leading platform for building self-driving products. With a full suite of developer tools – AI observability, product analytics, session replay, feature flags, experiments, error tracking, logs, and more – PostHog captures all the context agents need to diagnose problems, uncover opportunities, and ship fixes. A data warehouse and CDP tie it all together, unifying that context into one source agents can read across. You can steer it all from Slack, the web app, the desktop (PostHog Desktop), or your own editor via the MCP.