


Calculating average session duration, time on site, and other session-based metrics

Contents
A session is a set of events grouped to capture a "single use" of your product. If you use the snippet, JavaScript Web SDK, or mobile SDKs, PostHog automatically groups events into sessions. We then provide multiple ways to analyze these sessions to get a fuller picture of how users are using your product, where they are spending their time, and more.
Analyzing sessions with web analytics
The easiest way to analyze session metrics is with web analytics. The web analytics dashboard shows you session metrics like:
- Unique session count
- Average session duration
- Bounce rate
You can use filters to get metrics for sessions that match the filters. For example, sessions that visit a specific page or come from a specific referrer.
Analyzing sessions with product analytics
Beyond the overview web analytics provides, PostHog's product analytics gives you more flexibility to calculate and visualize session metrics. PostHog includes many session properties you might find useful in your analysis like entry and exit URLs, UTMs, pageview count, autocapture count, screen count, web vital LCP score, and more.
Time on site
Time on site is another name for session duration. Although you can get this web analytics, you can visualize it in a trend.
To do this, first, create a new insight. Once created, choose pageview as your event, aggregate by property value average of session duration.
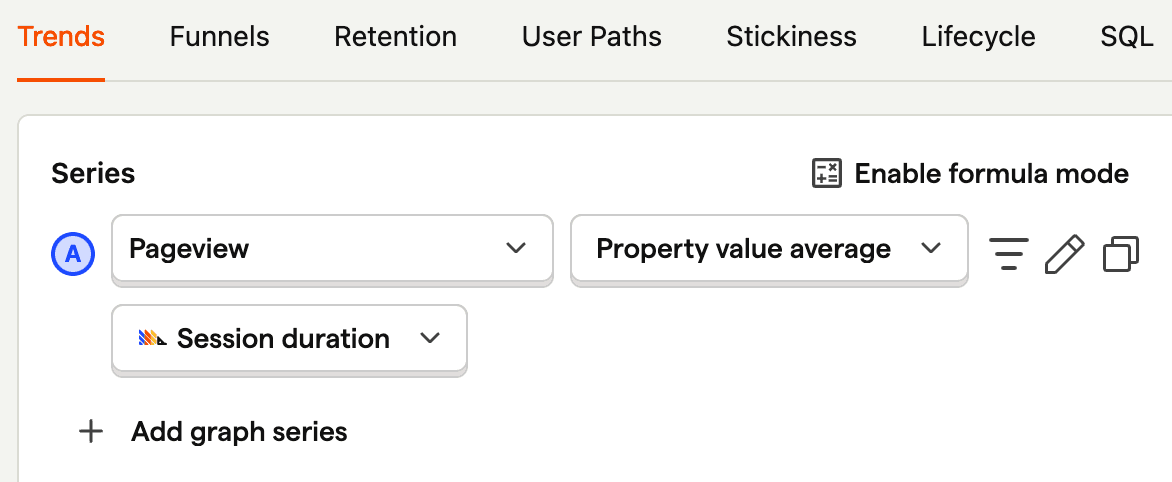
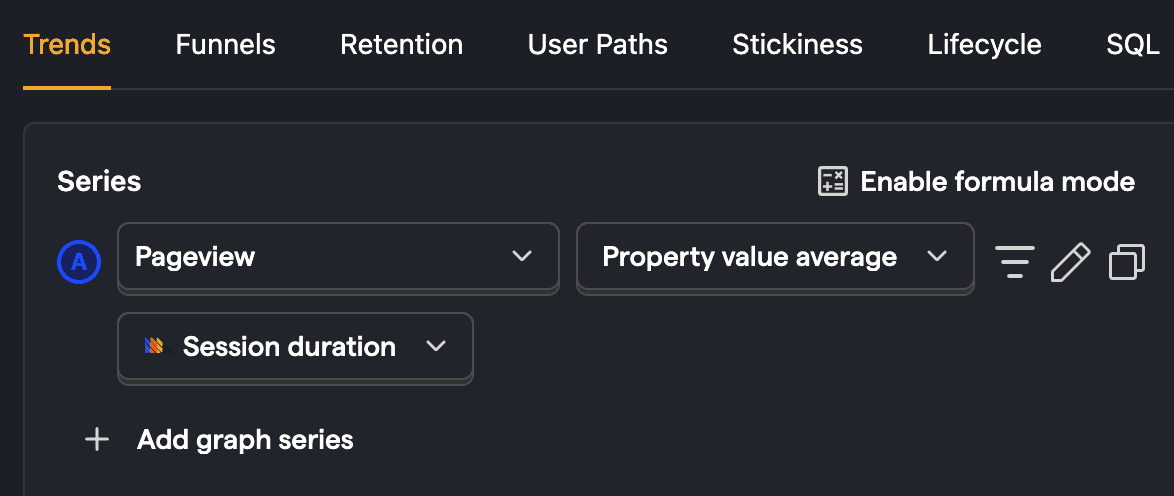
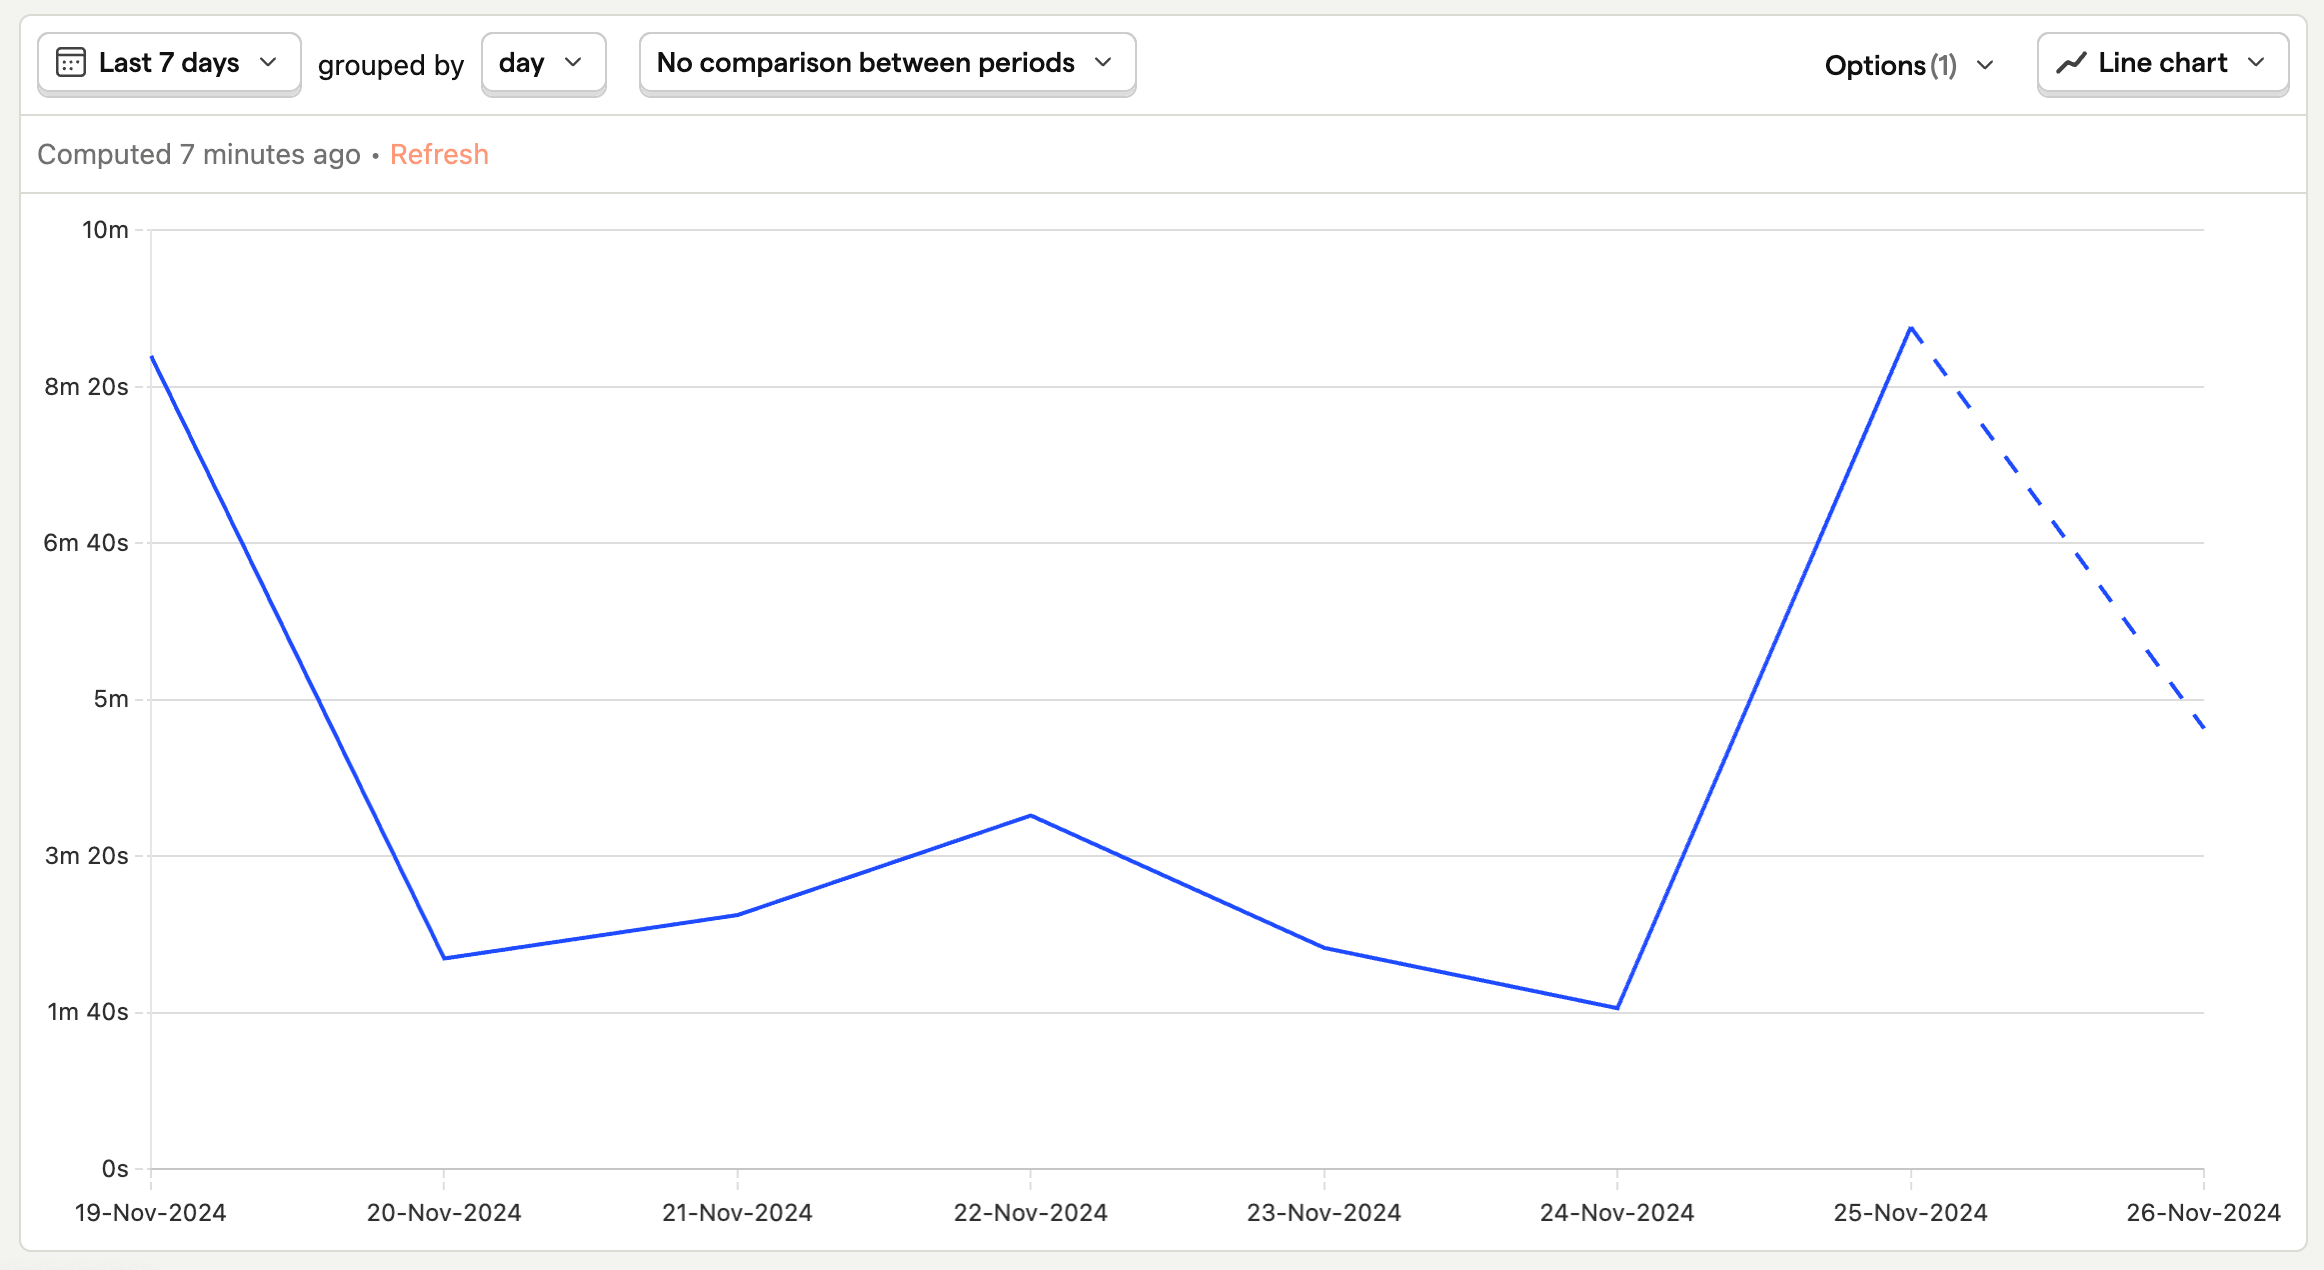
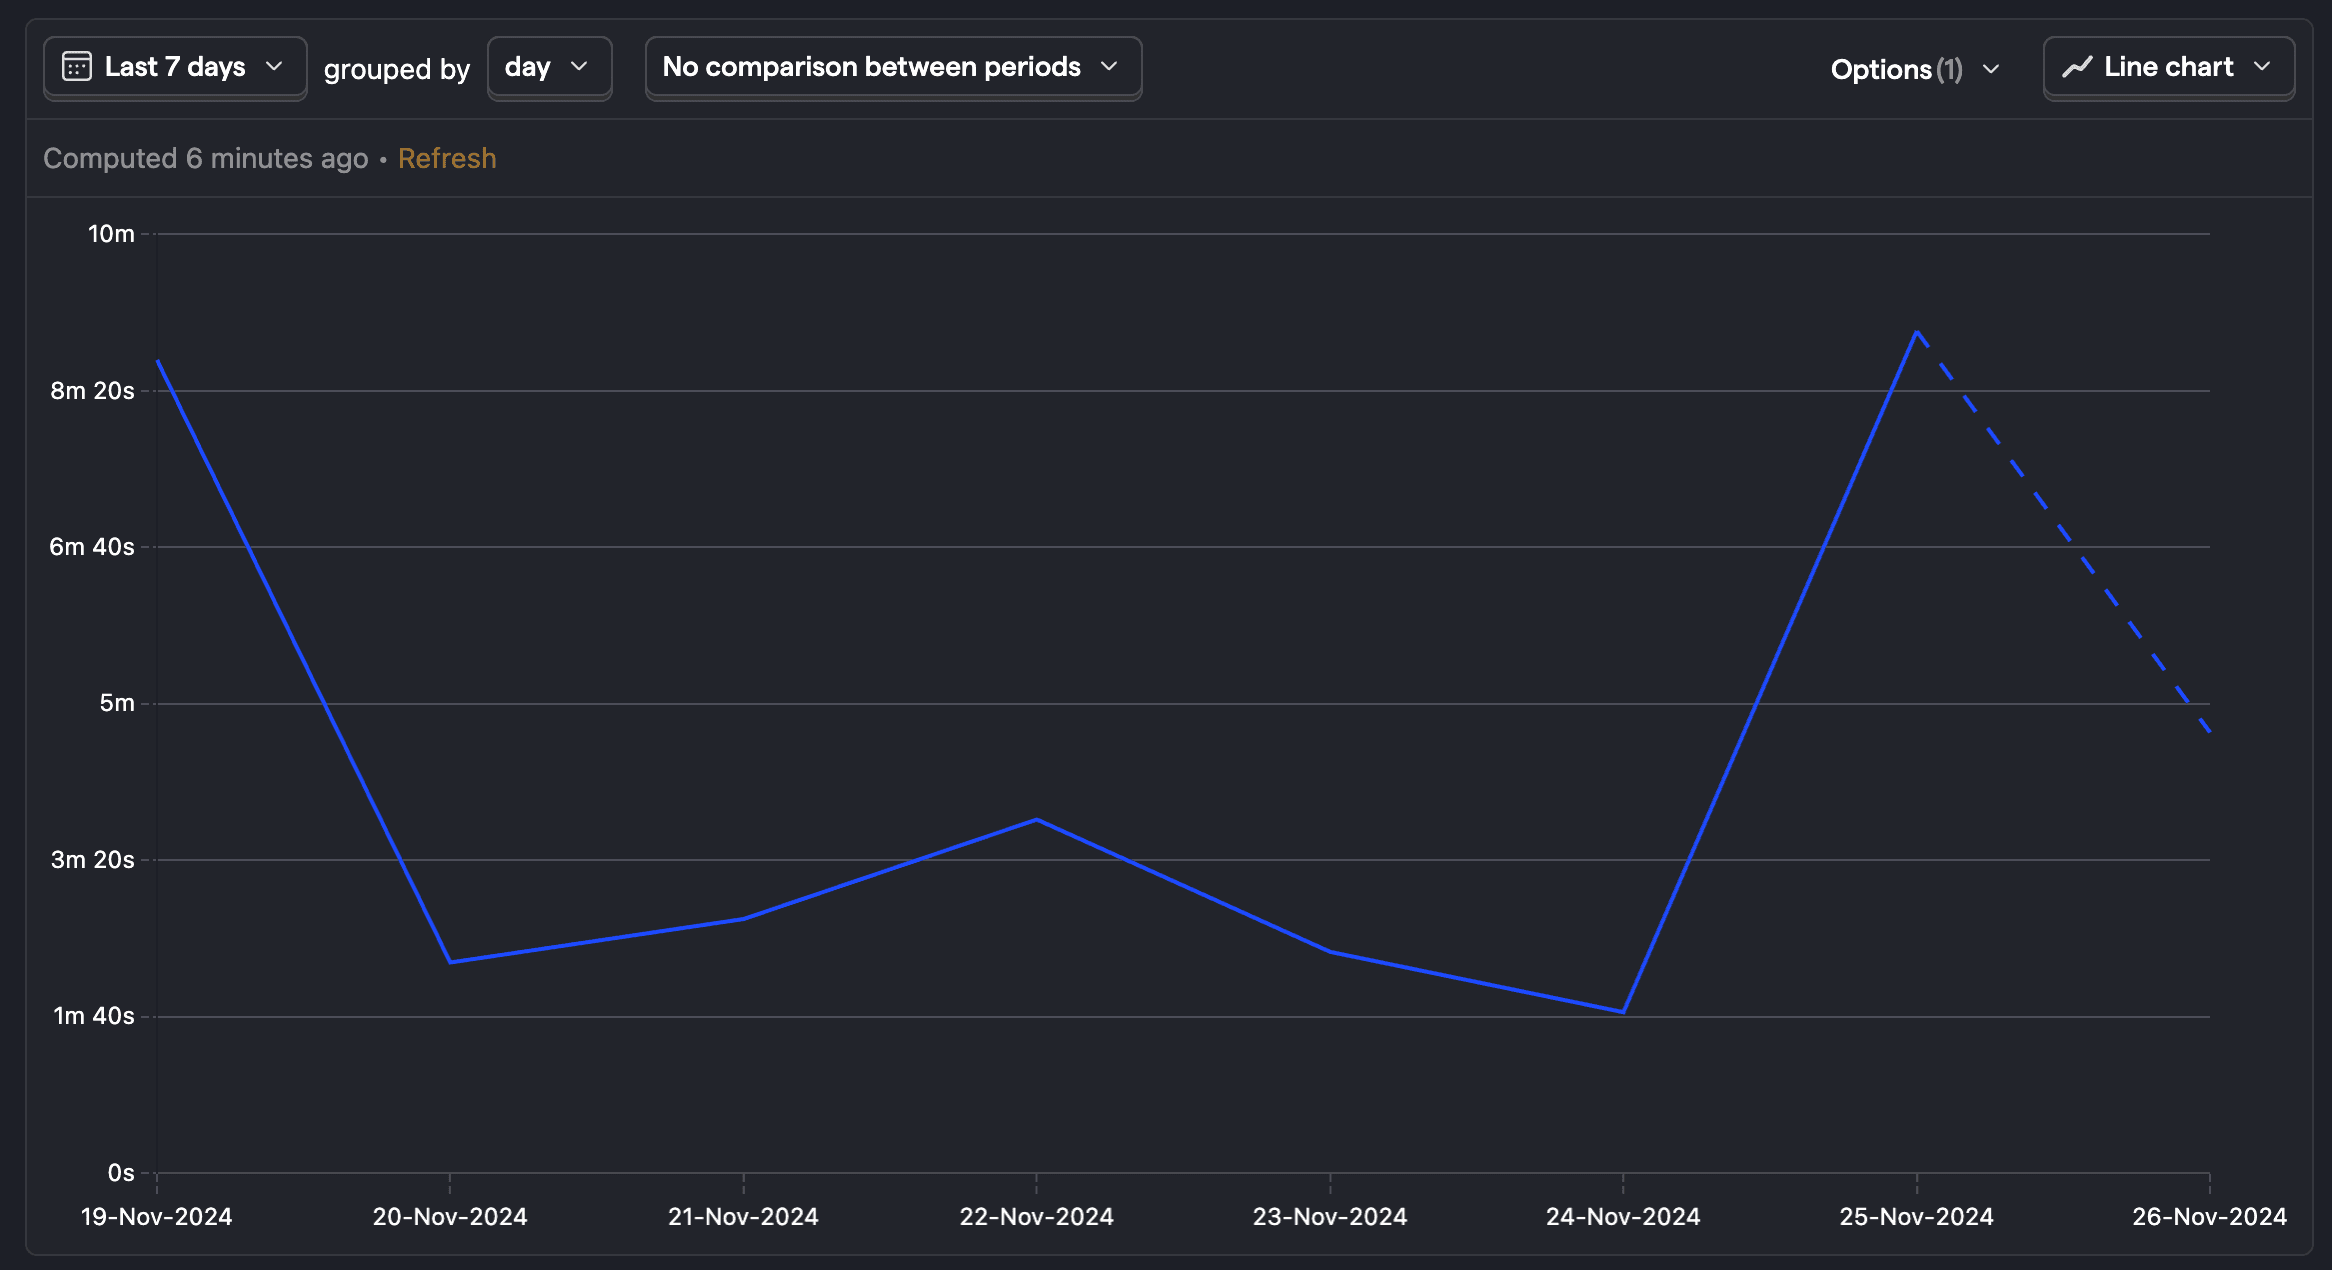
To create a trend of average session duration over time, choose your date range and set the Y-axis unit to Duration (s).
Calculating time on page: Calculating time on page is similar to calculating time on site, but it uses the previous pageview duration and previous pageview pathname properties. You can learn about this in our how to calculate time on page tutorial.
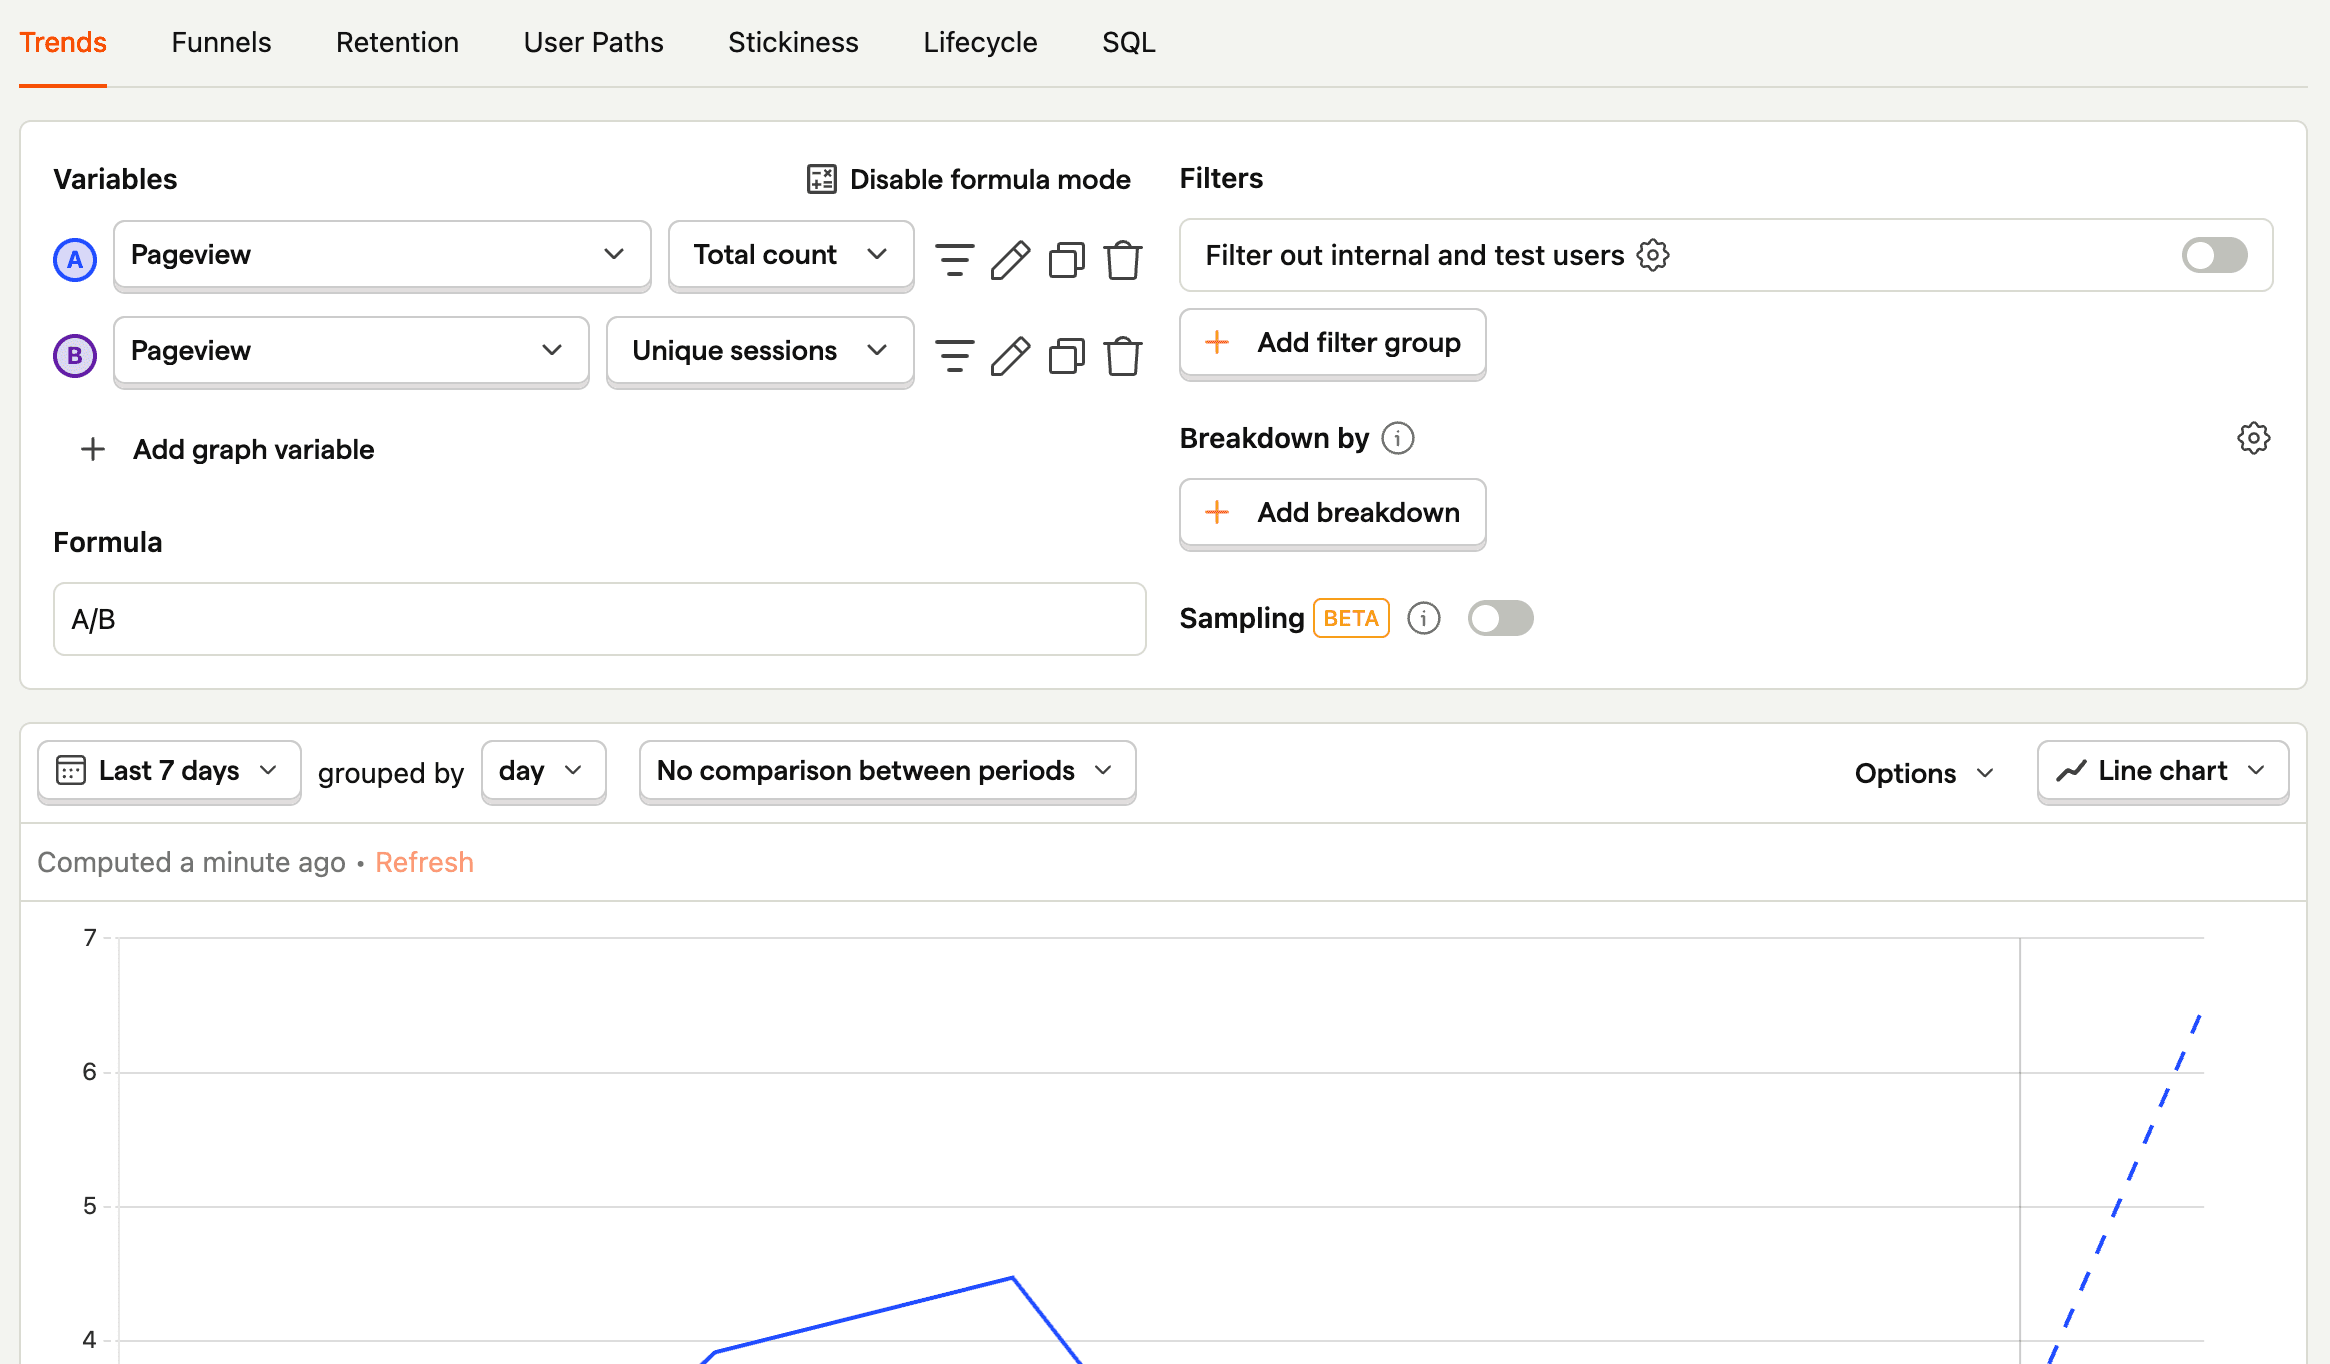
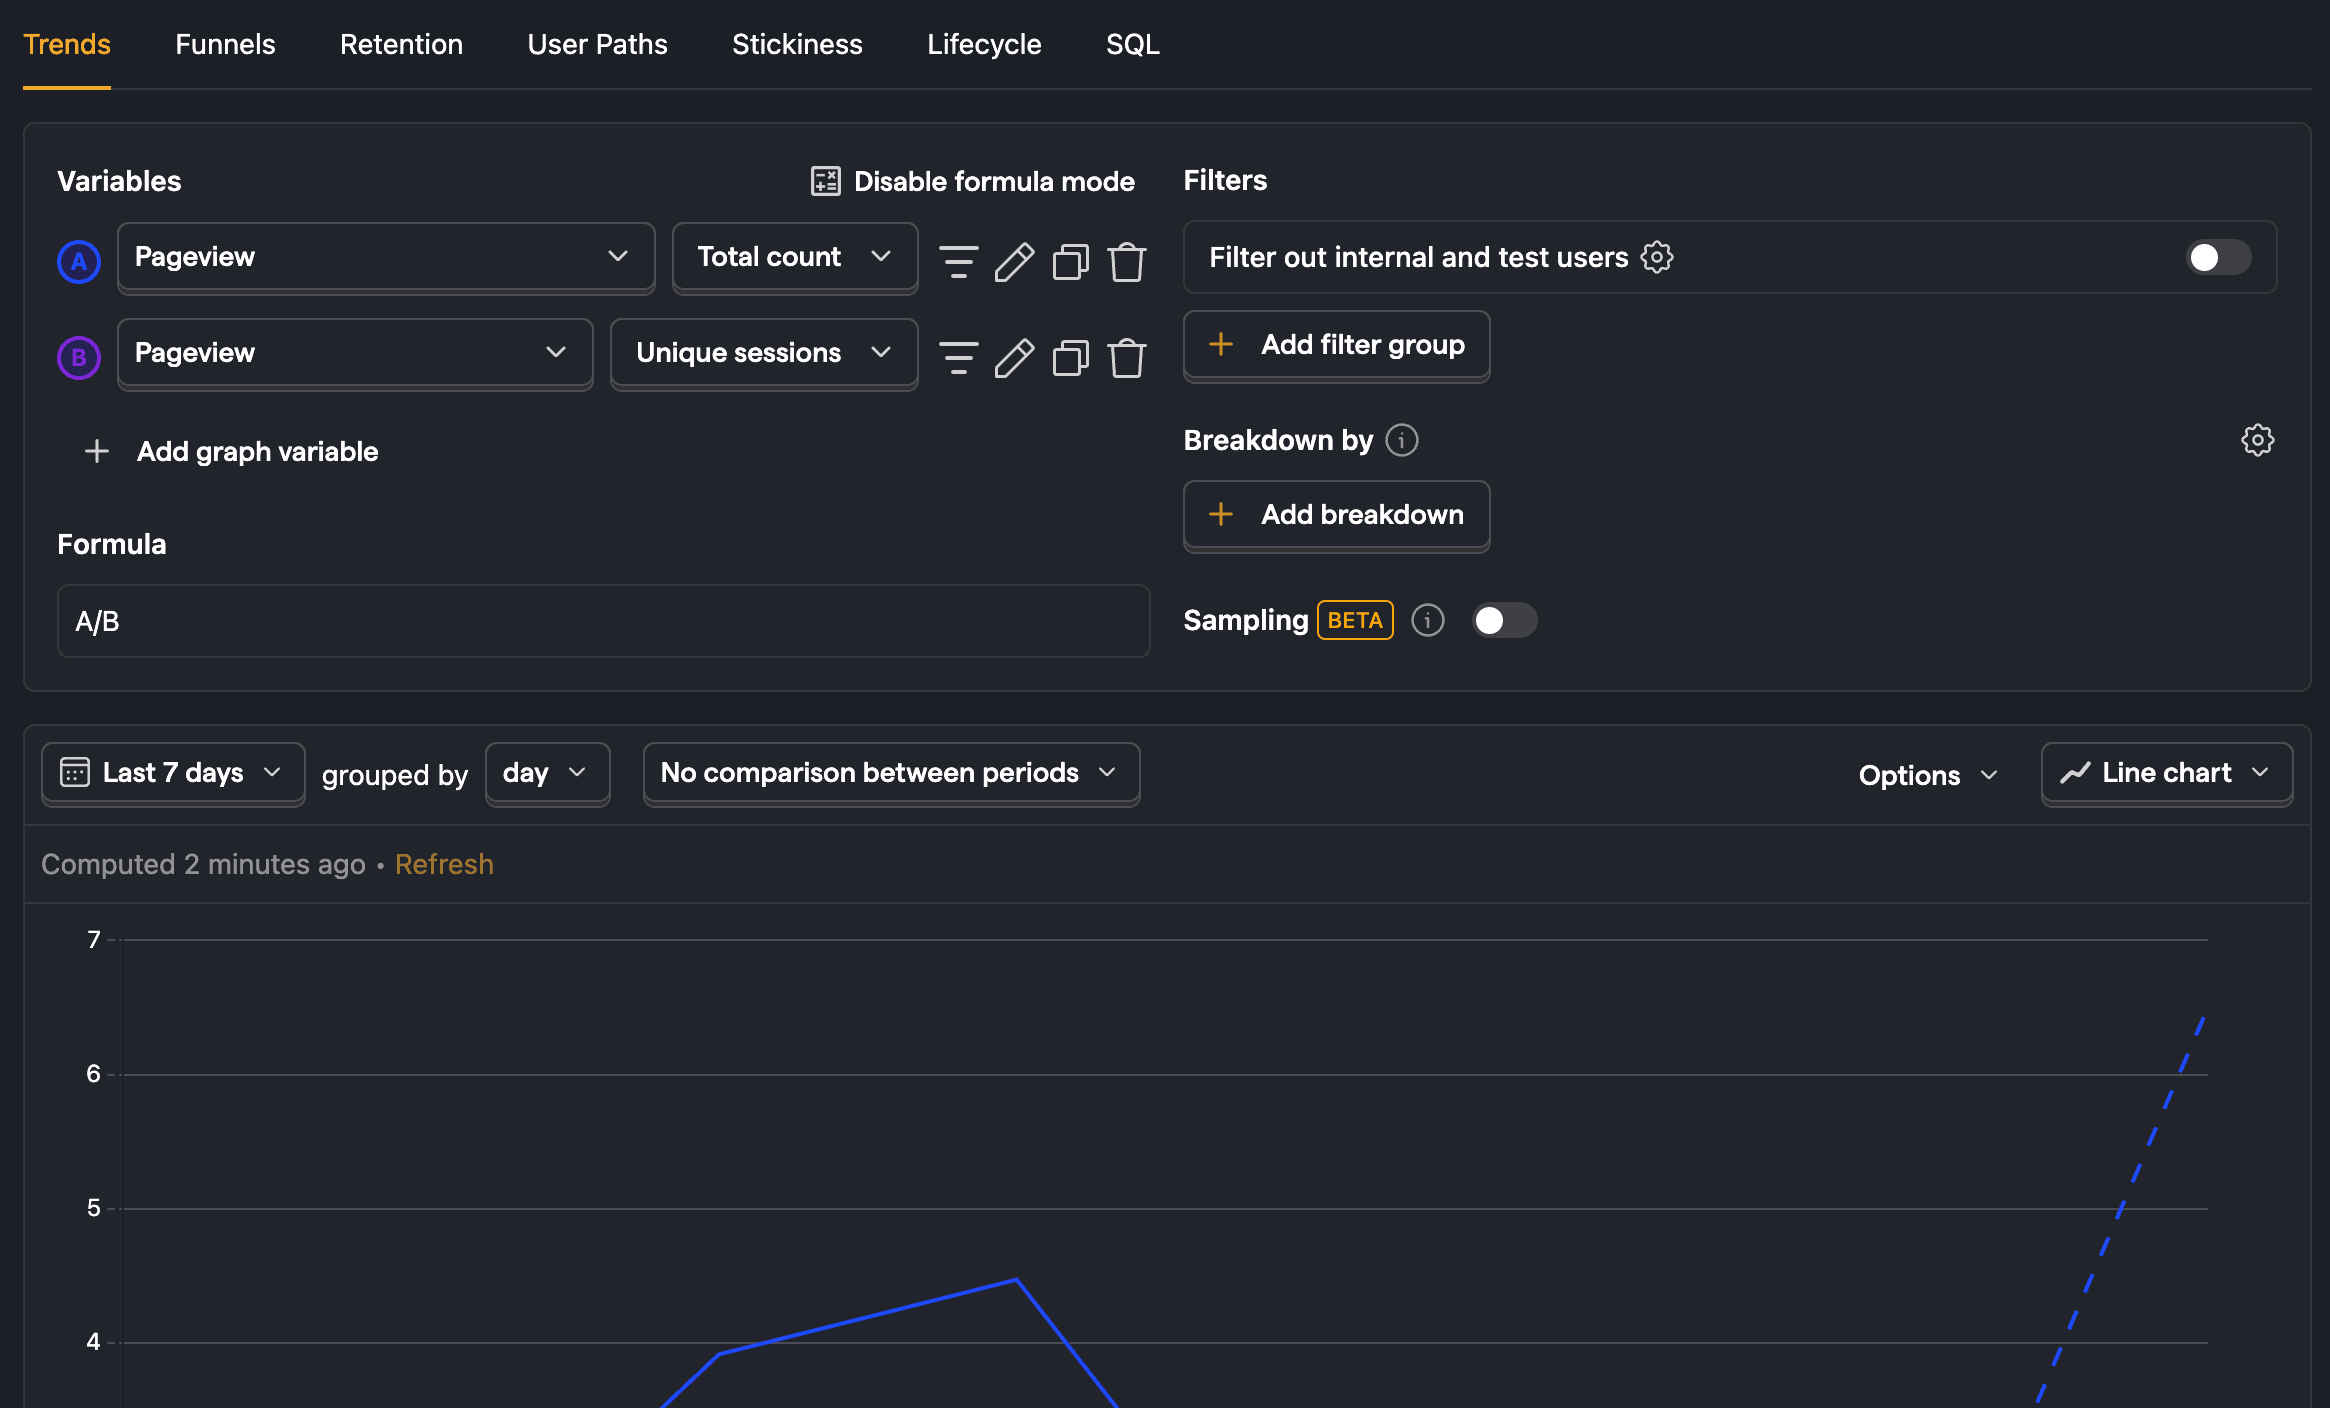
Average pages per session
Another metric we can calculate with product analytics is the average number of pages per session.
To do this, set up two trend series, one for total pageview count and a second for pageview unique sessions. You can then use the A/B formula to calculate the number of pages per session.
Tip: Be sure to set the Y-axis unit in your chart back to
None.
You can filter these series to provide details on sections and funnels on your site. Clicking on the charts will provide a list of the users included in that data. If there is a session replay available for that user session, there will be a link for you to go watch it.
Analyzing sessions with SQL
If trends don't give you the details you need, you can access the raw session data with SQL. It is located in the sessions table.
For example, to get the average number of unique URLs per session, you can create a new SQL insight and run the following query:
Connecting sessions to other data
A big use case for this is combining session data with other event data. Because events have $session_id property, we can use a JOIN to combine session data with event data.
For example, to get the non-pageview events for sessions with over 5 pageviews, you can run the following query:
Subscribe to our newsletter
build mode
Read by 75,000+ founders and builders
We'll share your email with Substack
PostHog is the leading platform for building self-driving products. With a full suite of developer tools – AI observability, product analytics, session replay, feature flags, experiments, error tracking, logs, and more – PostHog captures all the context agents need to diagnose problems, uncover opportunities, and ship fixes. A data warehouse and CDP tie it all together, unifying that context into one source agents can read across. You can steer it all from Slack, the web app, the desktop (PostHog Desktop), or your own editor via the MCP.