


How to calculate time on page

Contents
Understanding how users spend their time on your site helps you understand your site’s strengths and weaknesses. Calculating the time spent on a page is the key metric for doing this. In this tutorial, we show you how to calculate time on page and related metrics using PostHog.
With the development of web analytics, we began autocapturing more properties like $prev_pageview_duration and $prev_pageview_pathname that make calculating this a lot easier.
Calculating average time on page
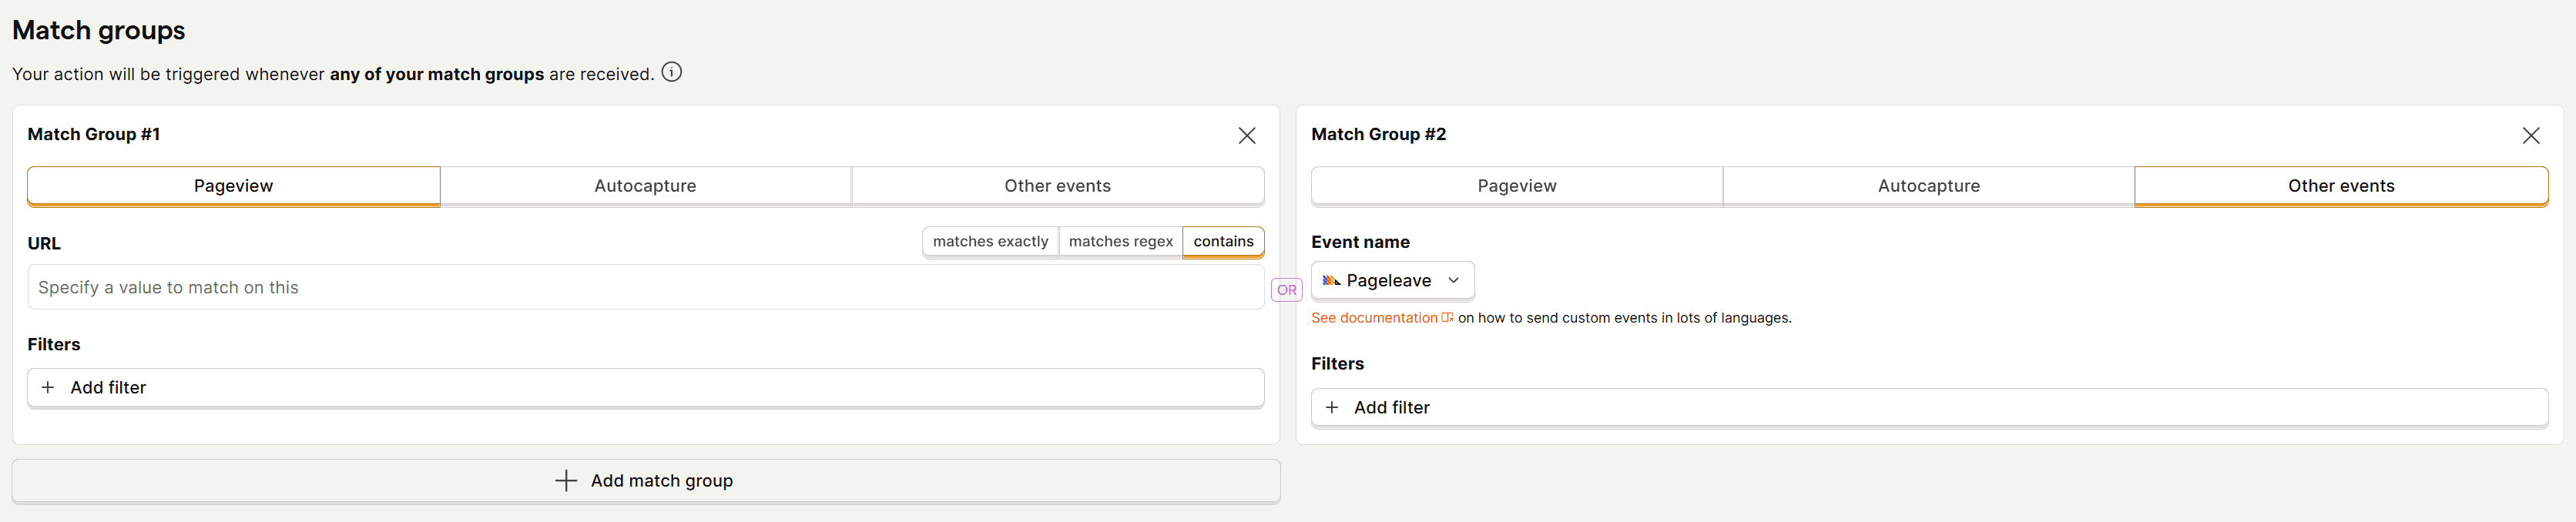
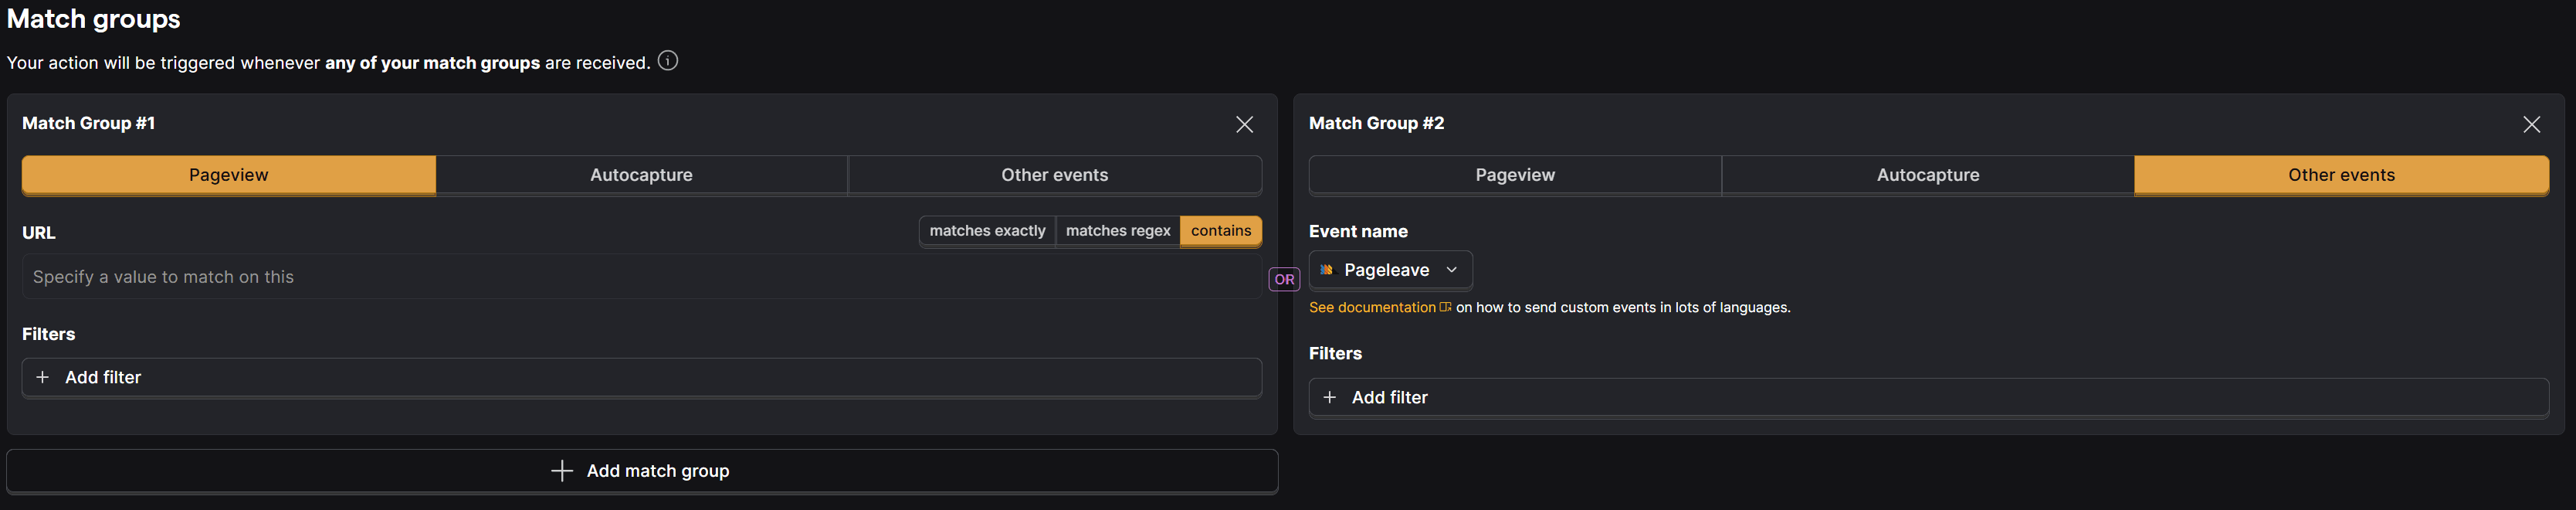
Before we dive into creating an insight we need to create an action to combine your $pageview and $pageleave events.
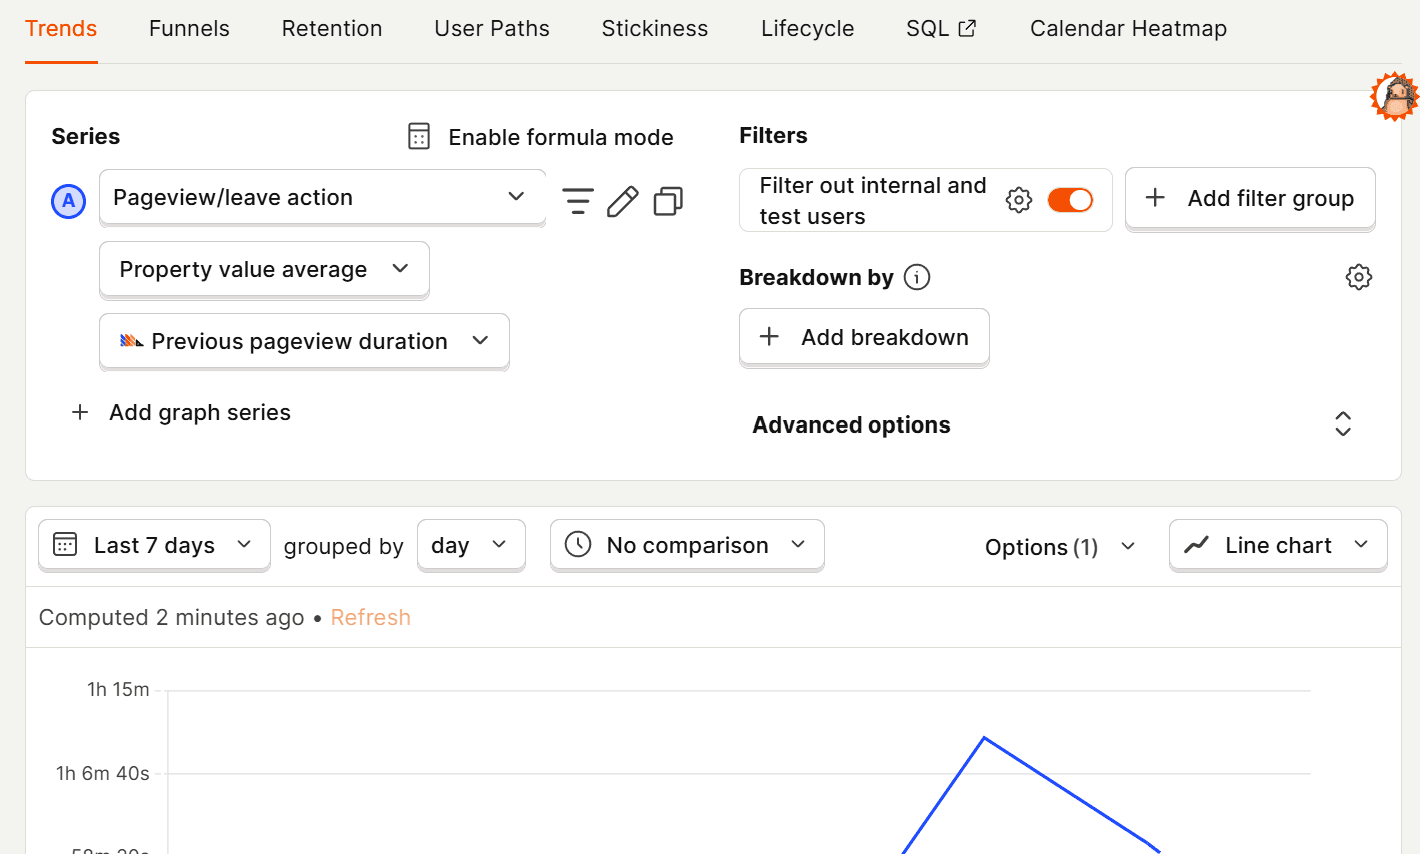
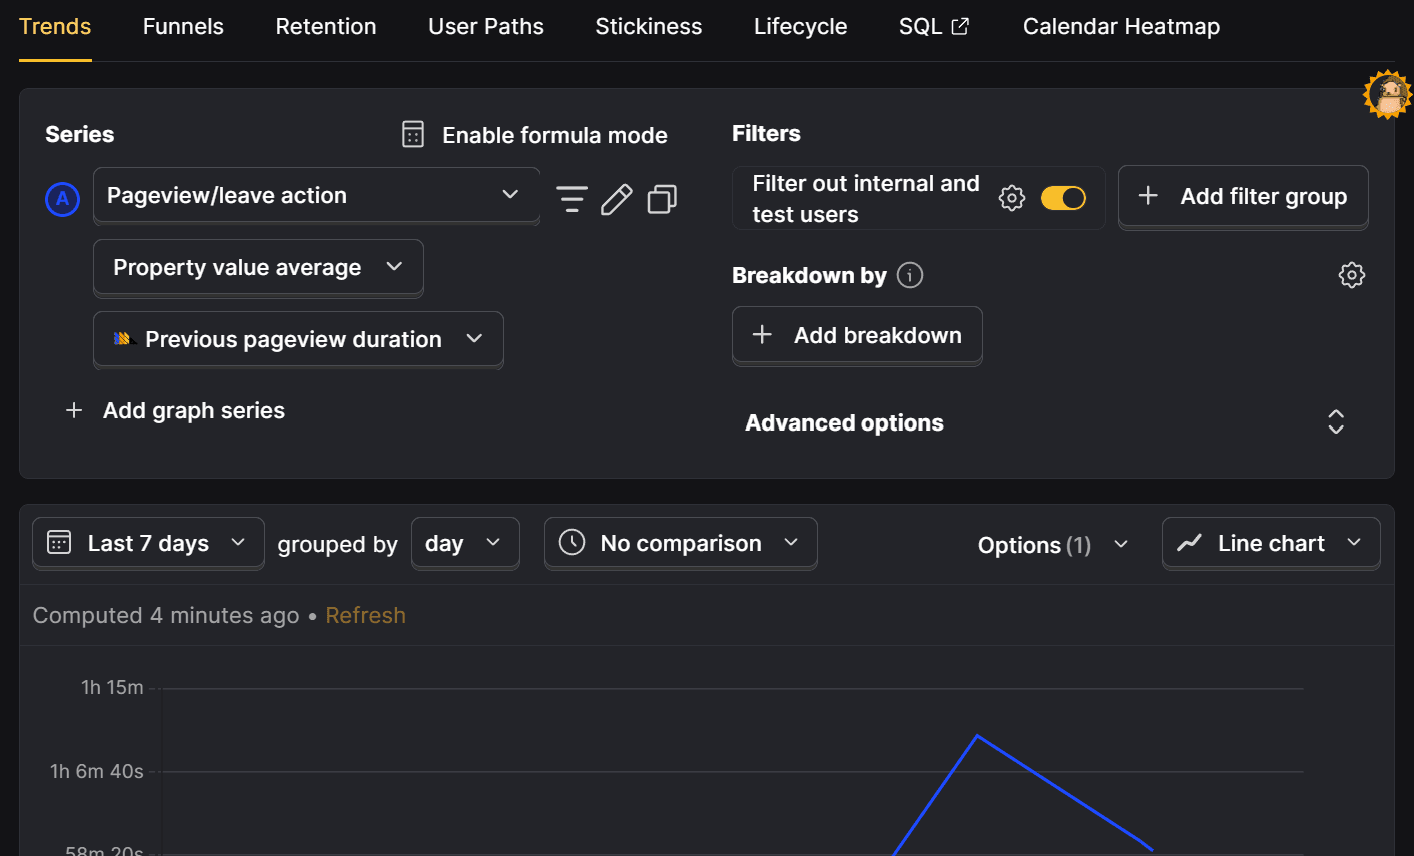
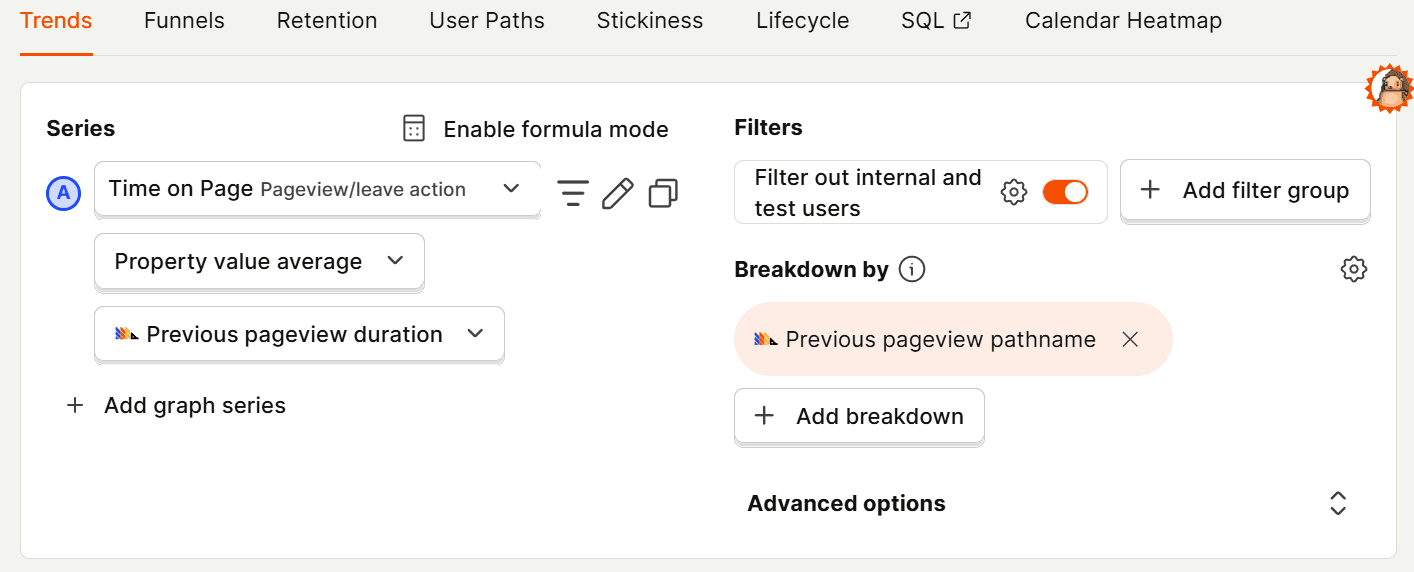
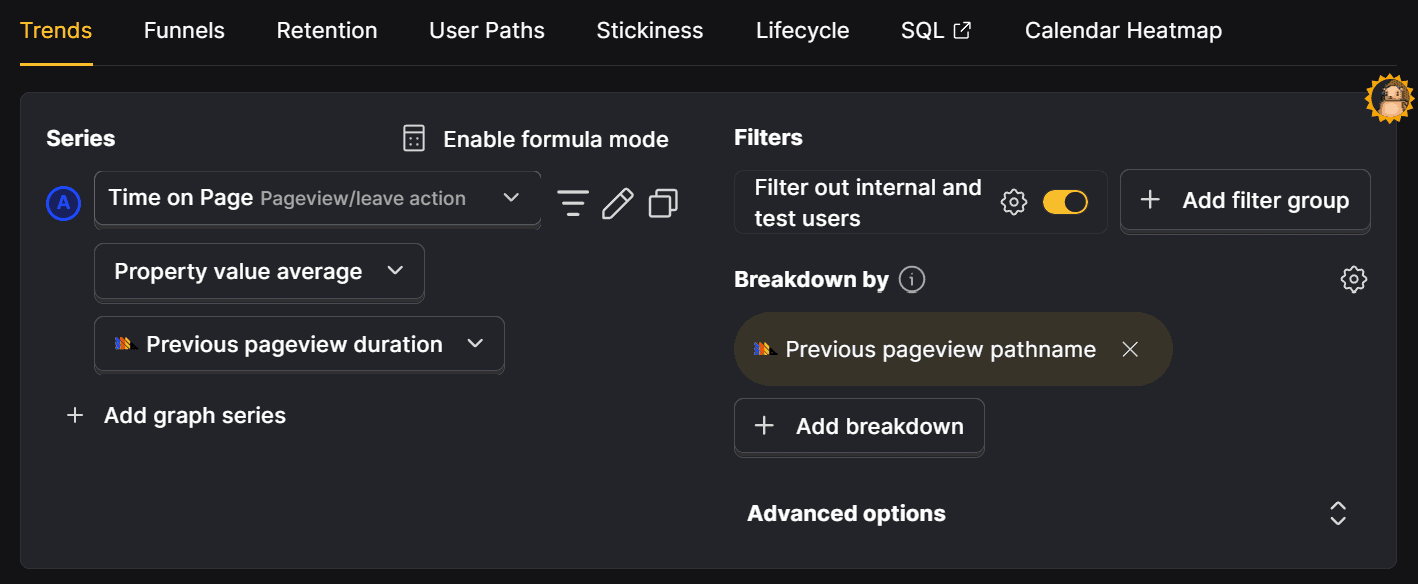
From there, we can calculate average time on page by creating a new trend insight, selecting your new action, aggregate by average property value, and select Previous pageview duration. In the visualization below, change the y-axis unit to Duration (s) and you get a graph of the average time on page over time.
Calculating time on page for specific pages
To get the average time on page for specific pages, we can start by breaking down our time on page by the pathname. On the same insight, click Add breakdown and select Previous pageview pathname.
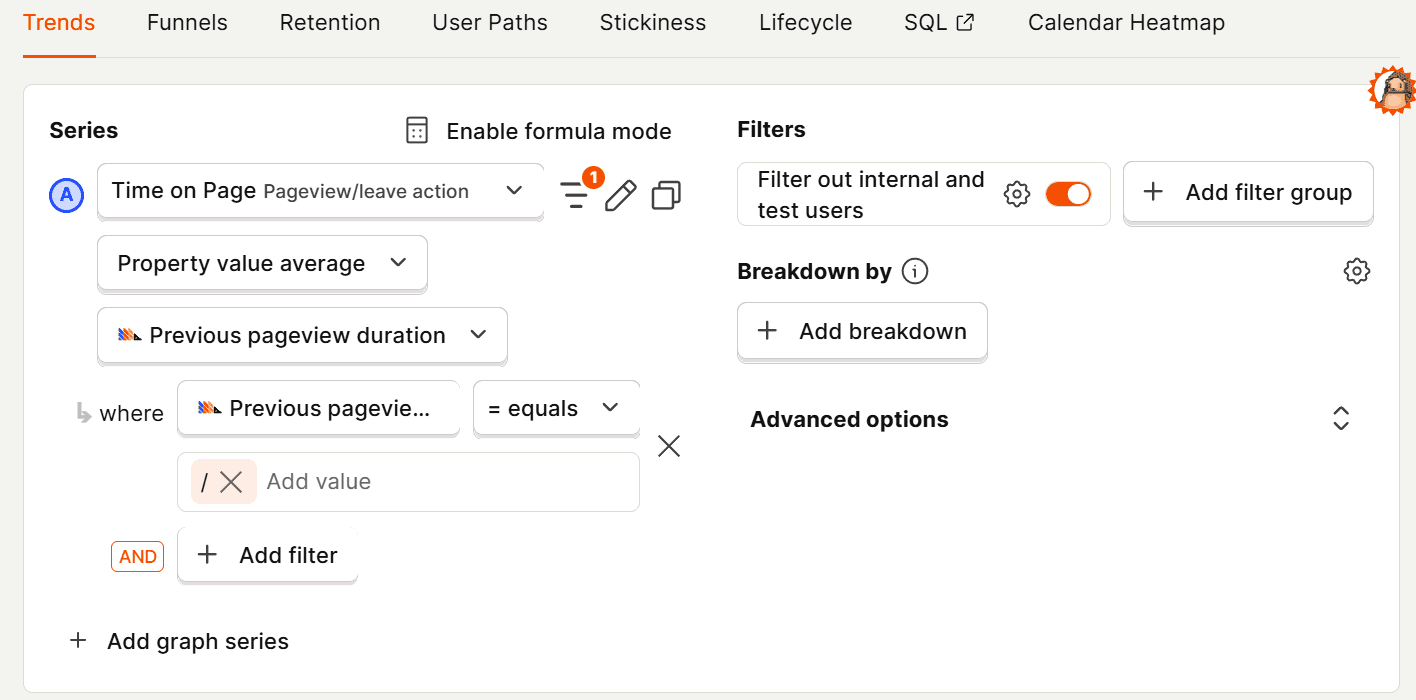
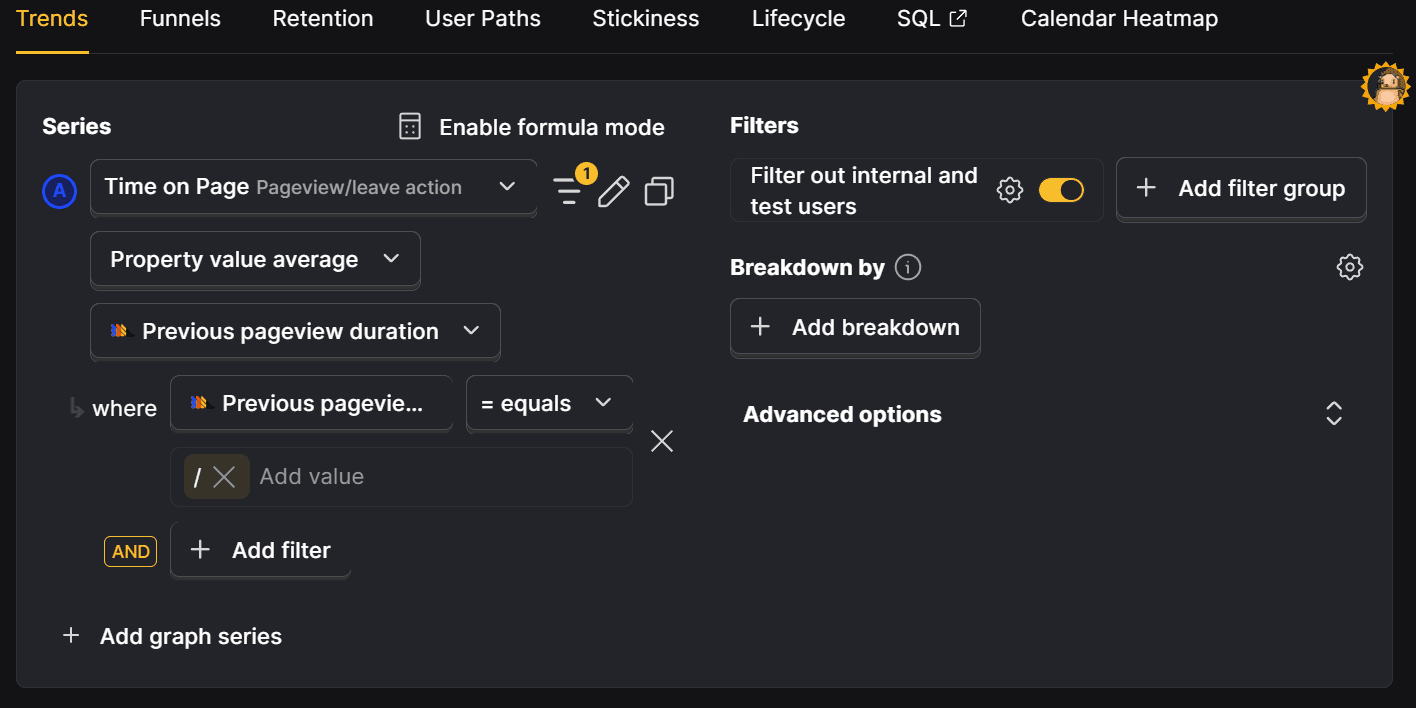
Doing this for your whole site might show many outliers. To limit this, you can add filters for previous pageview pathname or duration. This is also how you narrow in on a specific page to get its trend. For example, to get the average time on page for the homepage, remove the breakdown, and add a filter where Previous pageview pathname equals /.
Note: Although we use
$current_urlor$pathnamein many other places, you do not want to use it with$prev_pageview_duration. This would show the value for the current page alongside the time on page for the previous page which is misleading.
Diving deeper into time on page with SQL
Both the $prev_pageview_duration and $prev_pageview_pathname properties are available on events in PostHog's events table. This means we can use them in SQL queries like this:
Using SQL window functions
If you don't have the $prev_pageview_duration property, you can still calculate time on page. This requires:
- Getting
$pageviewand$pageleaveevents. - Using a
WINDOWfunction to get the next$pageviewor$pageleaveevent after the initial$pageviewevent. - Using a
dateDifffunction to get the difference between the initial timestamp and the subsequent event’s timestamp as the time on page for each pageview. - Average the time on page for all the pageviews.
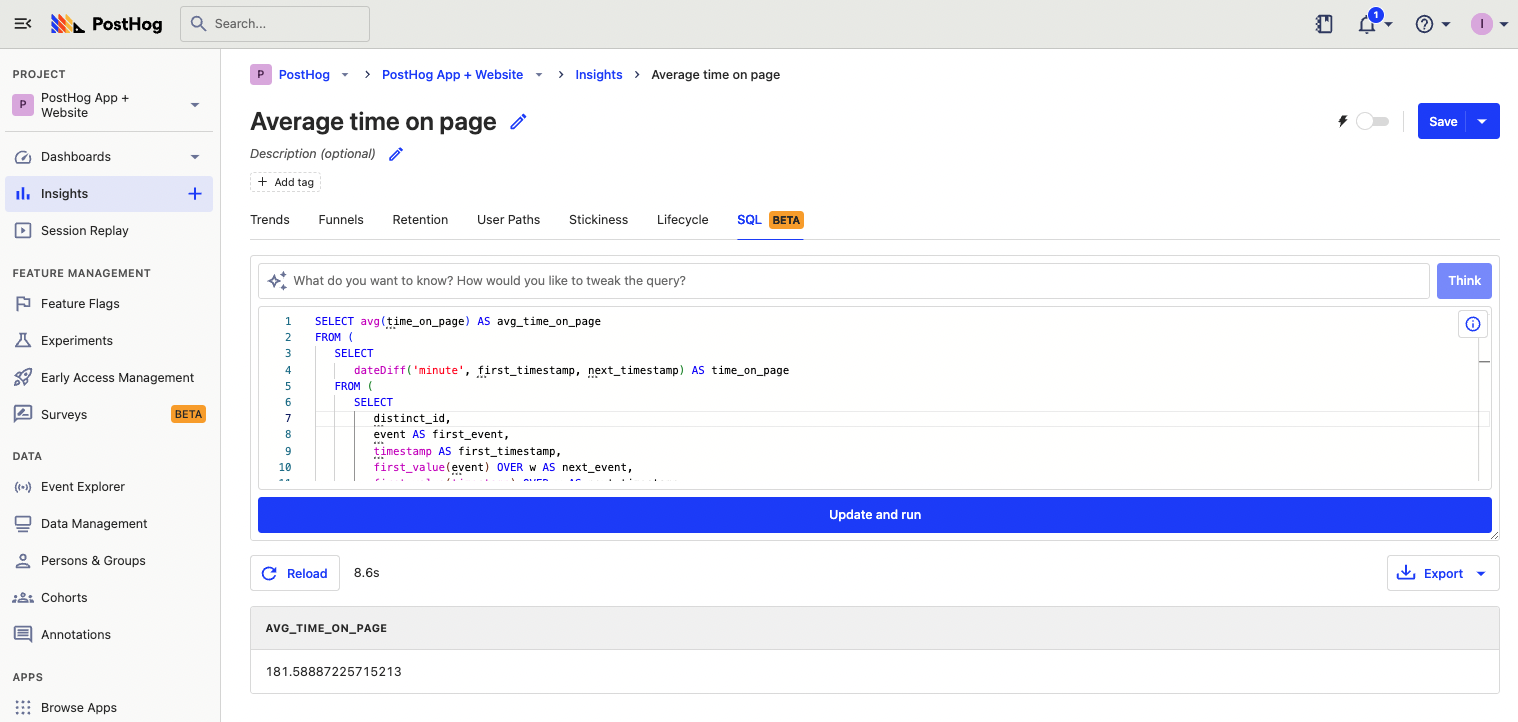
Altogether, this looks like this:
After running this query, you might notice that the result is very high. Industry averages range from 40 to 80 seconds, not the 180 minutes I got from PostHog’s data. This is because it includes situations where the subsequent event is months afterward.
We can limit this by filtering out time_on_page values that are greater than 30 minutes. These are likely inactive and separate sessions. Both PostHog and Google Analytics count a 30 minute gap as inactivity.
This gives us a reasonable value for the average time on page.
Calculating time on page for specific pages
We can use the same SQL window function method to get the average time on page for different pages on our site.
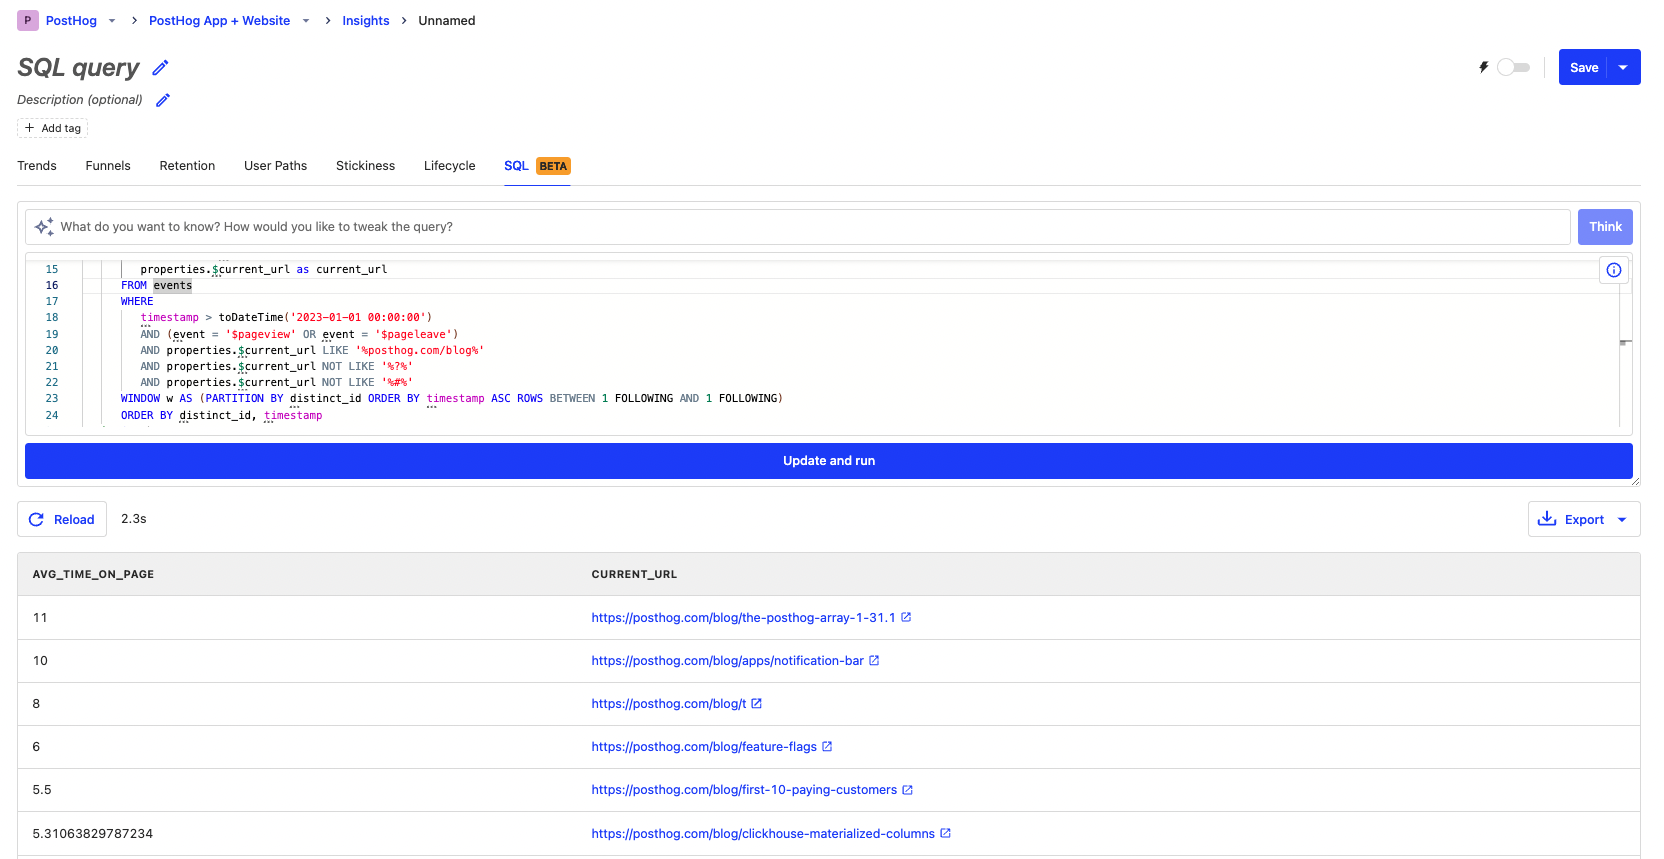
To do this, we select the properties.$current_url for our events, group by that value, and sort avg_time_on_page from largest to smallest.
If you have a high-traffic site with many unique URLs, you might have many unique pages with 30 minute average time_on_page values at the top of your list. To limit this and get more useful information, you can filter for pageview events from specific sections of your site.
For example, to get the time on site for blog pages we can add another filter for properties.$current_url LIKE '%posthog.com/blog%'.
One last thing you might want to filter out is URLs with question marks or number signs. To do this add the statements AND properties.$current_url NOT LIKE '%?%' and AND properties.$current_url NOT LIKE '%#%' below the properties.$current_url LIKE '%posthog.com/blog%' filter. This cleans the URLs.
Time on page for an individual page
We can get the time on page for an individual page by filtering for events where the properties.$current_url equals the page you’re interested in. For example, to get the time on page for our session metrics tutorial, we can filter for events where properties.$current_url = 'https://posthog.com/tutorials/session-metrics'.
If you want to see a list of events and user distinct IDs that make up that value, you can remove the average time on page calculation, show distinct IDs, and sort by time_on_page.
Further reading
- Calculating average session duration, time on site, and other session-based metrics
- How to do time-based breakdowns (hour, minute, real time)
- Using SQL for advanced time and date filters

Subscribe to our newsletter
build mode
Read by 75,000+ founders and builders
We'll share your email with Substack
PostHog is the leading platform for building self-driving products. With a full suite of developer tools – AI observability, product analytics, session replay, feature flags, experiments, error tracking, logs, and more – PostHog captures all the context agents need to diagnose problems, uncover opportunities, and ship fixes. A data warehouse and CDP tie it all together, unifying that context into one source agents can read across. You can steer it all from Slack, the web app, the desktop (PostHog Code), or your own editor via the MCP.