


How to set up embedded analytics

Contents
If you're building a B2B2C product, your users might want analytics about their users. You can provide this with embedded analytics (AKA customer-facing analytics), events you capture and then display for them.
This tutorial shows you how to set up embedded analytics by creating a basic Next.js app with PostHog, querying analytics data via PostHog's queries API, and then displaying it with Recharts.
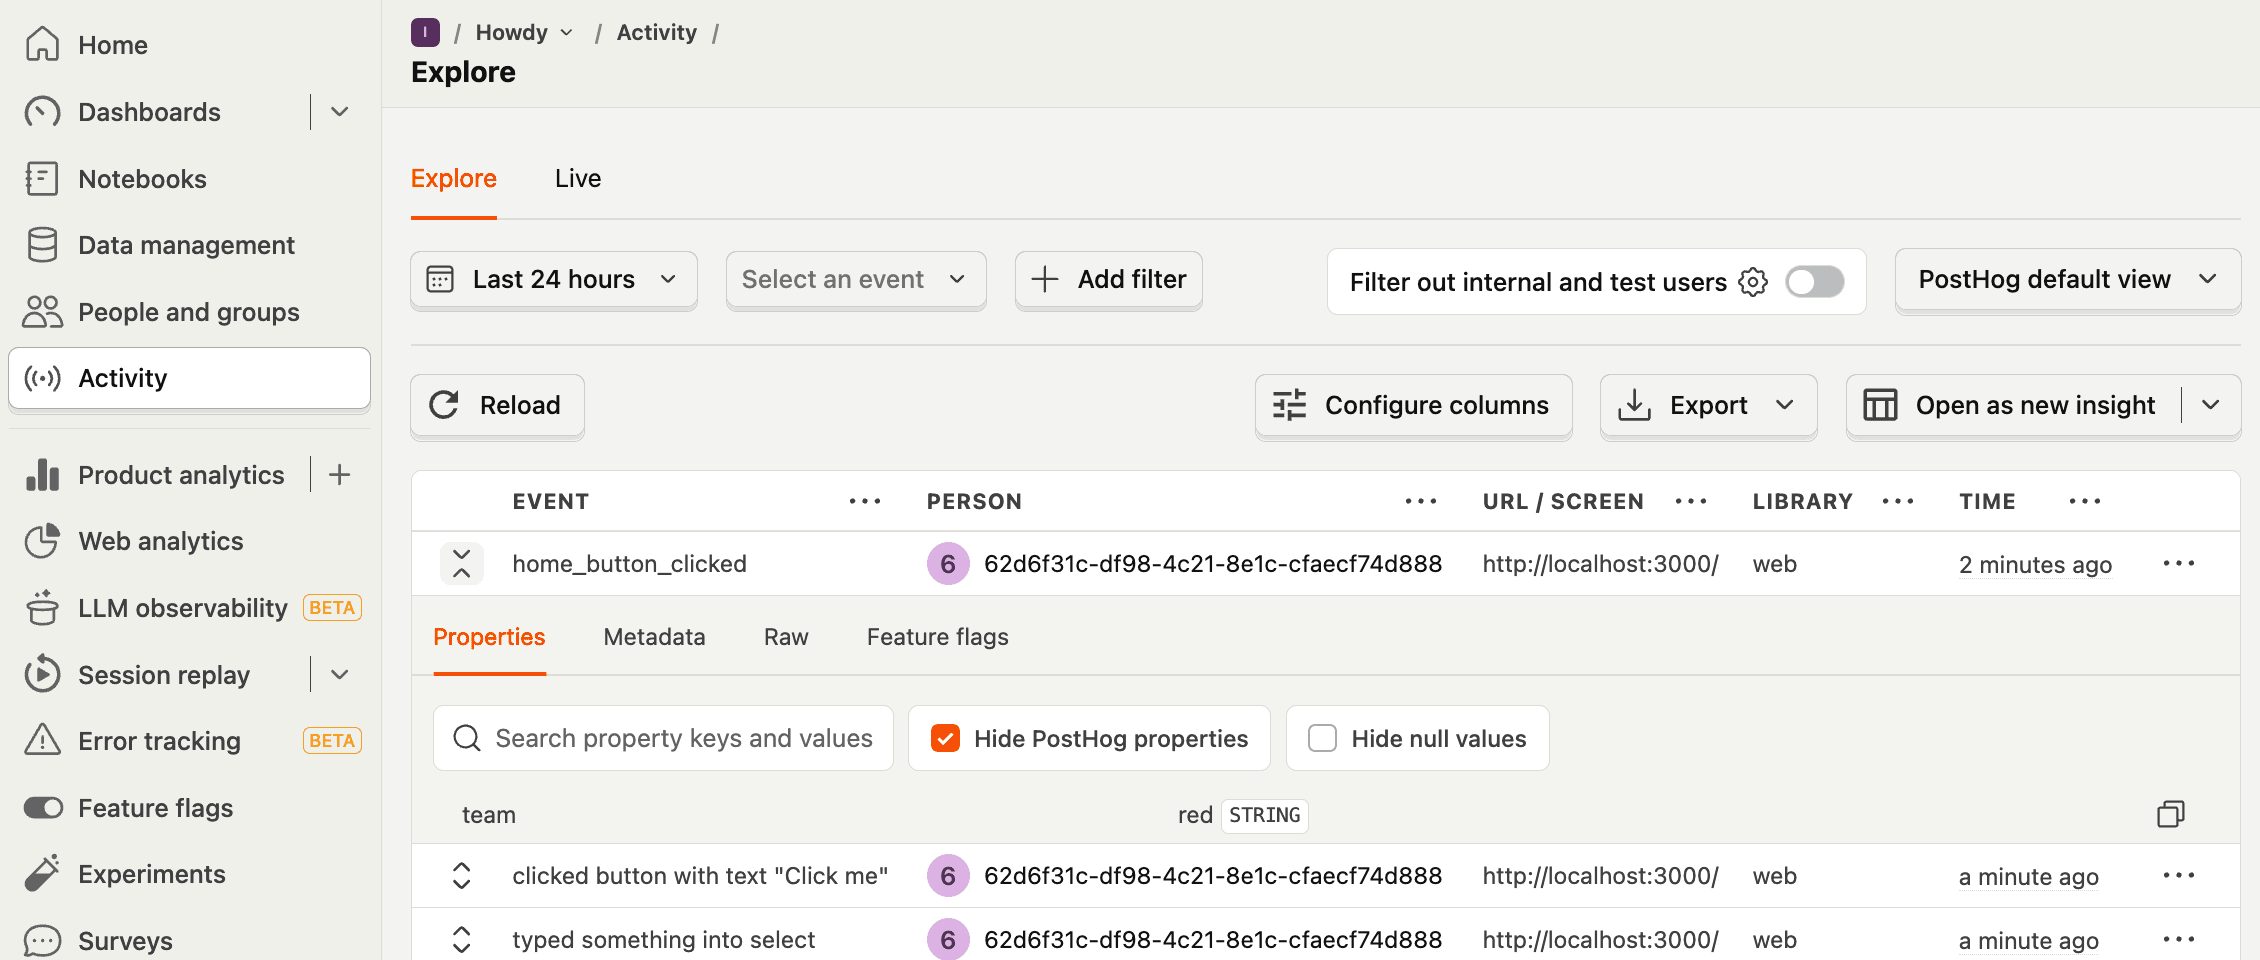
Note: In this tutorial, we include a
nameparameter with each query. This makes it easier to identify and debug queries in the query log, which is especially useful when building customer-facing analytics.
Creating a Next.js app
First, ensure Node.js is installed (version 18.0 or newer) then run the following to create a new Next.js app. Say yes to TypeScript, yes to Tailwind, yes to app router, and the defaults for all the other options.
We’ll then update page.tsx to an input to select between two “teams” and a button. We’ll use this to capture data later.
Setting up PostHog
To capture analytics for our app, start by installing posthog-js:
Afterwards, create an instrumentation-client.ts file at the base of your project and set up a PostHog initialization in it using your project token and host from your project settings.
To use it, import PostHog in page.tsx and capture a home_button_clicked event like this:
You can then run npm run dev to see the app in action. PostHog will autocapture events and clicking the button will capture a home_button_clicked event with a team property.
Querying data from PostHog for our embedded analytics
Now that we have data being captured, we can set up our queries to get this data from PostHog. We’ll create two:
- A trend of pageviews
- A count of button clicks that depends on each team
This starts by creating API routes in our app to make both PostHog queries. In our app folder, we’ll create a new api folder, then create pageviews and button-clicks folders inside that, and then a route.ts file inside each of those.
Setting up our pageviews query
In /api/pageviews/route.ts, we start by setting our host URL and project ID, both of which you can get from the URL of your PostHog instance.
It also requires a personal API key with project query read permissions. You can set this up in your user settings.
We then use these to set up a request to PostHog’s query endpoint with an SQL query to get pageviews for the last 7 days. Together, this looks like this:
Setting up our button clicks query
In /api/button-clicks/route.ts, we’ll add a similar API request to get button clicks. The difference is that it takes a variable for the team we use to get the button clicks for that specific team.
Triggering analytics queries
The last piece here is triggering these queries and showing the data to the frontend.
To do this, we will create a new analytics folder inside the app directory. In it, we’ll create a page.tsx file. This page makes requests to both the /api/pageviews and /api/button-click routes and displays the returned data.
It also formats the pageview data for use in a trend and lets people choose between red and blue team button click stats. Altogether, this looks like this:
When we run npm run dev again and go to http://localhost:3000/analytics, we’ll see our pageview and button click data from PostHog.
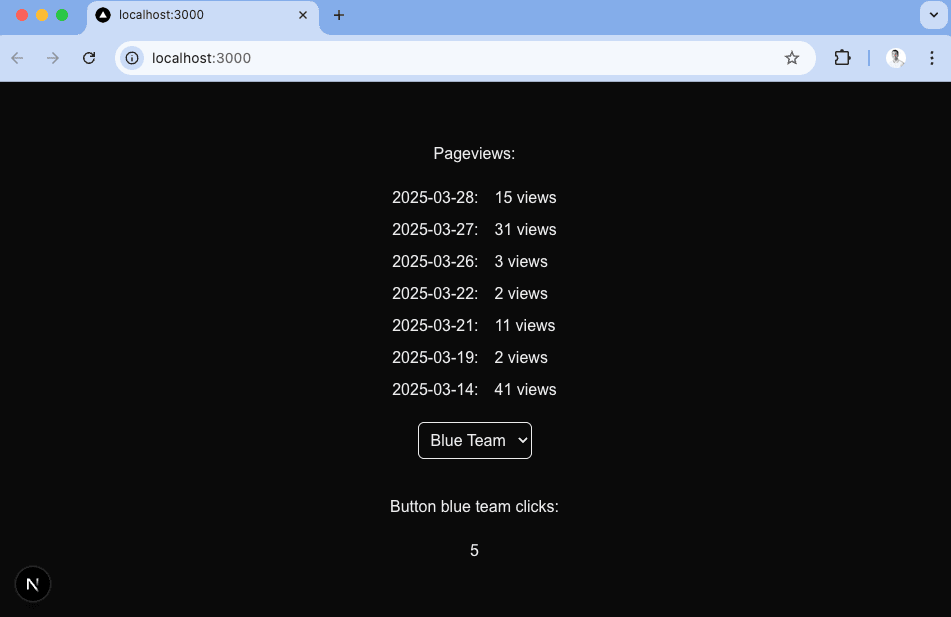
Toggling between the two team’s button clicks gives you an idea of how you can segment embedded analytics for multiple teams or users.
The next problem we need to solve: making the pageview data look better. We’ll set up better visuals in the next step with Recharts.
Setting up Recharts to visualize PostHog data
The simplest way to visualize our data is with Recharts, but you could also use a library like shadcn or Tremor. To start with Recharts, install it:
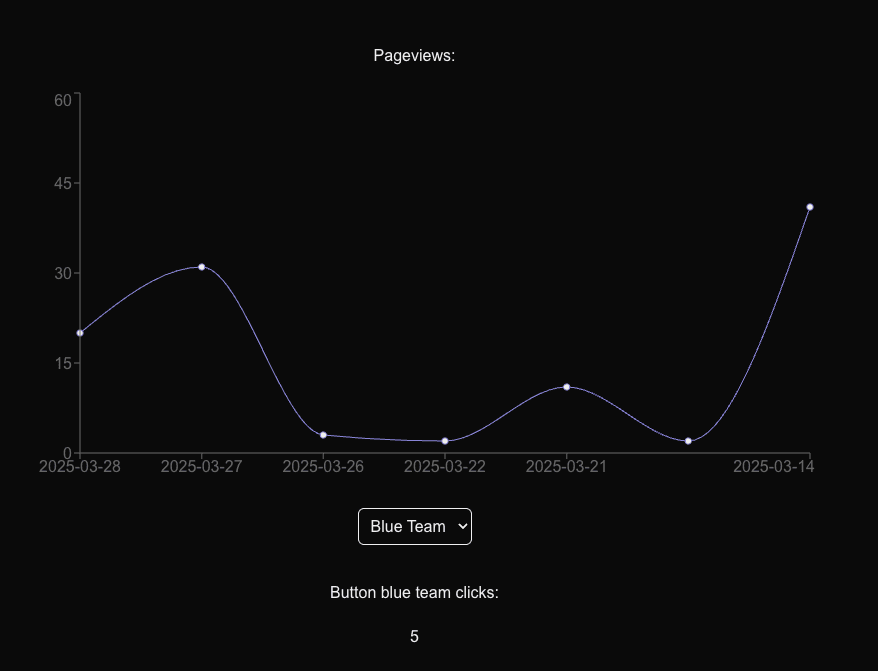
Next, in app/analytics/page.tsx, we’ll import the components needed for a line chart and set it up with our formatted pageview data like this:
This creates a simple (and much nicer looking) final visualization for our pageview data.
Using a materialized view to improve performance
Although these queries are simple and fast, more complex queries you add later may be slower. To improve performance and keep queries as fast as possible, you can use a materialized view.
We can show this off by materializing our pageview query. To do this, go to the SQL editor in PostHog and enter your pageview query:
Select the Materialization tab below the query and click Save and materialize. Give your view a name like mat_embedded_pageviews, press Submit, and then the materialization will start.
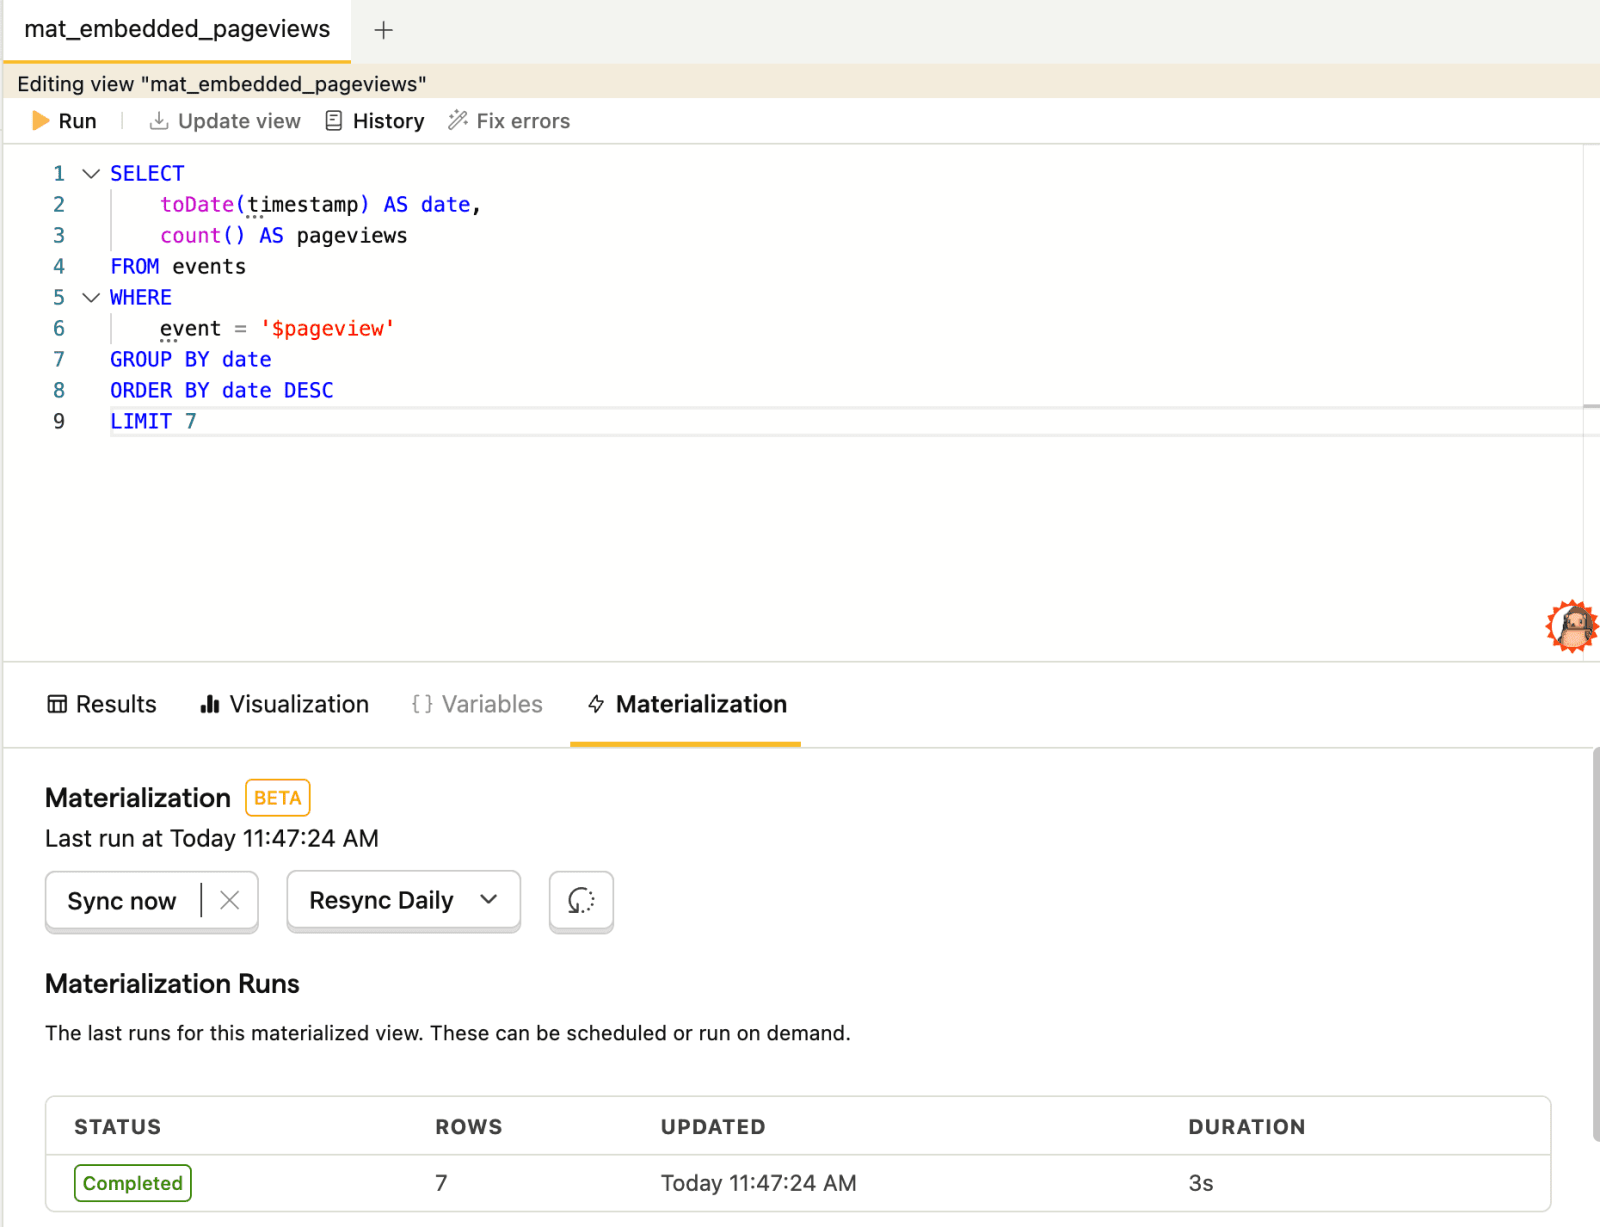

Once done, you can then use the materialized view back in your pageview API route like this:
The response is the same as before but the query is faster, which helps provide a better experience for your users.
Further reading
PostHog is the leading platform for building self-driving products. With a full suite of developer tools – AI observability, product analytics, session replay, feature flags, experiments, error tracking, logs, and more – PostHog captures all the context agents need to diagnose problems, uncover opportunities, and ship fixes. A data warehouse and CDP tie it all together, unifying that context into one source agents can read across. You can steer it all from Slack, the web app, the desktop (PostHog Desktop), or your own editor via the MCP.