






What is real user monitoring (and how to use it in PostHog)

Your app works locally, but then someone tries to check out on a five-year-old phone over terrible WiFi, and the “Purchase” button does absolutely nothing.
The problem here is that you can only test for things you expect to happen. You can't account for every browser, device, internet connection, agent, or other creative way someone might break your product. Luckily, your users are pretty good at finding the things you might miss.
Many teams already have some sort of synthetic monitoring, like test scripts, that catch the problems you know to look for. But you also need real user monitoring (RUM), which shows you what's actually happening when people use your product.
But what exactly is real user monitoring?
In short, real user monitoring measures how your product performs and behaves for real users. It's super useful for answering questions like, “why does checkout work in Chrome but not Safari?” or “is a slow-loading page causing people to abandon signup?”
These kinds of problems fall into three broad categories:
- Performance: Slow pages, laggy interactions, layout shifts, and requests that take forever.
- Reliability: JavaScript exceptions, failed API calls, crashes, and features that stop working.
- Usability: Rage clicks, dead clicks, confusing flows, and people giving up halfway through a task.
And for web performance, Core Web Vitals are a good starting point. They're Google's standard metrics for how fast, responsive, and stable a page feels to real users. In other words, they're RUM metrics by design. Each one has a clear threshold for what counts as "good":
- Largest Contentful Paint (LCP): How long the main content takes to appear. Good is 2.5 seconds or less.
- Interaction to Next Paint (INP): How quickly a page responds to user interactions. Good is 200 milliseconds or less.
- Cumulative Layout Shift (CLS): How much the layout unexpectedly jumps around. Good is 0.1 or less.
Of course, knowing a page takes eight seconds to load doesn't necessarily explain why. That's where other observability tools enter the picture.
So, why isn't your checkout button working?
Let's go back to that broken “Purchase” button from the beginning of the article. Perhaps your checkout conversion rate has dropped a bit since your last deployment, but no one’s reported anything yet. Obviously, something’s fishy.
You could try reproducing the problem yourself. Or you could use RUM and check out what happened to the people who experienced the bug.
Great news: PostHog brings together everything you’d need for real user monitoring in one place. So, let’s investigate why your checkout button is broken in PostHog.


Install PostHog with one command
Paste this into your terminal and make AI do all the work.

1. Start with the symptoms
Before you can investigate anything, you need to know what’s going on in prod. Start by installing the PostHog JavaScript SDK or adding the snippet to your website.
Once that's running, you can start collecting performance, error, and behavioral data.
Is it performance?
In PostHog, open Web Analytics then nav to Web Vitals to see how your pages are performing. PostHog can autocapture LCP, INP, CLS, and FCP as $web_vitals events, so you don't have to instrument them yourself. Simply enable Web Vitals autocapture in your project settings and make sure capture_performance isn't disabled in posthog.init.
The dashboard shows performance over time and breaks it down by page. You can also filter by properties like device and browser to find out whether a problem affects everyone or just a particular group.
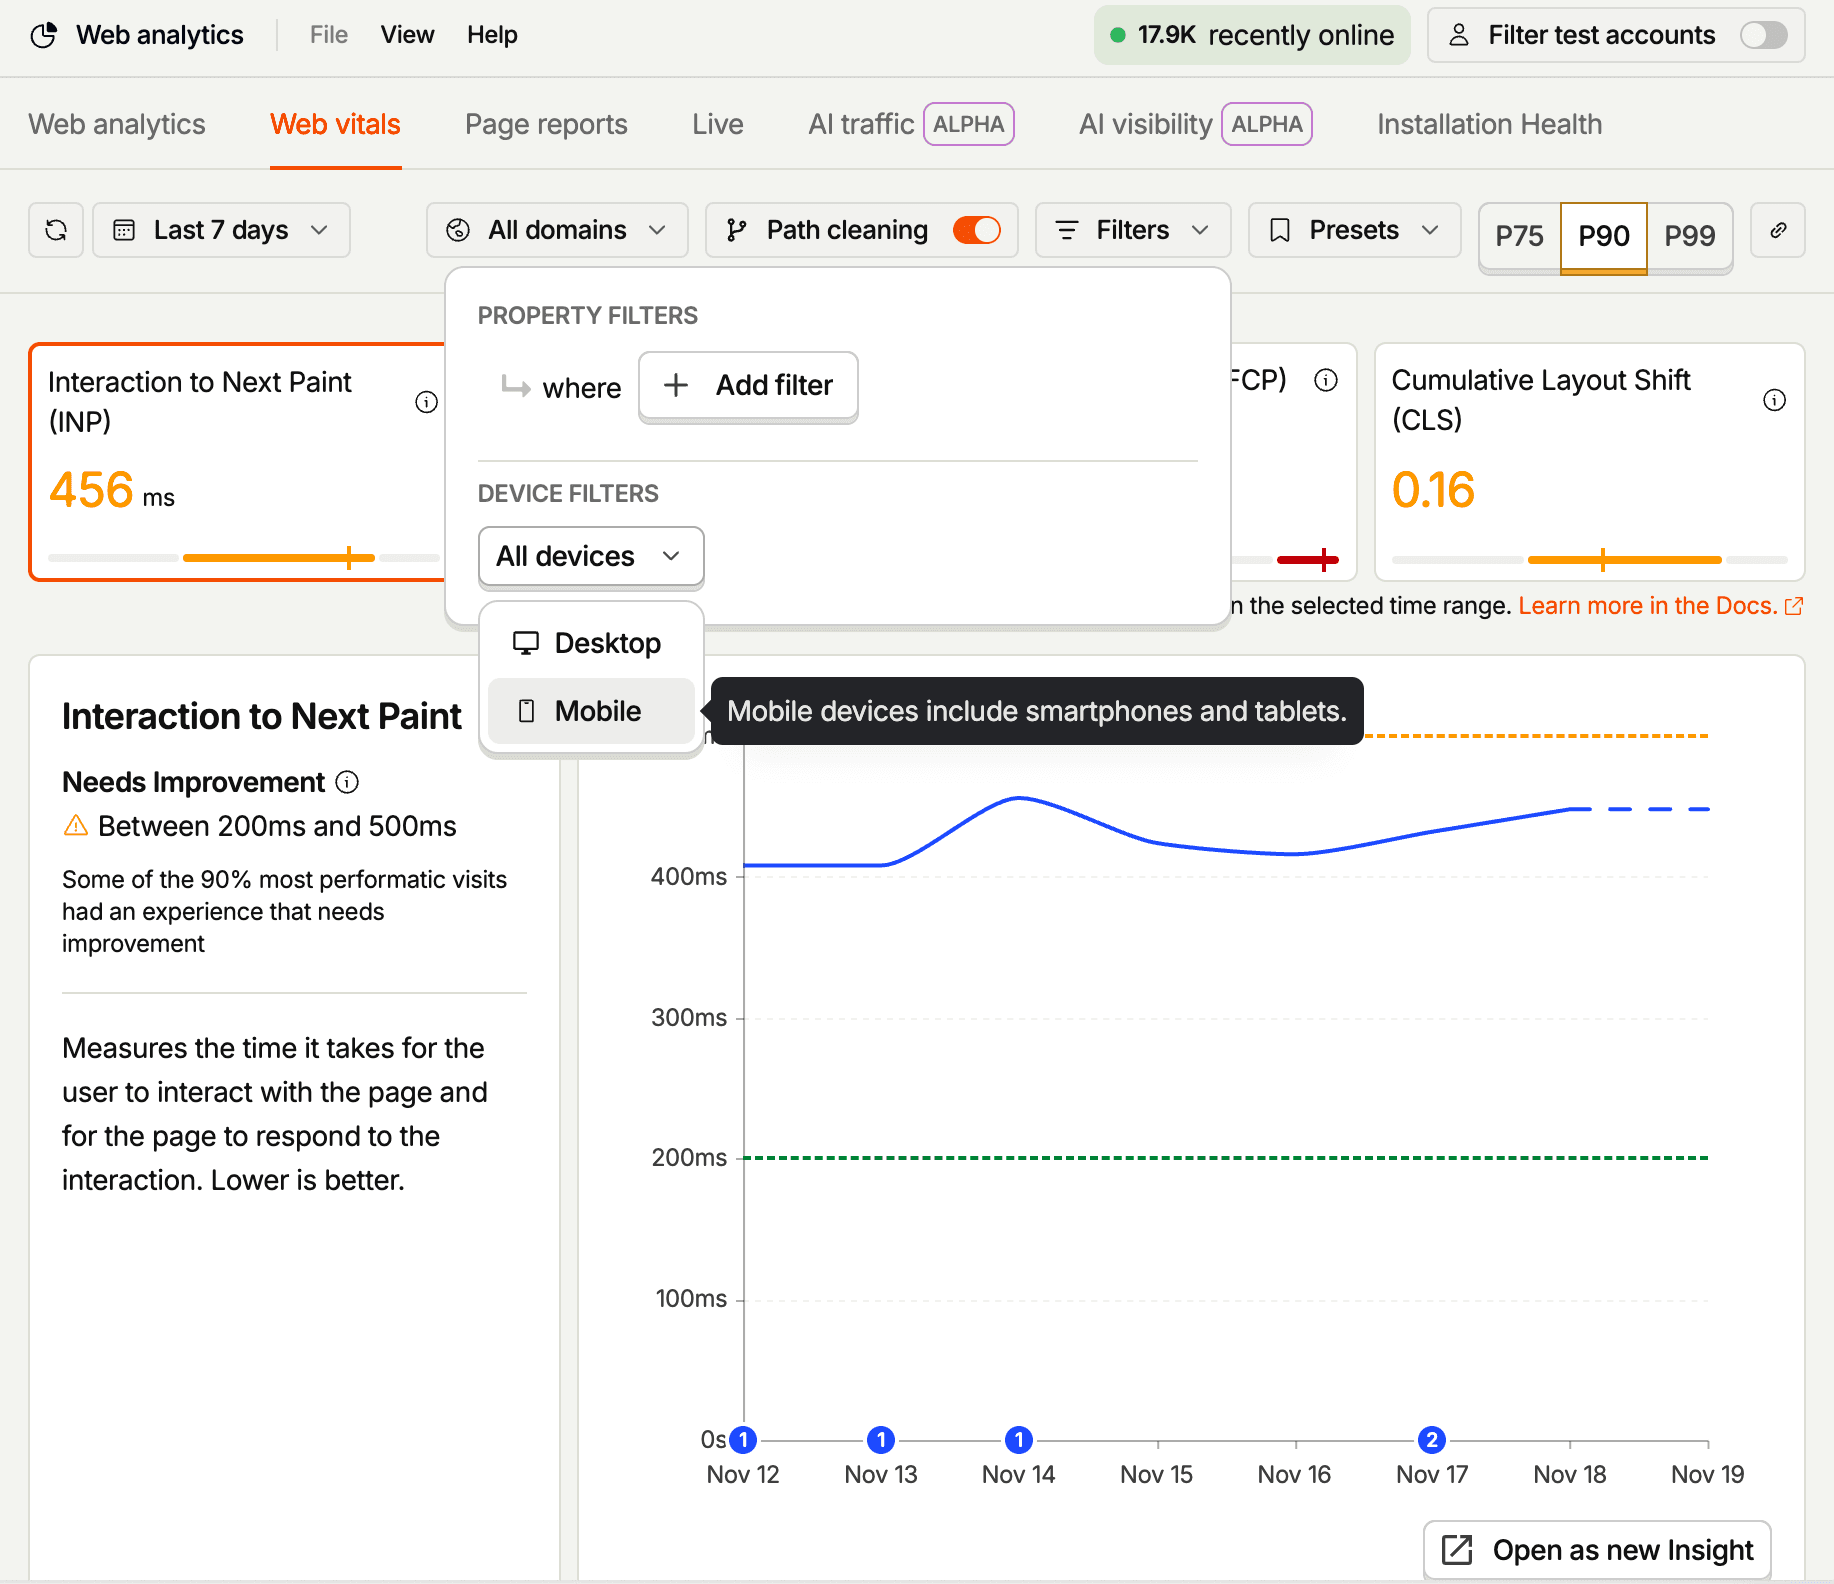
For example, you might discover that your checkout page has poor INP scores on mobile devices. That suggests users experience delays when they interact with it, even if the page still technically loads.
This actually happened to us on posthog.com. Andy saw that our INP got worse, and mobile was hit hardest. On mobile Chrome, response times jumped from around 600 ms to 2.5 seconds. Using PostHog's Web Vitals, he traced the slowdown to a newer version of posthog-js. The suspected cause was an SDK change adding extra work to every click. This was barely noticeable on a fast laptop, but painfully obvious on a phone. A perfect example of what real user monitoring is good at catching.
Is something breaking?
Error Tracking helps you find exceptions occurring in your application. Turn on exception autocapture in your PostHog SDK, and similar exceptions are grouped into issues, so you see one recurring problem instead of a wall of duplicates. You can also use posthog.captureException(error) for errors you’re already catching.
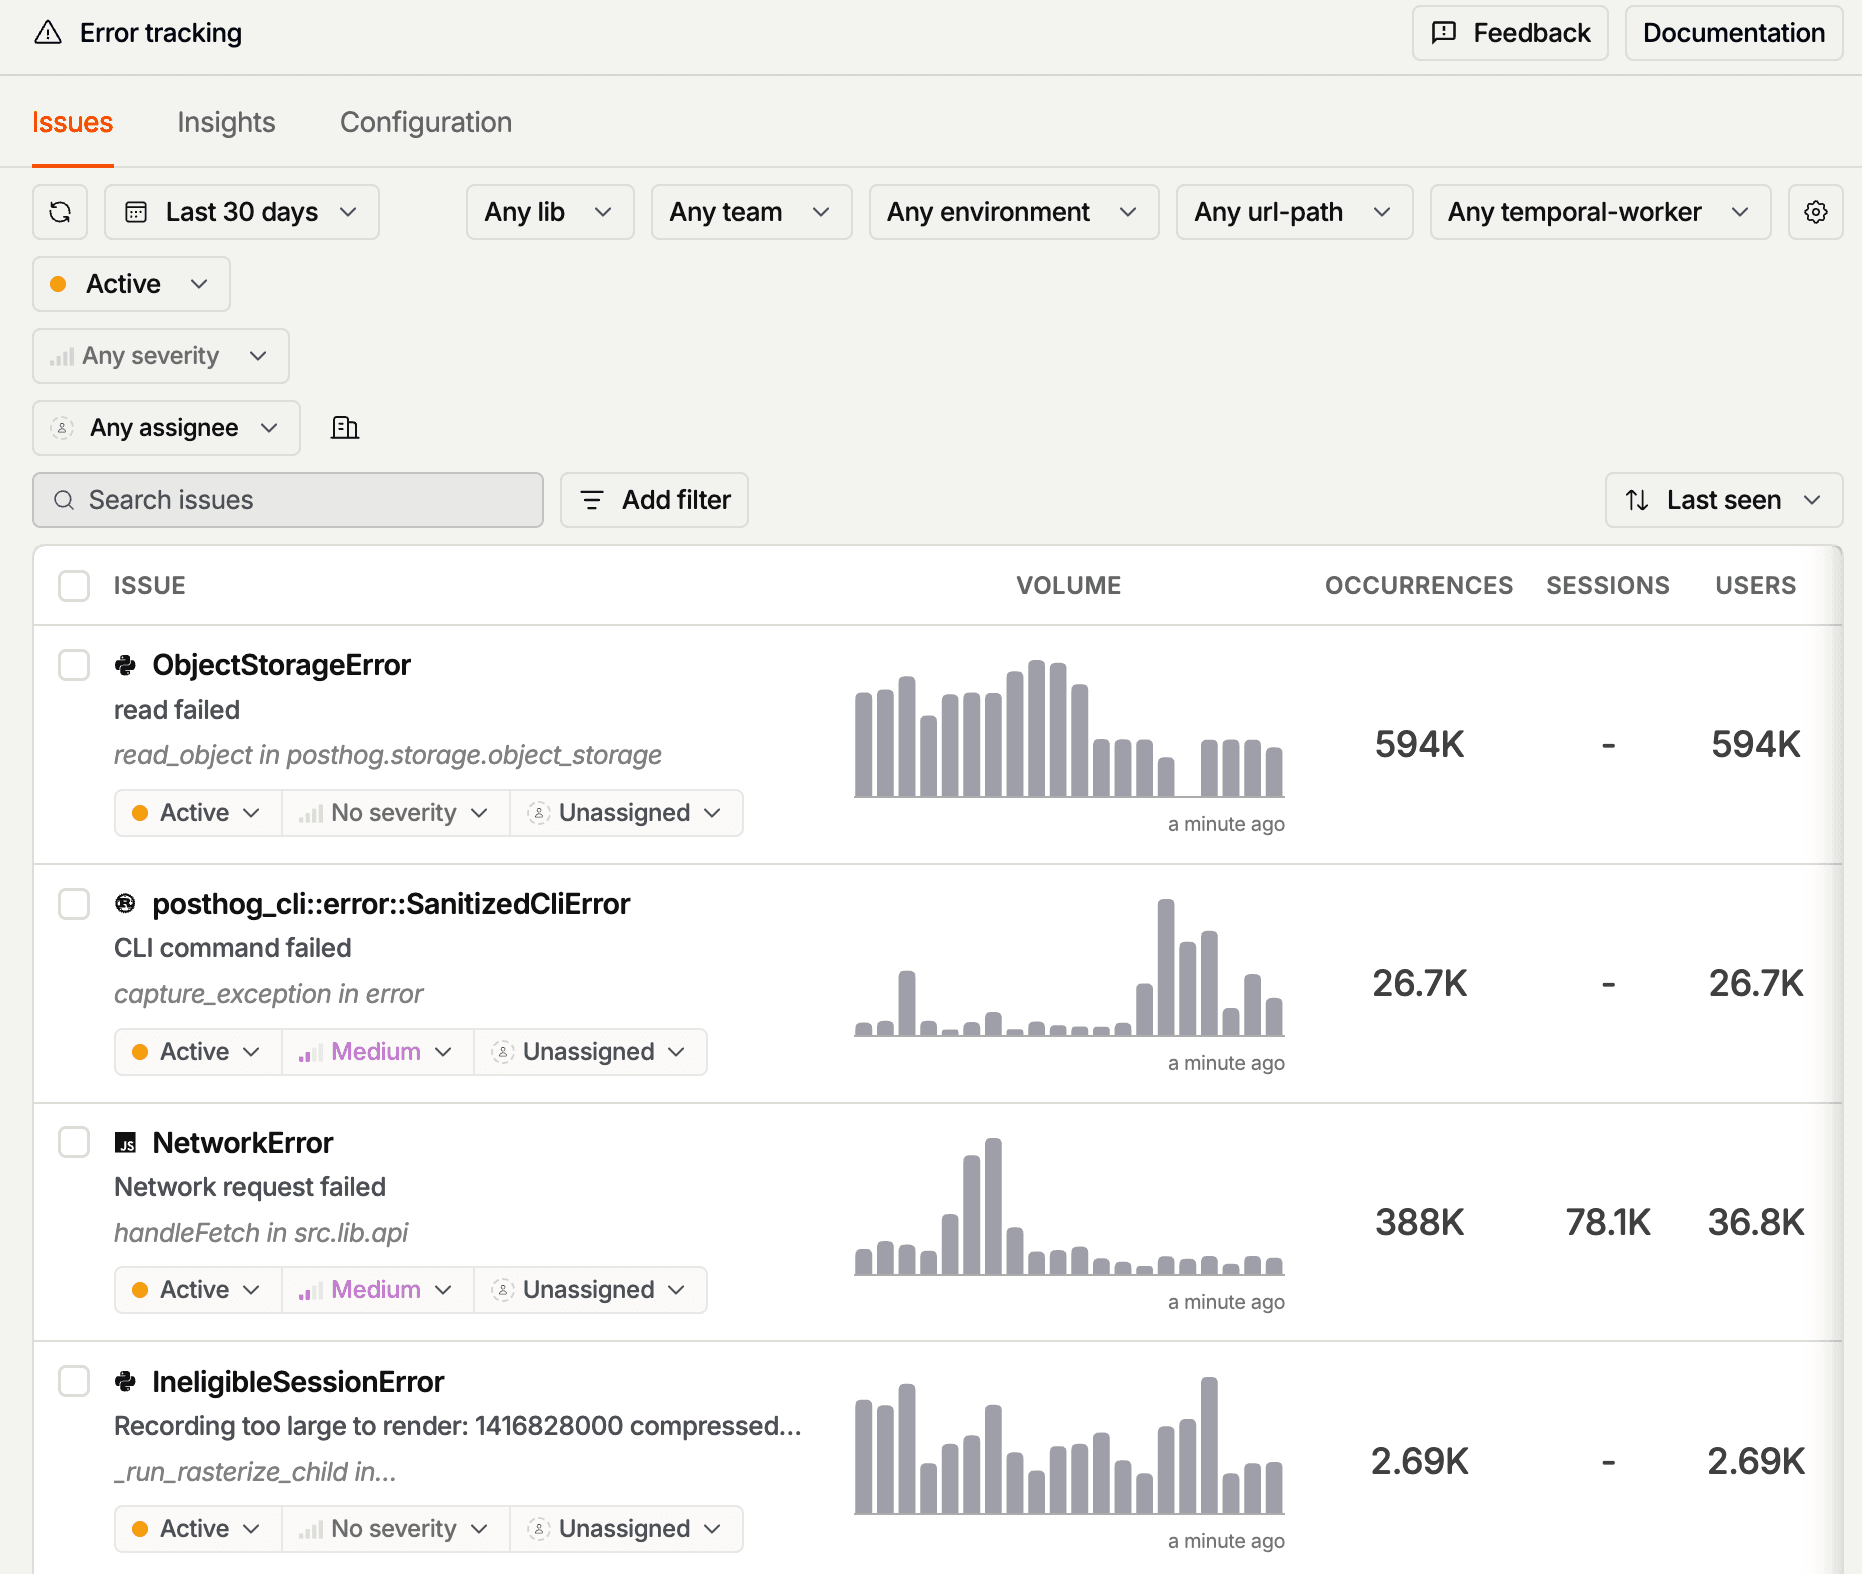
Then upload source maps for your frontend code so you can see readable stack traces instead of trying to decipher minified JavaScript.
Maybe you spot a new exception that started right after your latest deployment. Et voilà, now you have a real lead.
Finally, check whether users are abandoning the flow
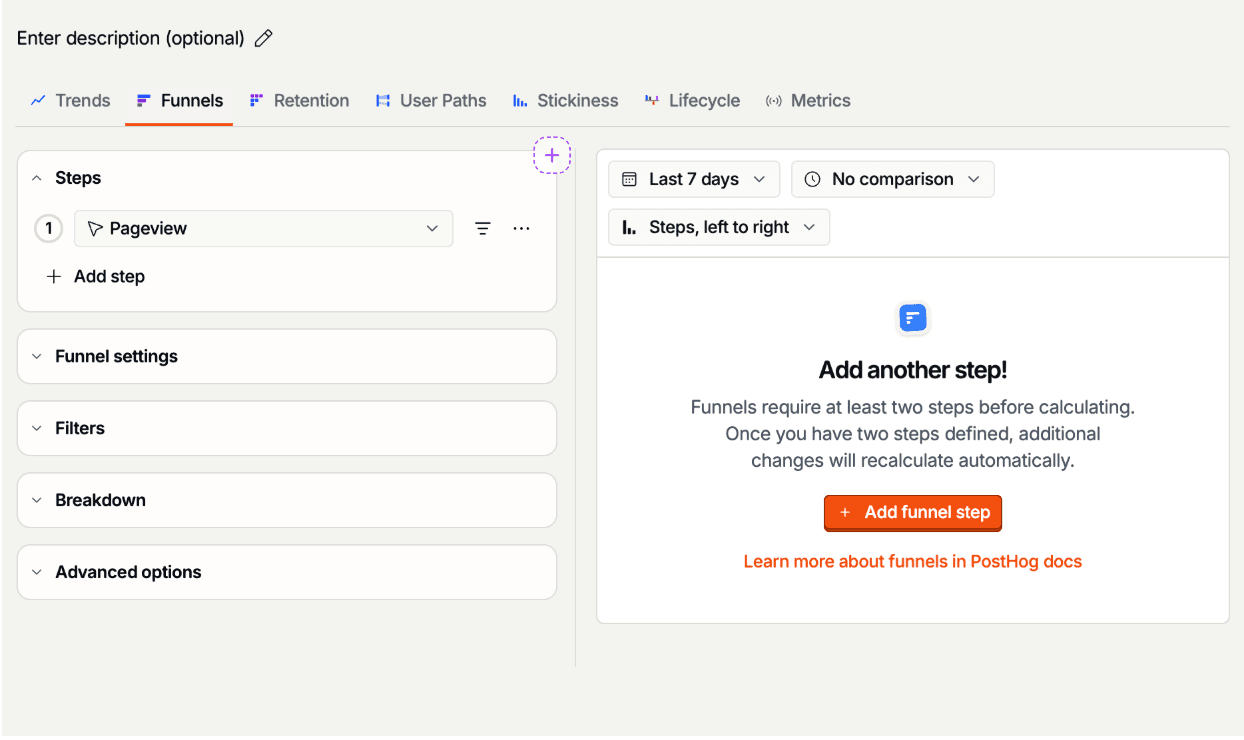
With Product Analytics, you can build a funnel from checkout_started to purchase_completed and break it down by device or browser to see who's dropping off. Rage clicks and dead clicks also show where people are struggling. They won't tell you why, but they're a good tip-off on where to look.
So, for example’s sake, at this point, you might know three things:
- Checkout conversion has dropped.
- A new JavaScript exception appeared after your deployment.
- Mobile users are experiencing slower interactions.
That's enough to start an investigation.
2. See what actually happened to the user
With Session Replay, instead of reproducing the bug, you watch exactly where someone encountered it.
First, enable Session Replay and use trigger groups to focus on relevant sessions. Then open the checkout exception in Error Tracking and jump to a related recording. Maybe you see someone click "Purchase," wait several seconds, and get an error.
This already tells you more than a support ticket that just says, “checkout is broken.” And if the problem is usability rather than a technical failure, Heatmaps can show whether other people are struggling too.
3. Follow the problem into your backend
PostHog Logs shows what your app was doing when the request failed, and Distributed Tracing follows the request across your services. Both need some backend instrumentation, but you get to pick how. The PostHog Node.js and Python SDKs can create spans on their own, posthog-node has its own logger, and if you already run OpenTelemetry, PostHog supports that too.
The important part is connecting this data to the user's session. By passing the user's session and distinct IDs to your backend, you can link logs to the original recording and see how a backend failure affected the frontend.
For example, a broken checkout button might turn out to be a payment request timing out. Instead of debugging the frontend and backend separately, you can follow the problem from the user's click to the failing request, which is much better than spending three hours trying to reproduce a bug on a phone you don't own.
Where AI comes into the picture
But what about the bugs nobody's reported yet? Or the patterns buried in thousands of session recordings? You probably don't have time to watch every replay yourself, but luckily, you don't have to.
PostHog has a few tools that can help take some of the investigative work off your plate:
- Replay Vision scans session recordings for patterns and potential problems, saving you from watching hours of people clicking around your app.
- PostHog AI and MCP help you query product data and investigate issues from your editor or other supported tools.
- Scouts investigate recurring problems on a schedule and surface findings. They file reports to the Inbox, and some reports include a draft pull request.
One of our Replay Vision scanners recently spotted users opening a replay from Error Tracking, then manually scrubbing to find the exception. The link is supposed to drop you right at the moment the error happened.
The problem was some error links put a space between the date and the time, and the replay player only accepted a "T.” Nobody reported it, and our tests missed it. Replay Vision flagged the issue, an engineer picked it up, and an agent wrote the PR. Turns out, monitoring tools need monitoring too.
Finding the problem is only half the job
So, we’ve figured out why your checkout button isn't working. Now, you've got to fix it without breaking something else.
With Feature Flags, you can roll out your fix to a small percentage of users before releasing it to everyone. If things get worse, just turn the flag off and continue your investigation. You can also set up Alerts to notify your team when error rates spike or conversions drop, rather than manually checking the same dashboard every five minutes. And for the problems you didn't think to set an alert for, Scouts can keep watching your data on a schedule and report back with what they find.
And once you've shipped the fix, you need to check whether it actually worked. Compare error rates, Web Vitals, and checkout completion before and after the change. For changes where you want to test whether one version performs better than another, run an Experiment.
Real user monitoring is only useful if you act on what you find. So, start by capturing performance metrics, errors, and user behaviors with PostHog. And once you've shipped a fix, check the data again to make sure that it actually worked. After all, nobody cares how good your dashboards look if your product is still broken.
Further reading
- The most useful product health metrics
- Retention rate vs churn rate: An intro to churn analysis
- How to improve web app performance using PostHog session replays

Subscribe to our newsletter
build mode
Read by 75,000+ founders and builders
We'll share your email with Substack
PostHog is your product's context layer. With a full suite of developer tools – AI observability, product analytics, session replay, feature flags, experiments, error tracking, logs, and more – PostHog ingests and stores all the data agents need to diagnose problems, uncover opportunities, and ship fixes. A data warehouse and CDP tie it all together, unifying that context into one source agents can read across. You can steer it all from Slack, the web app, the desktop (PostHog Desktop), or your own editor via the MCP.