


How to set up Next.js monitoring

Contents
Monitoring a Next.js app for performance regressions, loading speed, and errors helps you be confident your app is providing the best possible experience. Real user monitoring is a best practice for apps looking to optimize their user experience.
In this tutorial, we'll create a basic Next.js app, setup PostHog to monitor errors and performance, and then build a dashboard to analyze this information.
Already have a Next.js app? Click here to skip to the PostHog installation.
Create a Next.js app
To create a Next.js app, run the following command, choose not to use TypeScript, and the defaults for all the other options (including using the app router).
After installing and creating all the files, go into your newly created monitor folder and start the server.
This starts up your Next.js site, which we can now add PostHog to set up monitoring.
Set up PostHog
To add PostHog, install posthog-js.
After this, create a providers.js file in your app folder. In this file, set up PostHog for the client using the PostHogProvider component as well as your project token and instance address, which you can get from the getting started flow or your project settings.
Once created, import and add the provider to your layout.js file.
Once this is set up, go to your project settings, and make sure:
- Autocapture is enabled
- Under recordings, record user sessions, capture console logs, and capture network performance are all enabled.
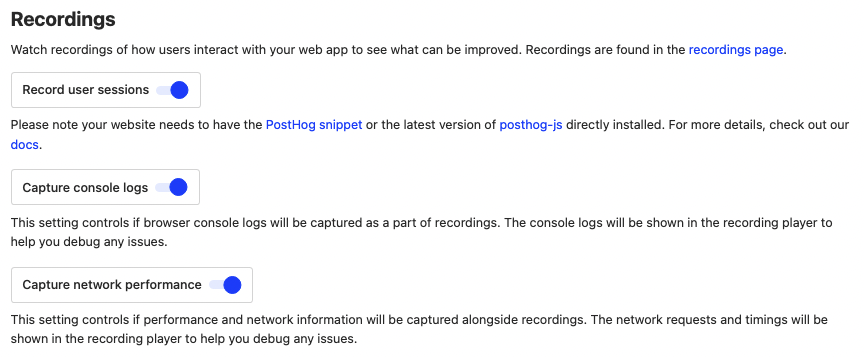
Enabling these provides the key monitoring tools including performance monitoring, app usage, and session replays. It also enables capturing custom events which we use for errors and more performance data next.
Custom error capture
Error capture gives you insights into the errors your users experience.
To set up custom error capturing, we can create a React error boundary:
- In the
appfolder, create a file namederror.js. - In this file, set up a basic component that uses
usePostHogto capture the exception withcaptureExceptionand returns an error page.
It should look like this:
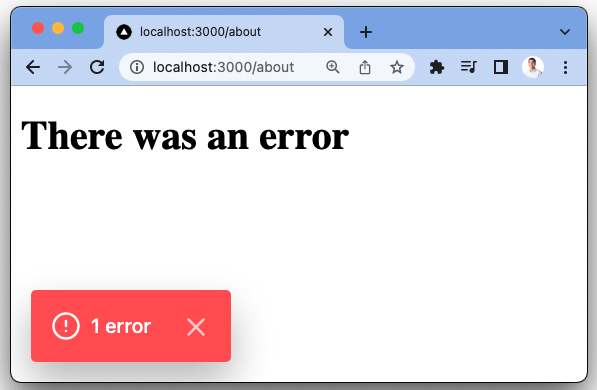
Now, in your app folder, create a new folder named about and add a file named page.js. In this file, set up a component that throws an error:
When you go to http://localhost:3000/about, you'll see the error page.
This also captures an exception event in PostHog with details like the current URL, OS, browser, time, and more.
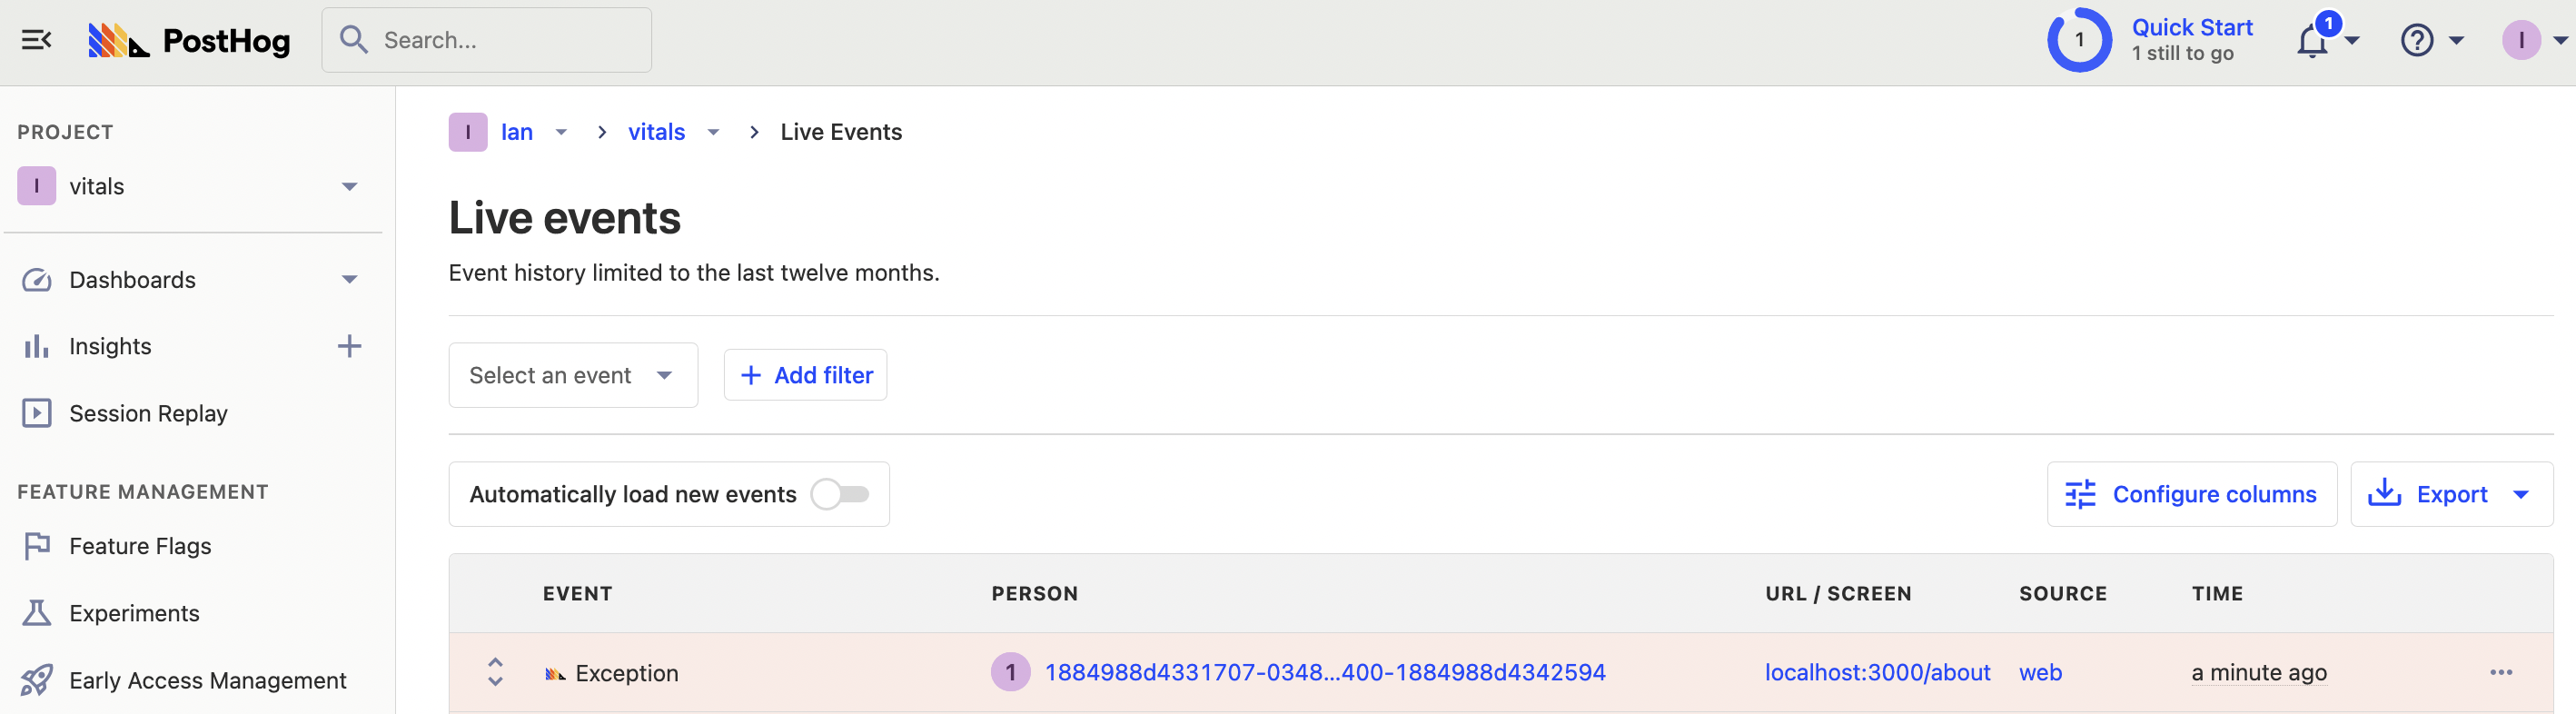
This will capture errors thrown in your app (wherever they happen) into PostHog.
Custom performance capture
Another key part of monitoring your Next.js app is performance monitoring. Session replays track performance metrics like First Contentful Paint, DOM interactive, and page loaded times at a session level. If you want these values in the aggregate, we can capture them using useReportWebVitals.
To set this up, create a new file in your app folder named web-vitals.js. In this file, import useReportWebVitals and usePostHog, then export a function that captures an event with the same name as the metric with all the metric details as properties.
Once created, add your WebVitals component to your layout.js file.
Once done, you'll start to see performance metrics in your PostHog instance.
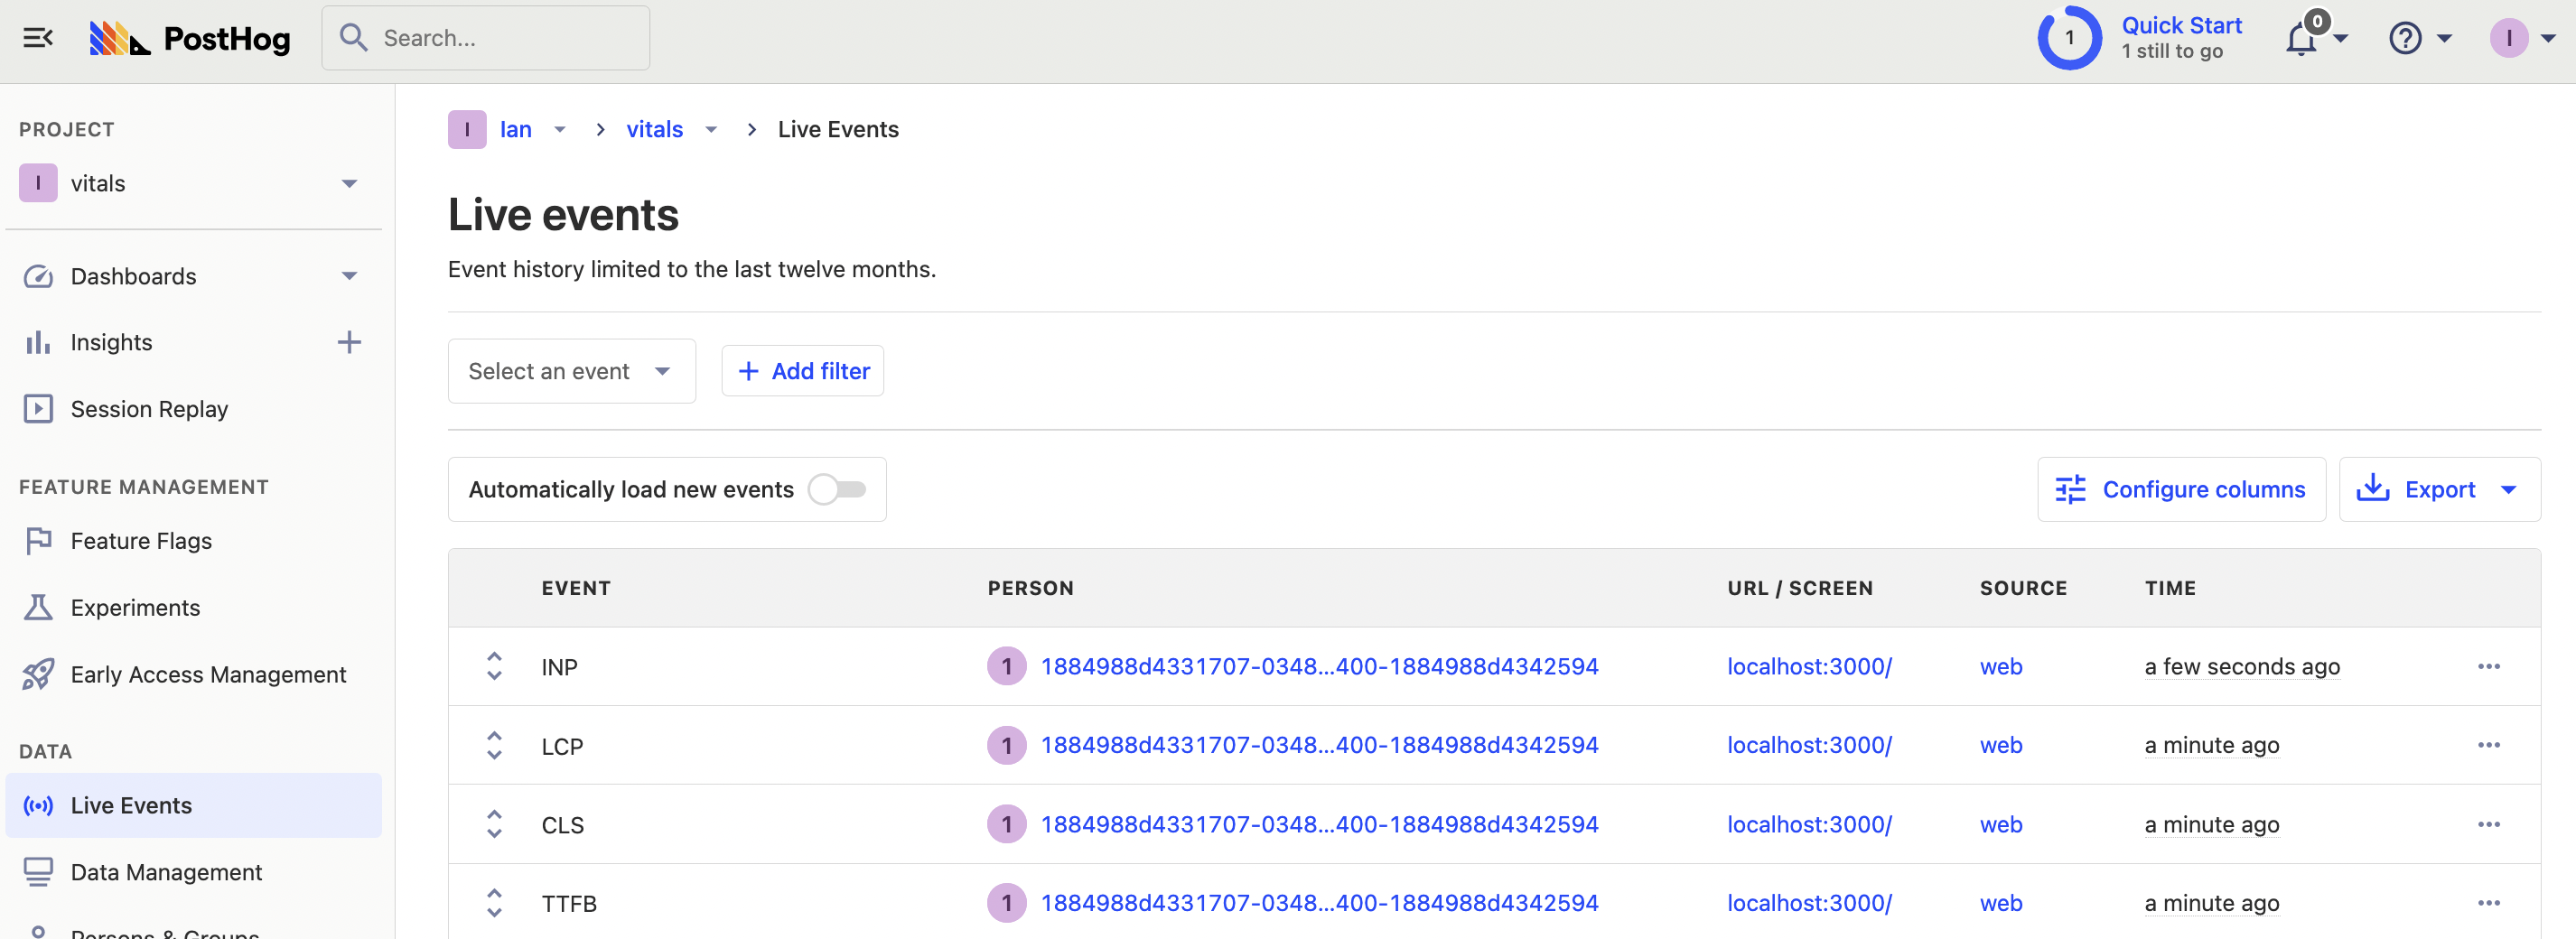
Note: you might want to filter for specific web vital events by checking their name or sample using specific criteria as this method generates a lot of events for each pageview.
Creating a monitoring dashboard
With everything set up for monitoring our Next.js app, we can create a dashboard that gives us a complete overview. On this dashboard, we will create insights for page load, time to first byte, first contentful paint, cumulative layout shift, and errors.
To start, go to the dashboards tab, click new dashboard, choose blank dashboard, and then add an insight.
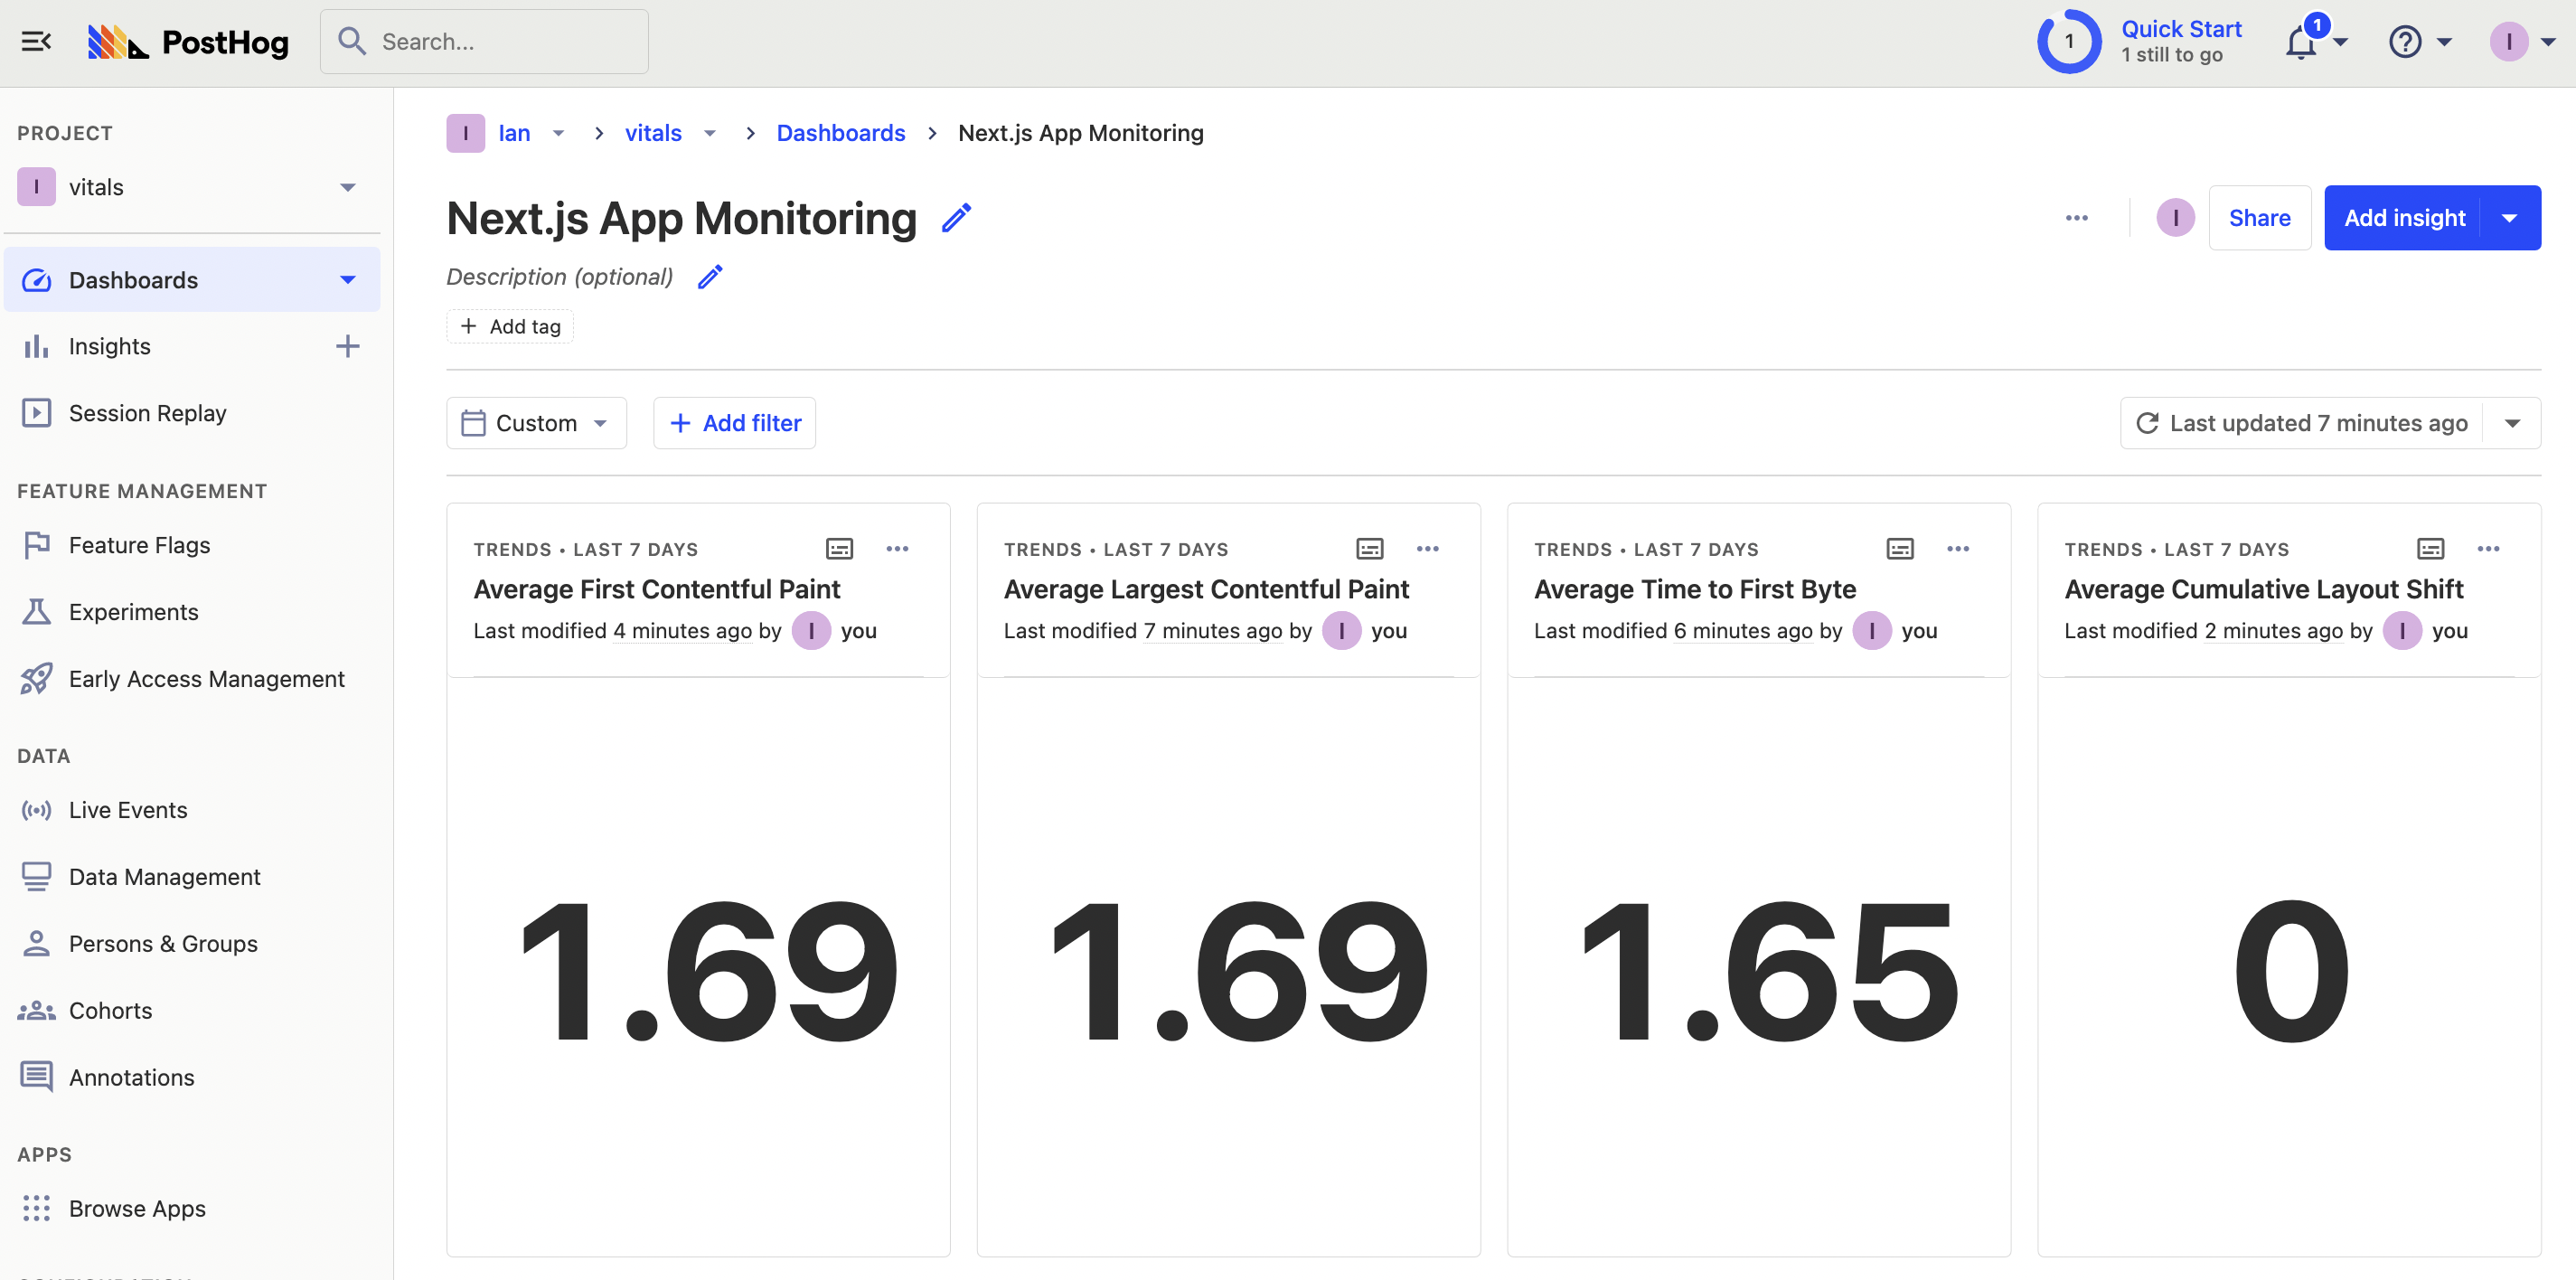
We start with averages for our page load metrics. Select LCP as your series, then aggregate by average property value, select value as your property, enable formula mode, and divide A by 1000 to get seconds. Both the trend and number chart type work well for this. Once done, click "Save & add to dashboard."
Afterward, you can create similar insights the other performance metrics like TTFB, FCP, and CLS. Your dashboard will look like this:
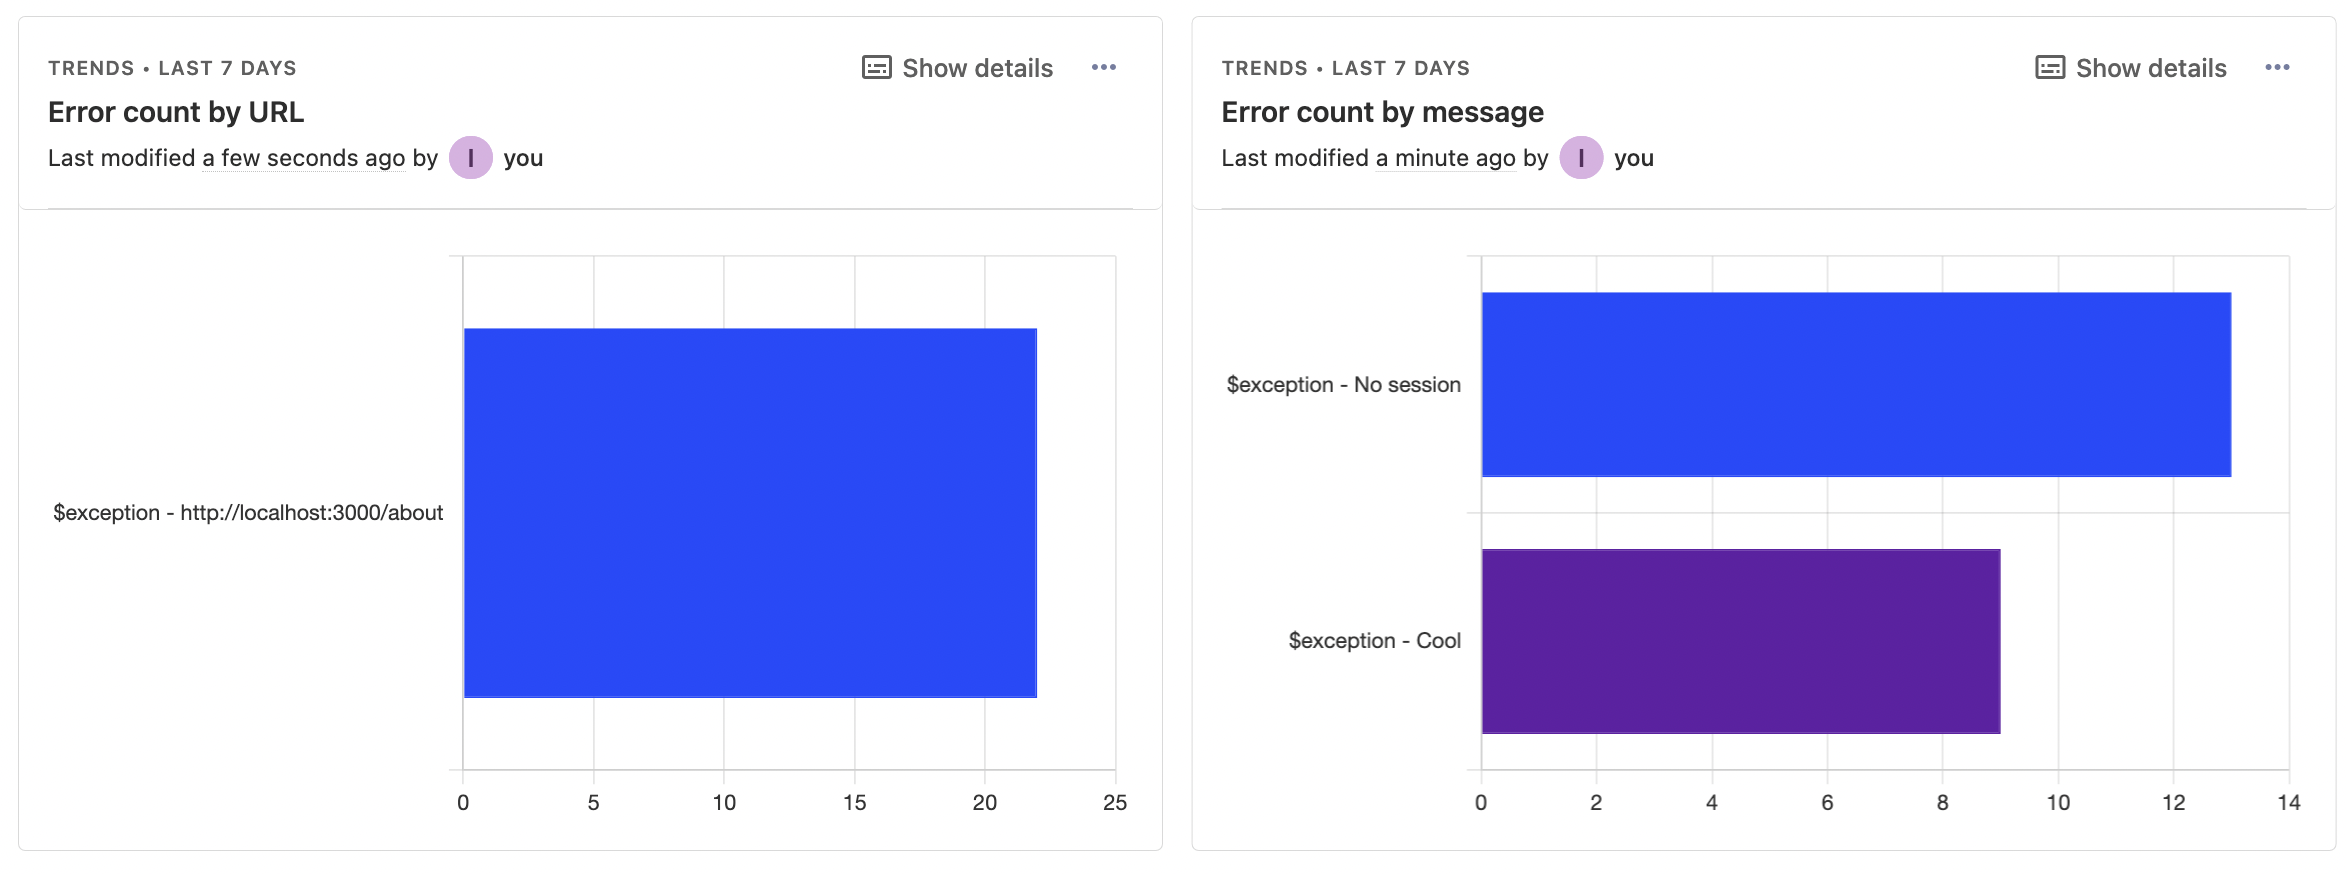
Next, we can analyze our errors. We can create insights for errors broken down by current URL and message. Use the Exception event as the series, aggregate by total count, break down by current URL, and choose the total value bar chart. You can duplicate the insight, change the breakdown to message, and add both to your dashboard.
This gives you a base dashboard to monitor your Next.js application. Some more insights you could add to your monitoring dashboard include:
- 90, 95, 99% percentile values for performance metrics.
- Exceptions broken down by users.
- User path to exception.
- Total rageclicks broken down by URLs.
For all of these insights, you can click the visualization to list the users and sessions that make up the data. From the modal that pops up, you can go to related replays and see all the details, including the events, console, and performance.
Further reading
- Calculating average session duration, time on site, and other session-based metrics
- What is real user monitoring (and how to set it up)
- How to improve web app performance using PostHog session replays

Subscribe to our newsletter
build mode
Read by 75,000+ founders and builders
We'll share your email with Substack
PostHog is the leading platform for building self-driving products. With a full suite of developer tools – AI observability, product analytics, session replay, feature flags, experiments, error tracking, logs, and more – PostHog captures all the context agents need to diagnose problems, uncover opportunities, and ship fixes. A data warehouse and CDP tie it all together, unifying that context into one source agents can read across. You can steer it all from Slack, the web app, the desktop (PostHog Code), or your own editor via the MCP.