


Monitor and search issues
Contents
This guide covers how to find the most relevant, urgent, and impactful issues in your error tracking using the issues page.
Monitoring issues
When you're monitoring issues in your project, there are generally two common workflows:
- You're exploring issues to identify impactful and problematic areas. You should use sorting features.
- You're looking for issues assigned to you to resolve them. You should filter by the
Assigned toproperty.
Sorting issues
Issues can be sorted by the following properties:
| Property | Description |
|---|---|
| Last seen | The issue that has the most recent exception |
| First seen | The issue that has the oldest exception |
| Occurrences | The number of exceptions in the issue |
| Users | The number of unique users affected by the issue |
| Sessions | The number of unique sessions affected by the issue |
Sorting by last seen and occurrences are great ways to get a general sense of issues in your project. Sorting by users and sessions is great to find the most impactful issues if you're using other filters to narrow down your results.
Monitoring issues assigned to you
You can filter issues by the Assigned to property to find issues assigned to you. This is especially useful if you configure automatic issue assignment and configure alerts to notify you when new issues are created.
Finding specific issues
You can use the search bar at the top of the issue page to filter issues based on the properties of the exceptions in that issue.
Search results are matched based on properties of exception events grouped into the issues. For example, if you search for "TypeError", we show you all issues where any exception grouped into the issue has a type of "TypeError".
You may see seemingly unrelated issues in your search results because your search term matches an exception in the issue group. For example, you may see an issues named RefreshError when searching "schema", because a get_schema method appears on the exception stack traces.
Filtering modes
The search bar provides two modes of filtering:
1. Exact property filtering
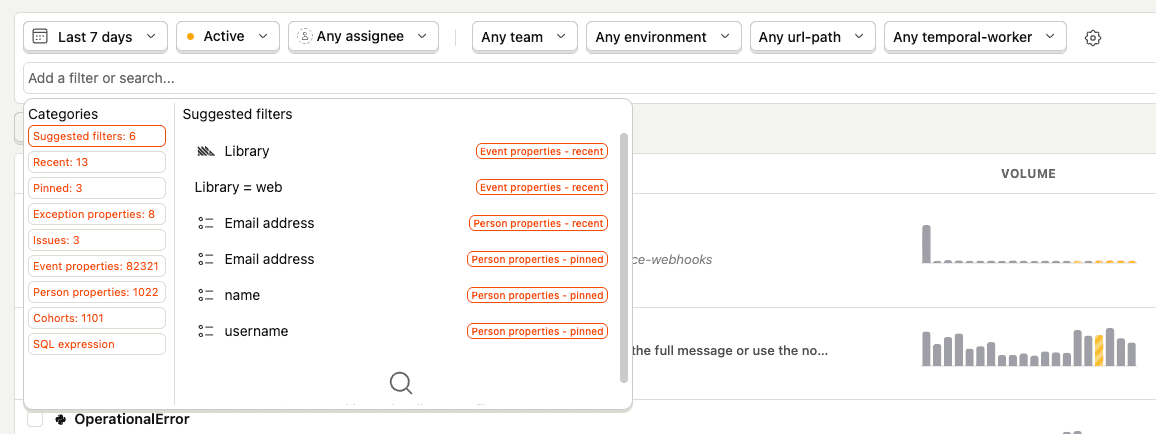
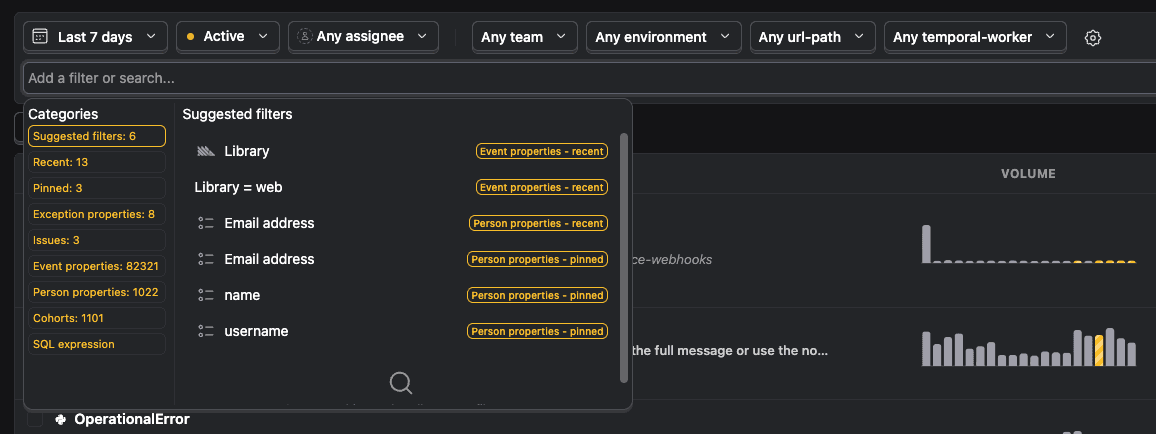
This operates like property filters elsewhere in PostHog, enabling you to add terms like where 'http_referer' is set or where 'library' equals 'web'. You add a property filter by clicking the property name shown here:
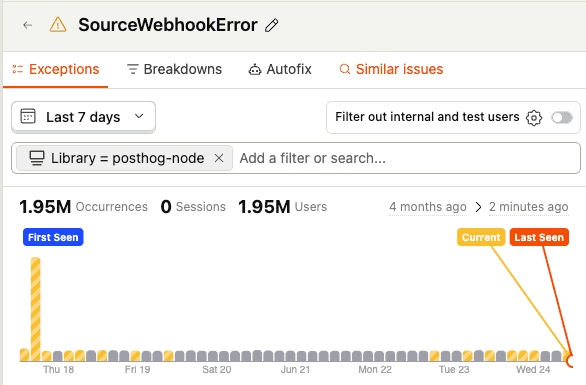
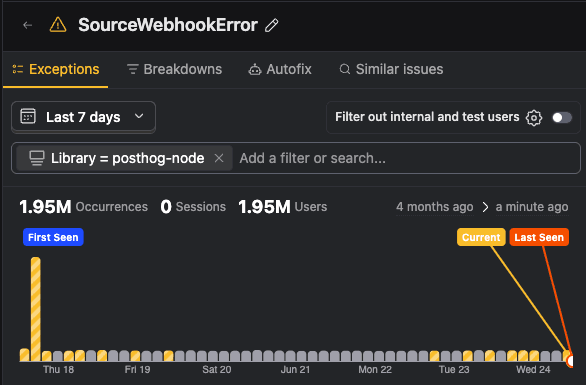
Added property filters look like this:
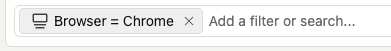
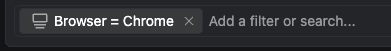
The results of both of these filter types (property filters and freeform search) are combined with AND logic, such that only exceptions that match all filters are included in the search results.
2. Freeform text search
This does text matching for a subset of the error tracking specific properties of the exception event. It splits the text you give it into tokens. The search matches an exception if each of the tokens in your search term appear in one of the following:
- The exception type
- The exception message
- The function names in the exception stack trace (if known)
- The file paths in the exception stack trace (if known)
For example, imagine you have an exception that looks like this:
If you search for the term TypeError myfile.js, the exception matches this search, as it contains TypeError (as the exception type) and myfile.js (as a file path in the stack trace).
If you search for TypeError myfile.js abc, the exception would not match, as the token abc does not appear anywhere in freeform search properties.
If you want to search for longer exact strings, e.g. a particular exception message, you can group tokens into a single term using quotes, e.g. "Cannot read property 'name' of undefined" myfile.js would match, and "Cannot read property of myfile.js" would not.
Note, perhaps unintuitively, Cannot read property of myfile.js would match, because the tokens are ungrouped, and all of them appear somewhere in the exception search properties.
Searching chained exceptions
Exception events can have more than one exception in them, due to language features like exception chaining. For freeform search, we put the types, messages, functions and file paths of all exceptions into one list, and match if the token appears in any of them.
For example, if you had a chained exception with the messages MyCustomError: Failed to load user and Cannot read property 'age' of undefined, searching for cannot read property would match the exception, because it matches one of the exception messages (property appears in the "root" one).
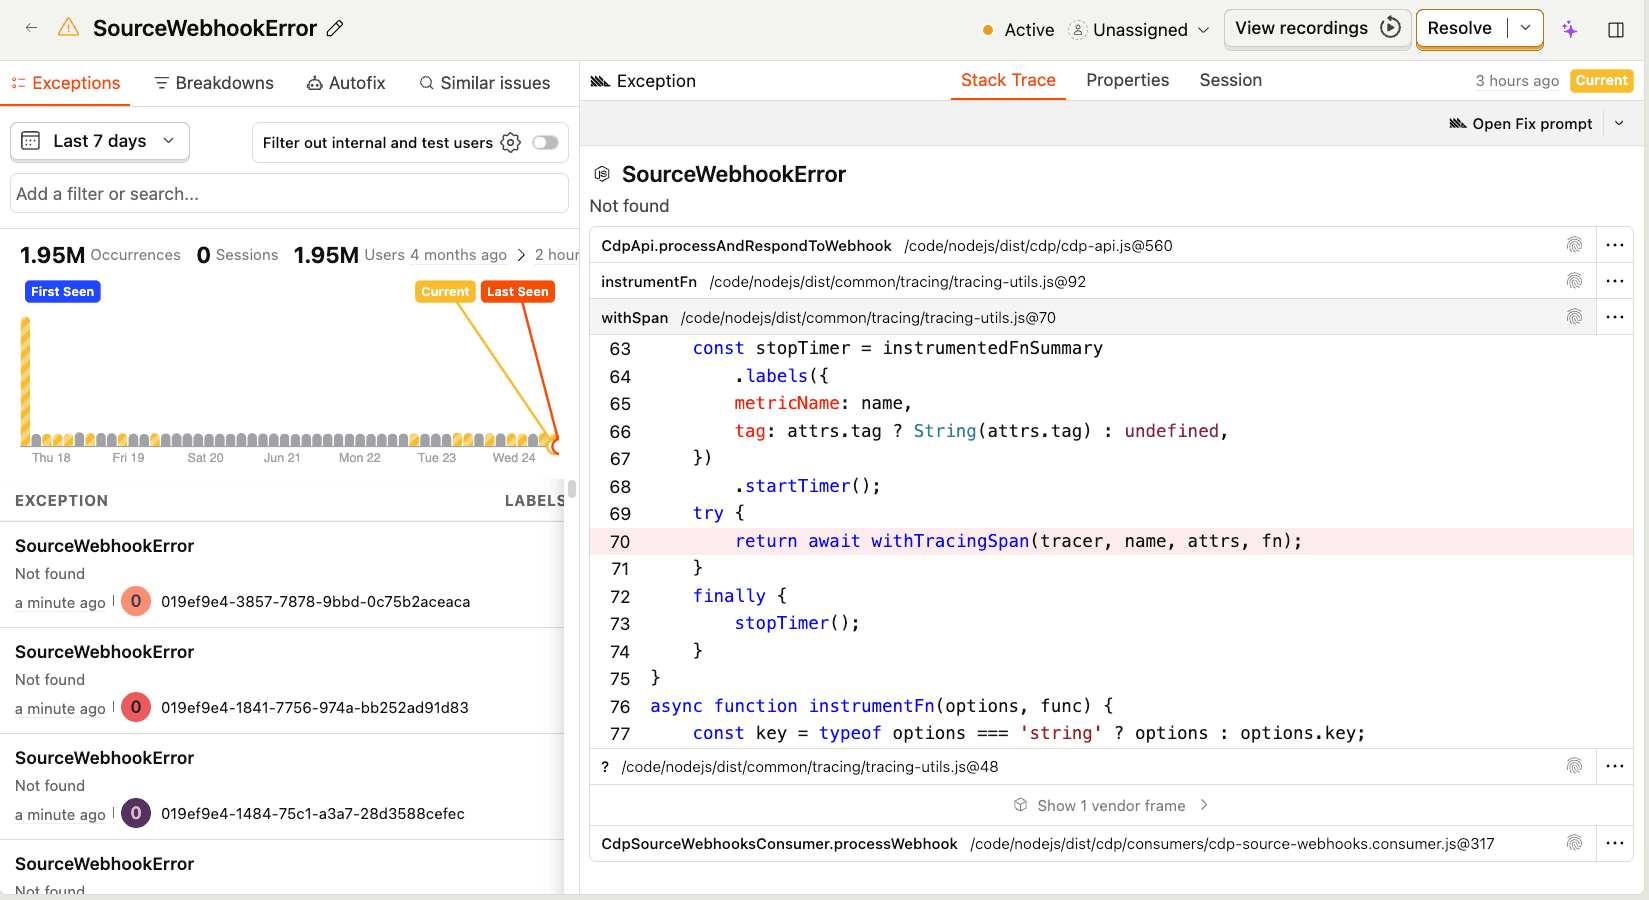
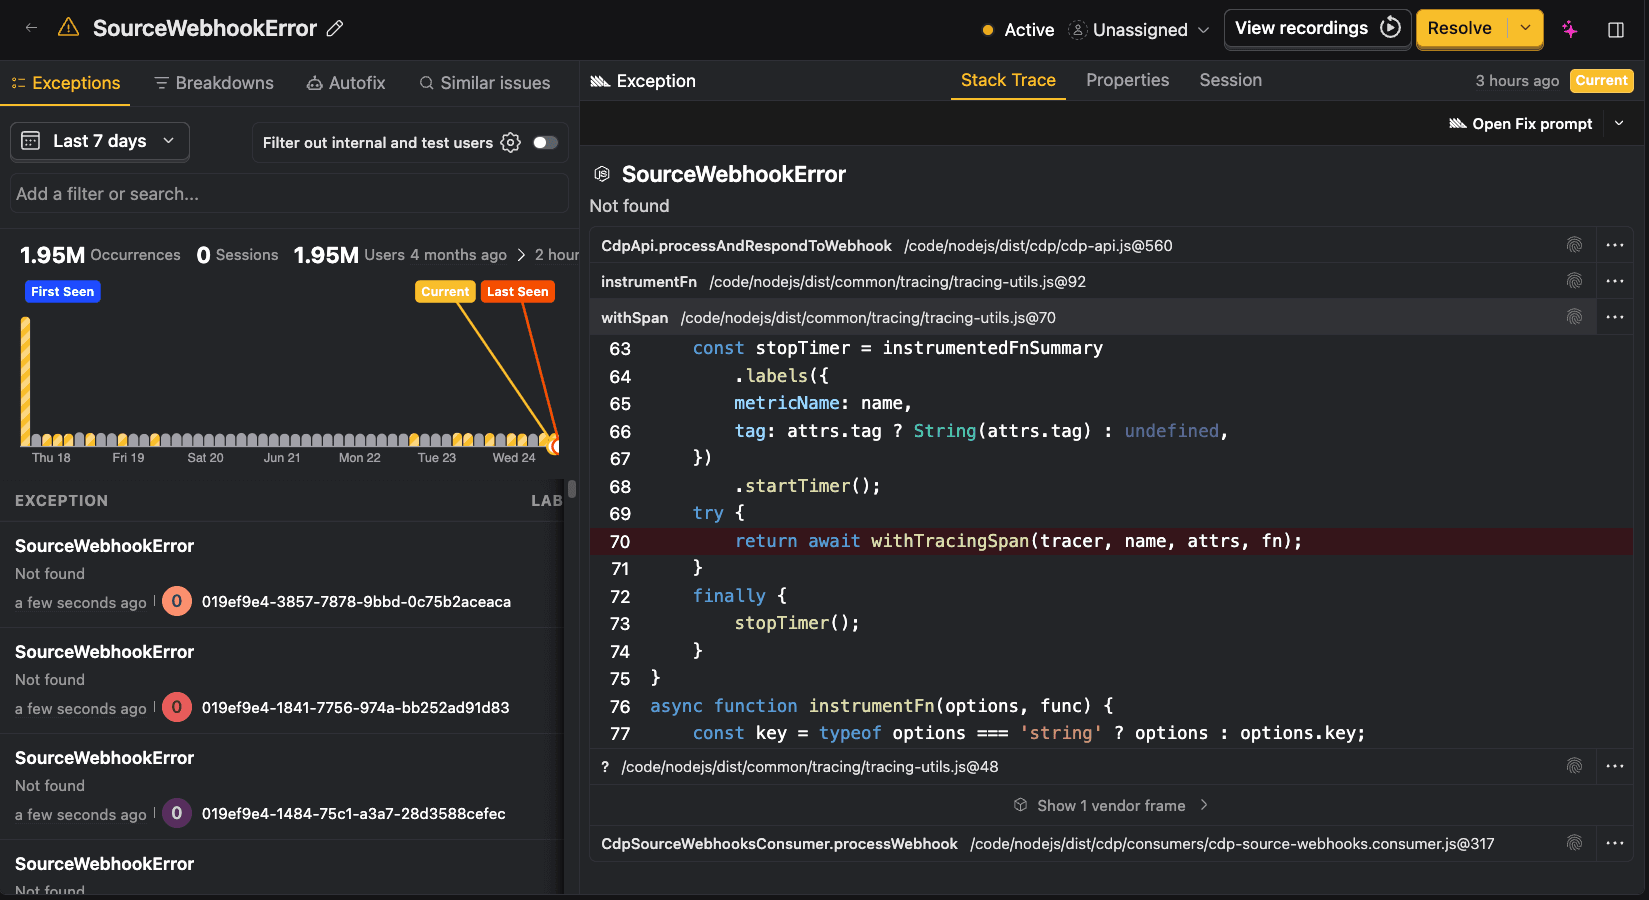
Issue details
When you click on an issue, you'll see the details page of the issue.
This page shows you the following:
- The stack trace, properties, and sessions related to the currently selected exception.
- Name, description, status, assignee, and external tracking links for the issue.
- A filterable list of all exceptions in the issue. Selecting an exception will show you the stack trace, properties, and sessions related to that exception at the top of the page.
Filtering exception occurrences within an issue
Once you've found and opened the issue you want to investigate, you can use the same search interface to filter the exception list for a particular instance of the issue. This is particularly useful in cases where some exceptions in the issue have information others don't and you want to use that information for debugging.
For example, you can add a property filter on http_referer that shows all exceptions where the http_referer is set:
If you have a set of filters that you use often, you can create alerts for them. This way you can be notified when new issues match your filters. Learn more about alerts.
Improving search performance
We try to return results to you within a second, but sometimes if you're querying over large amounts of data, it may take longer. The following can improve the search performance:
Limit the time range you're searching over: 7 days is usually enough to get a sense for the trends of an issue over time.
Use freeform search rather than property filters: Our freeform searches are generally faster than property filters, as the total amount of data processed is smaller.
If you find your queries timing out or taking more than 30 seconds, please let us know in-app! We're always looking for benchmarks to improve against.
Suppressing issues
If you find issues that are not useful to you, you can suppress them by changing the status to Suppressed. We recommend that you also implement client-side suppression to not capture these exceptions in the first place, for cost and performance reasons.