


Manage and resolve issues
Contents
Error tracking gives you multiple ways to help you manage issues and work towards resolution.
Update issue status
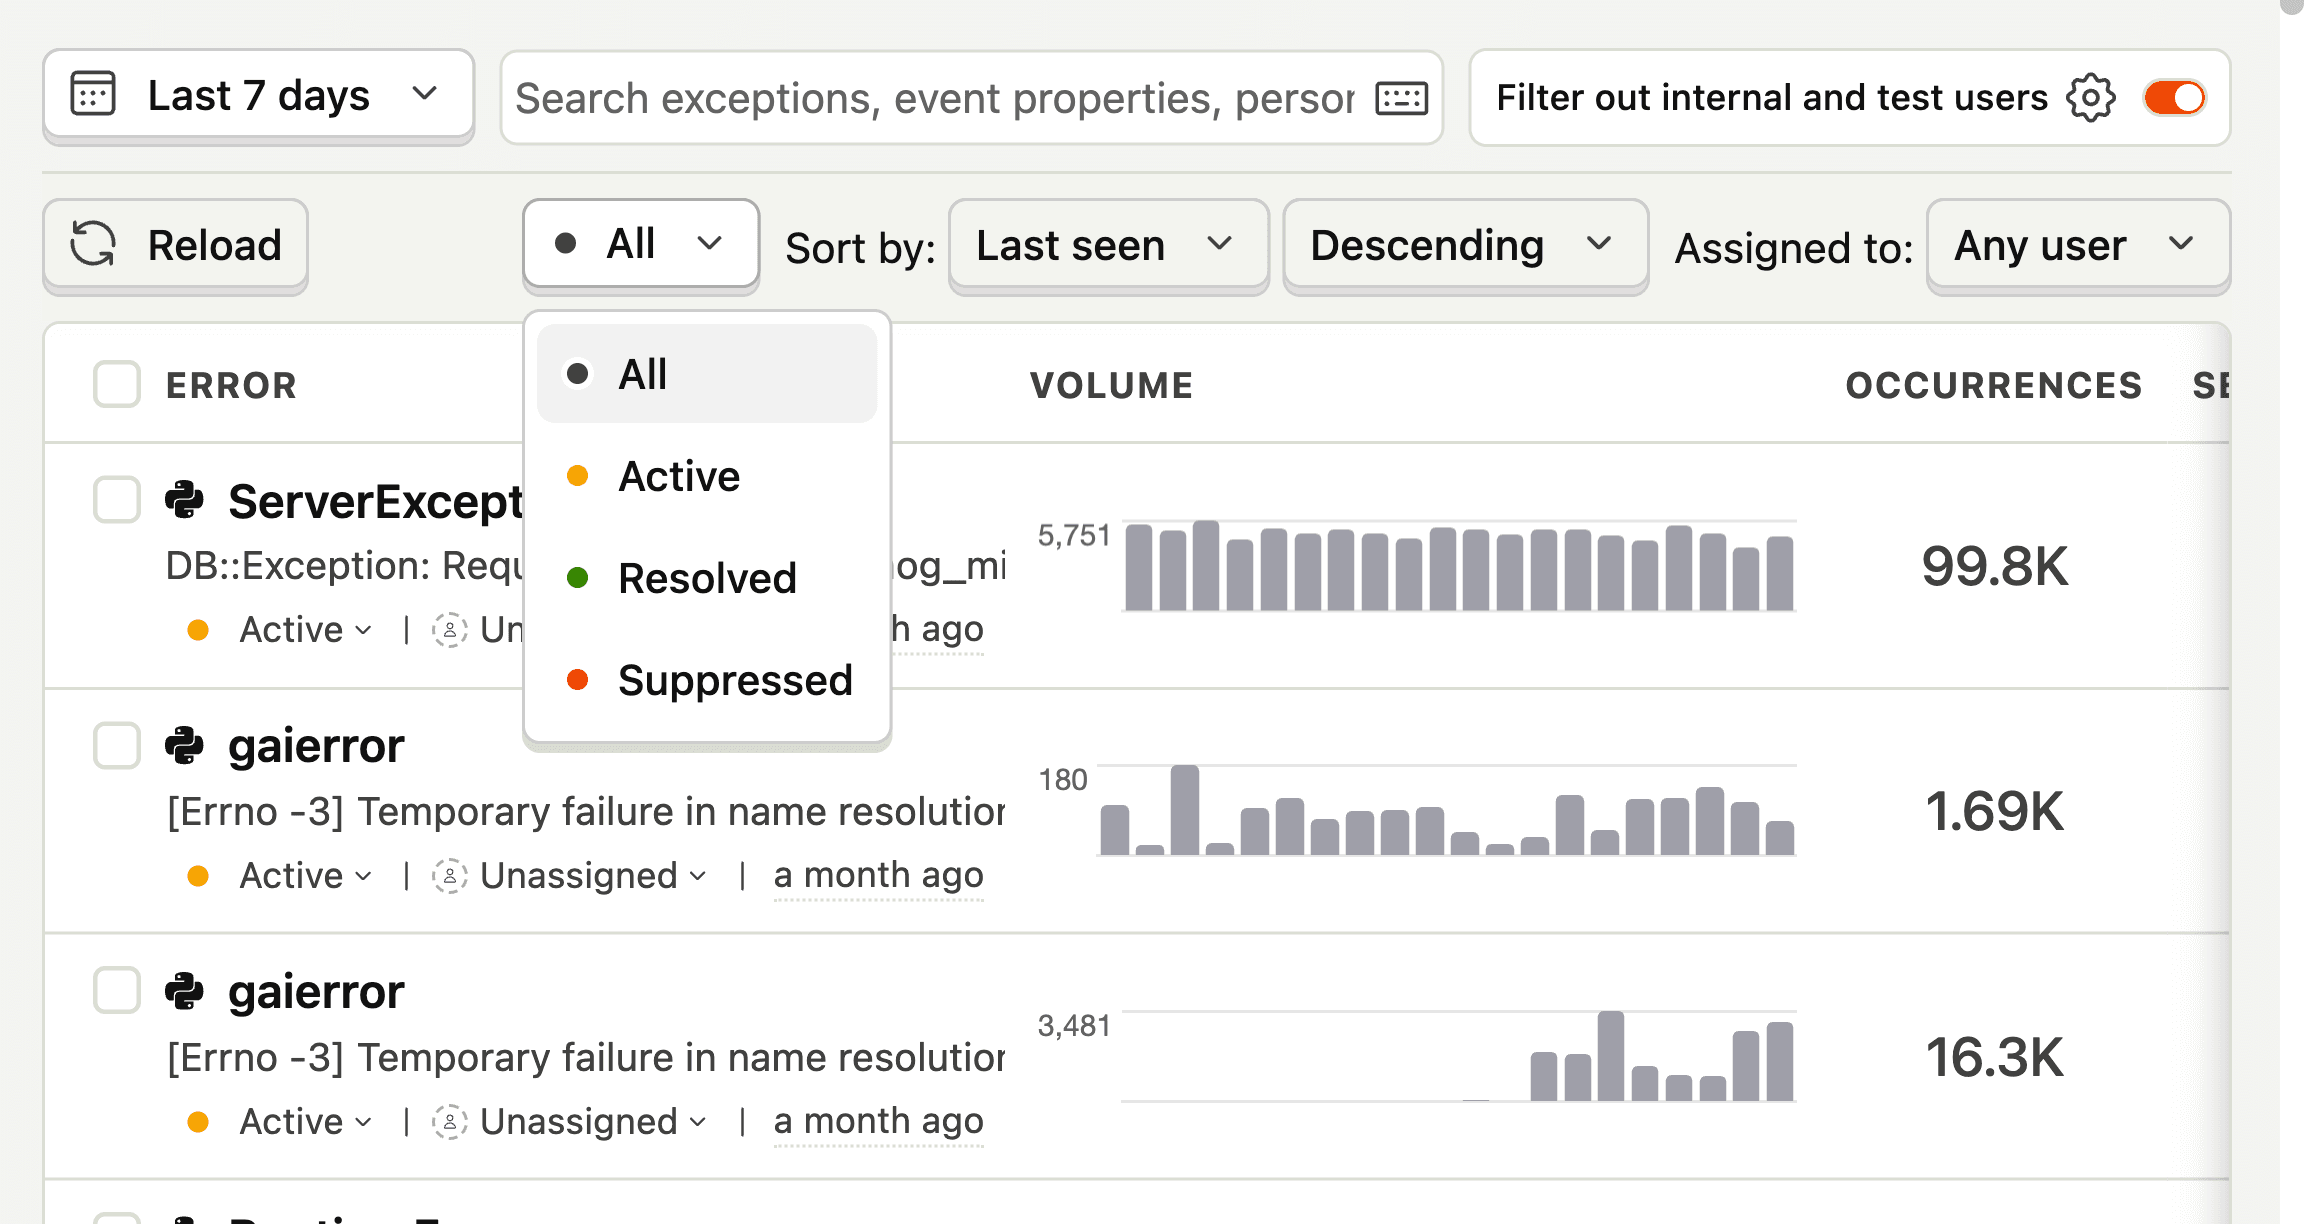
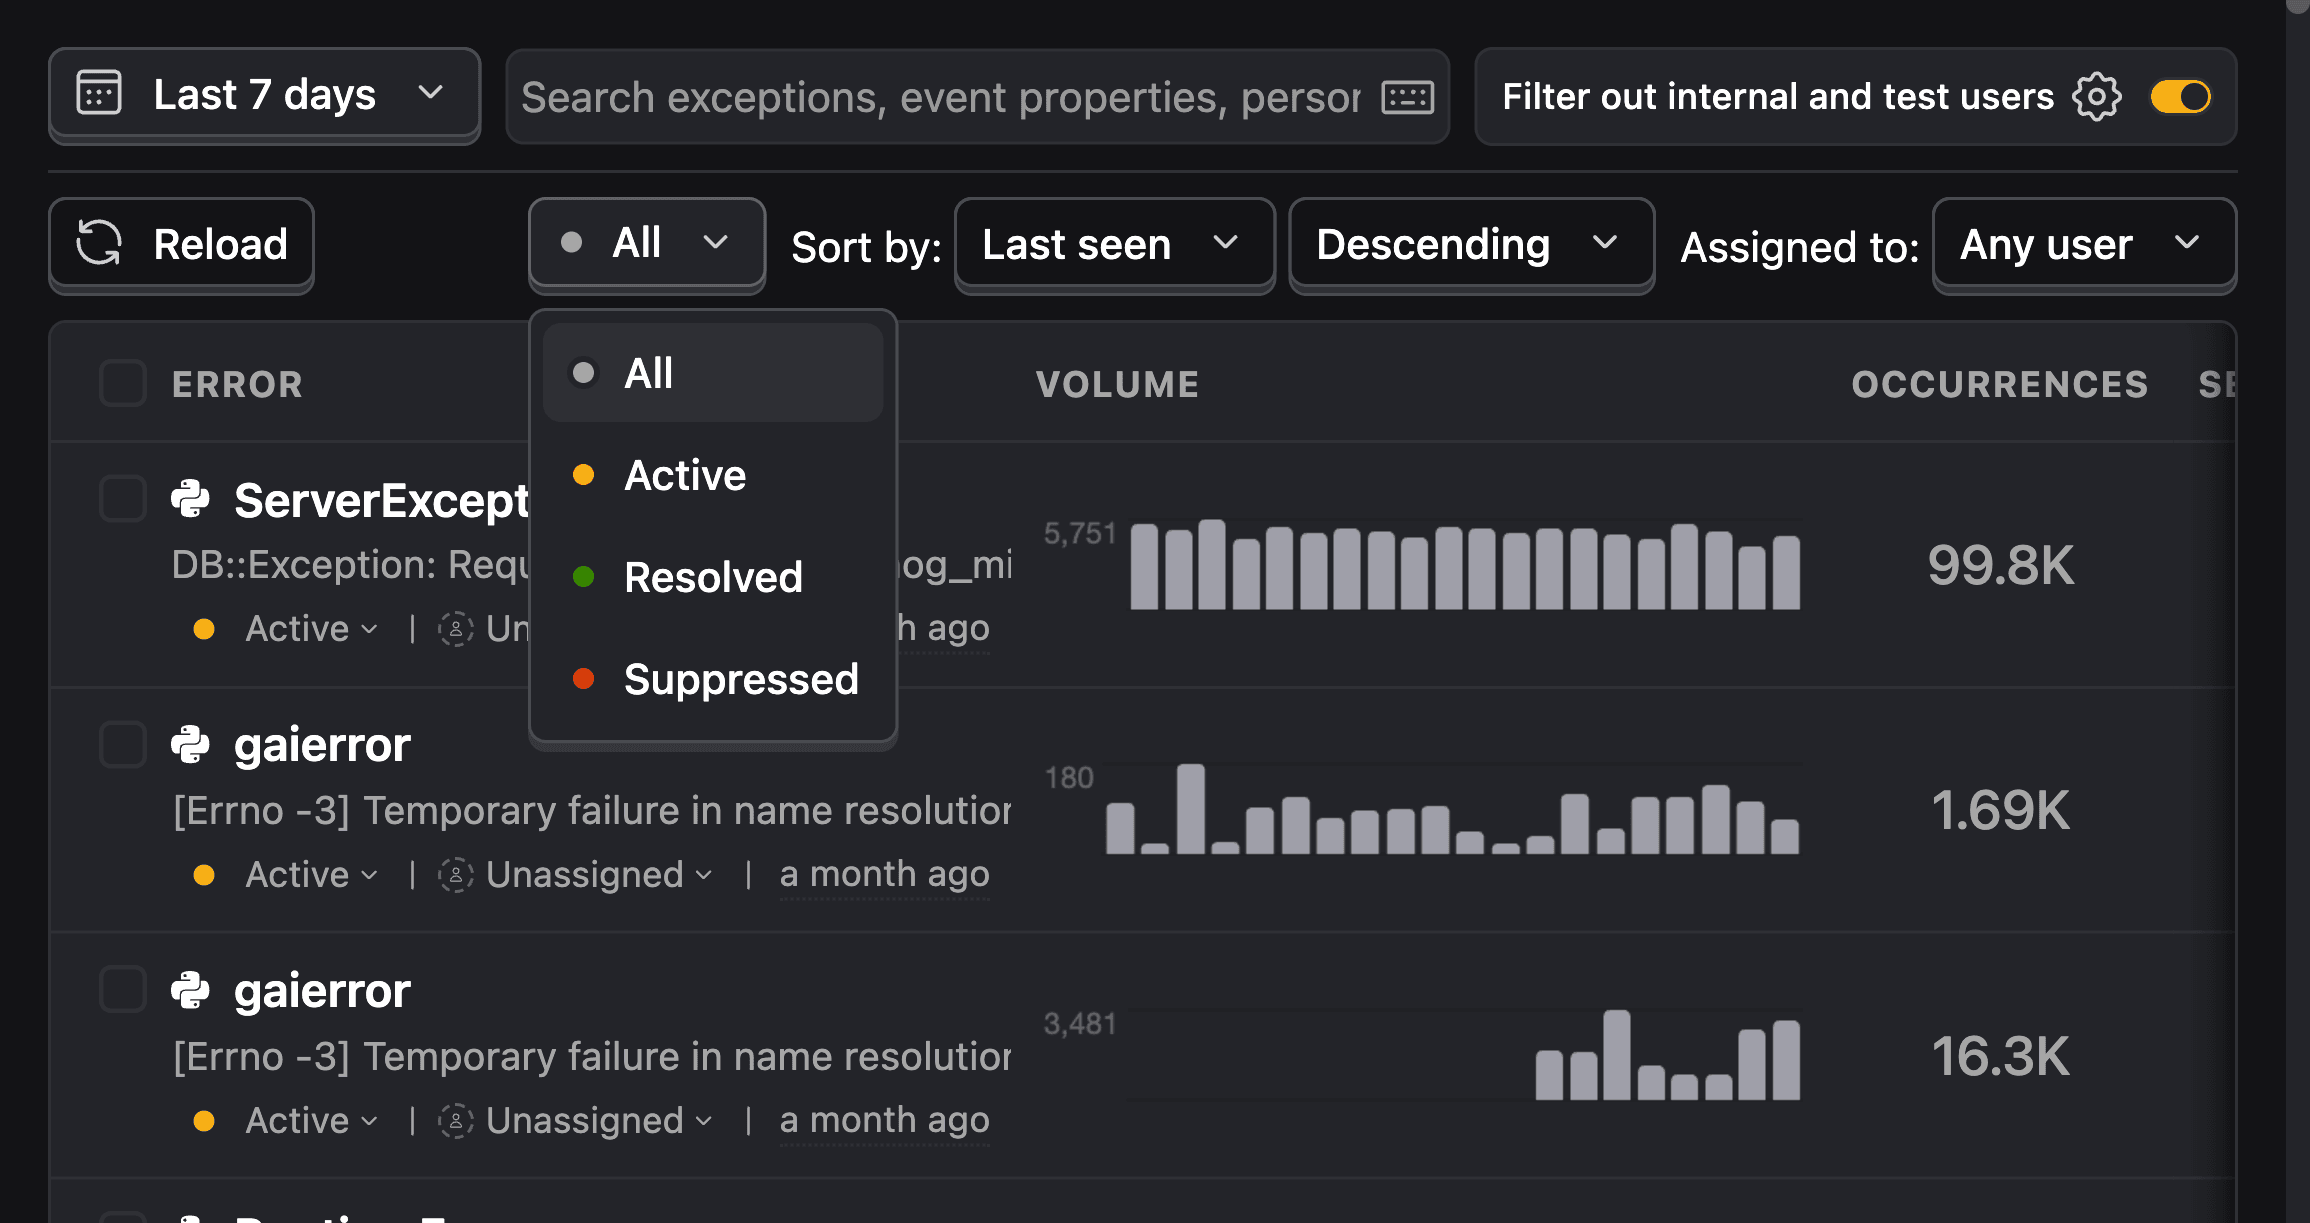
You can update the status of an issue from the issue page under Status or issue list.
All issues are marked Active by default, you can mark them as Resolved or Suppressed to reflect the current state of the issue. These labels are mainly used to communicate amongst your team.
- Resolve issues that are fixed, if they reoccur, the issue is reopened.
- Suppress issues that you choose not to action. Typically, this is used for issues that are deemed noisy or not helpful.
You can also filter issues by status in the issue list:
A common workflow is to look for all issues that are Active assigned to you or your team, and triage them to be fixed or suppressed.
View stack traces and event properties
Each issue contains detailed information about the exceptions that triggered it.
Click the Stacktrace tab to see exactly where the error occurred. Stack traces help you pinpoint the line of code and the sequence of function calls leading up to the exception.
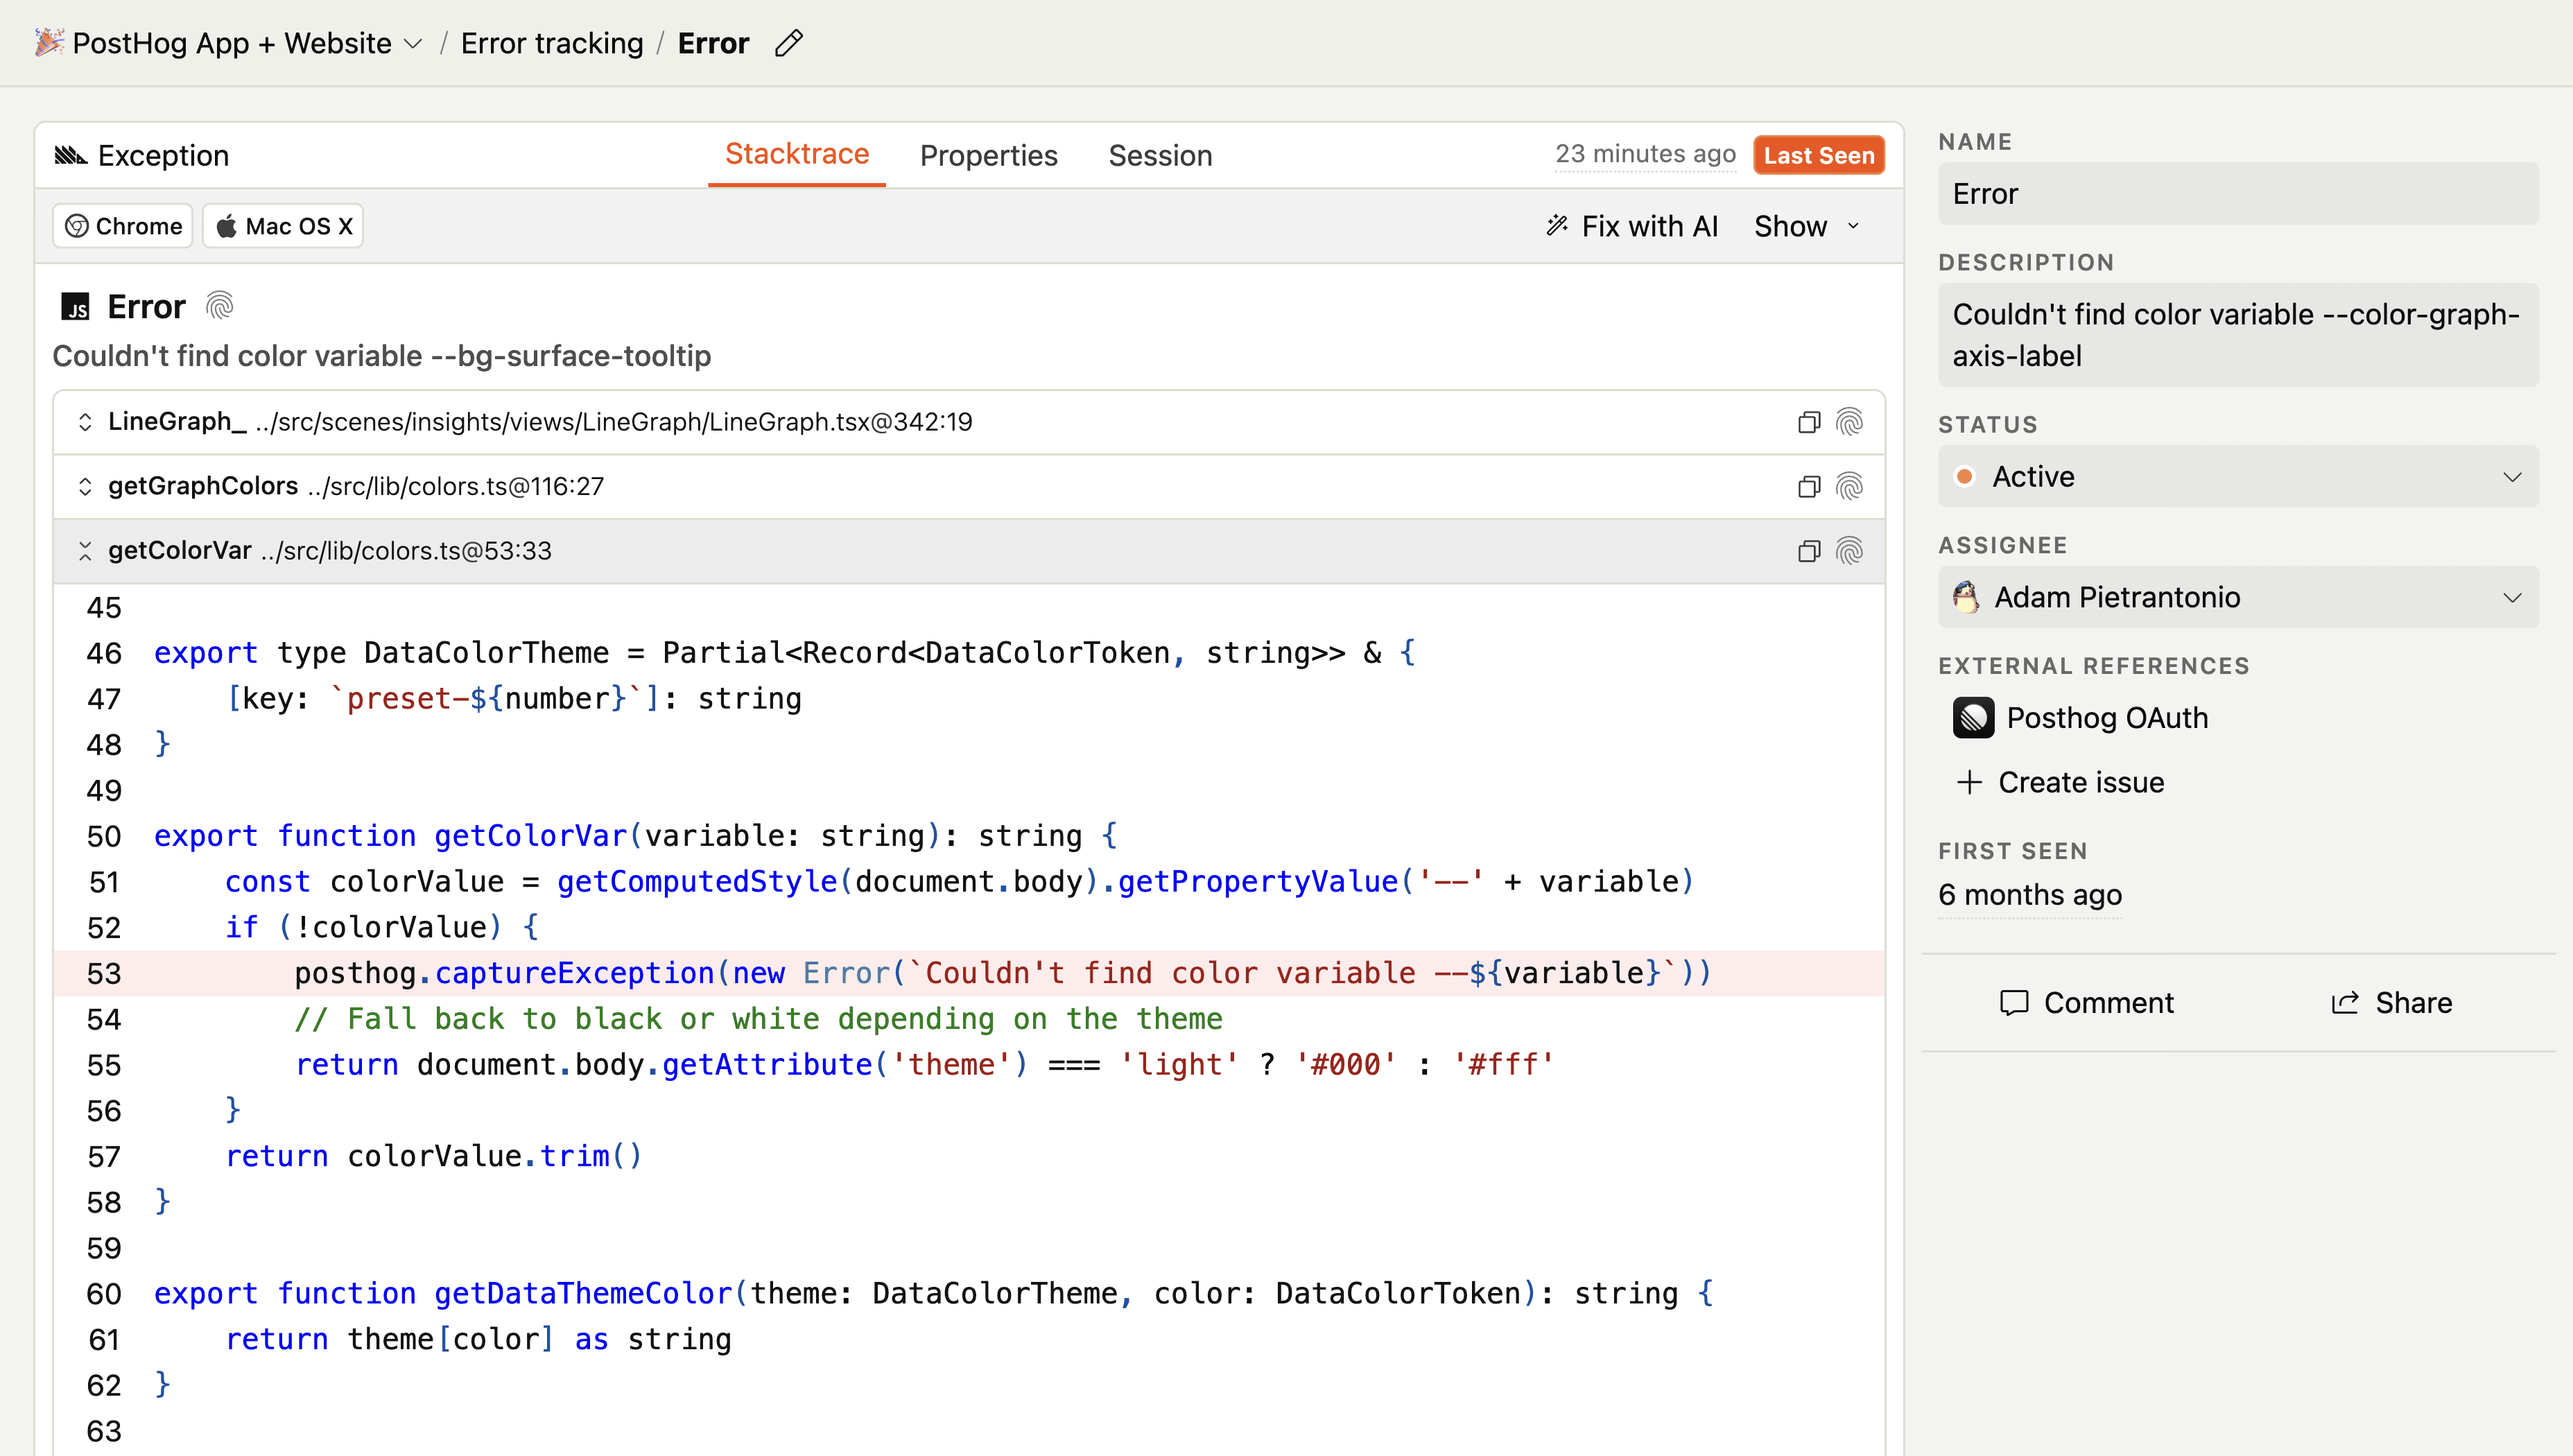
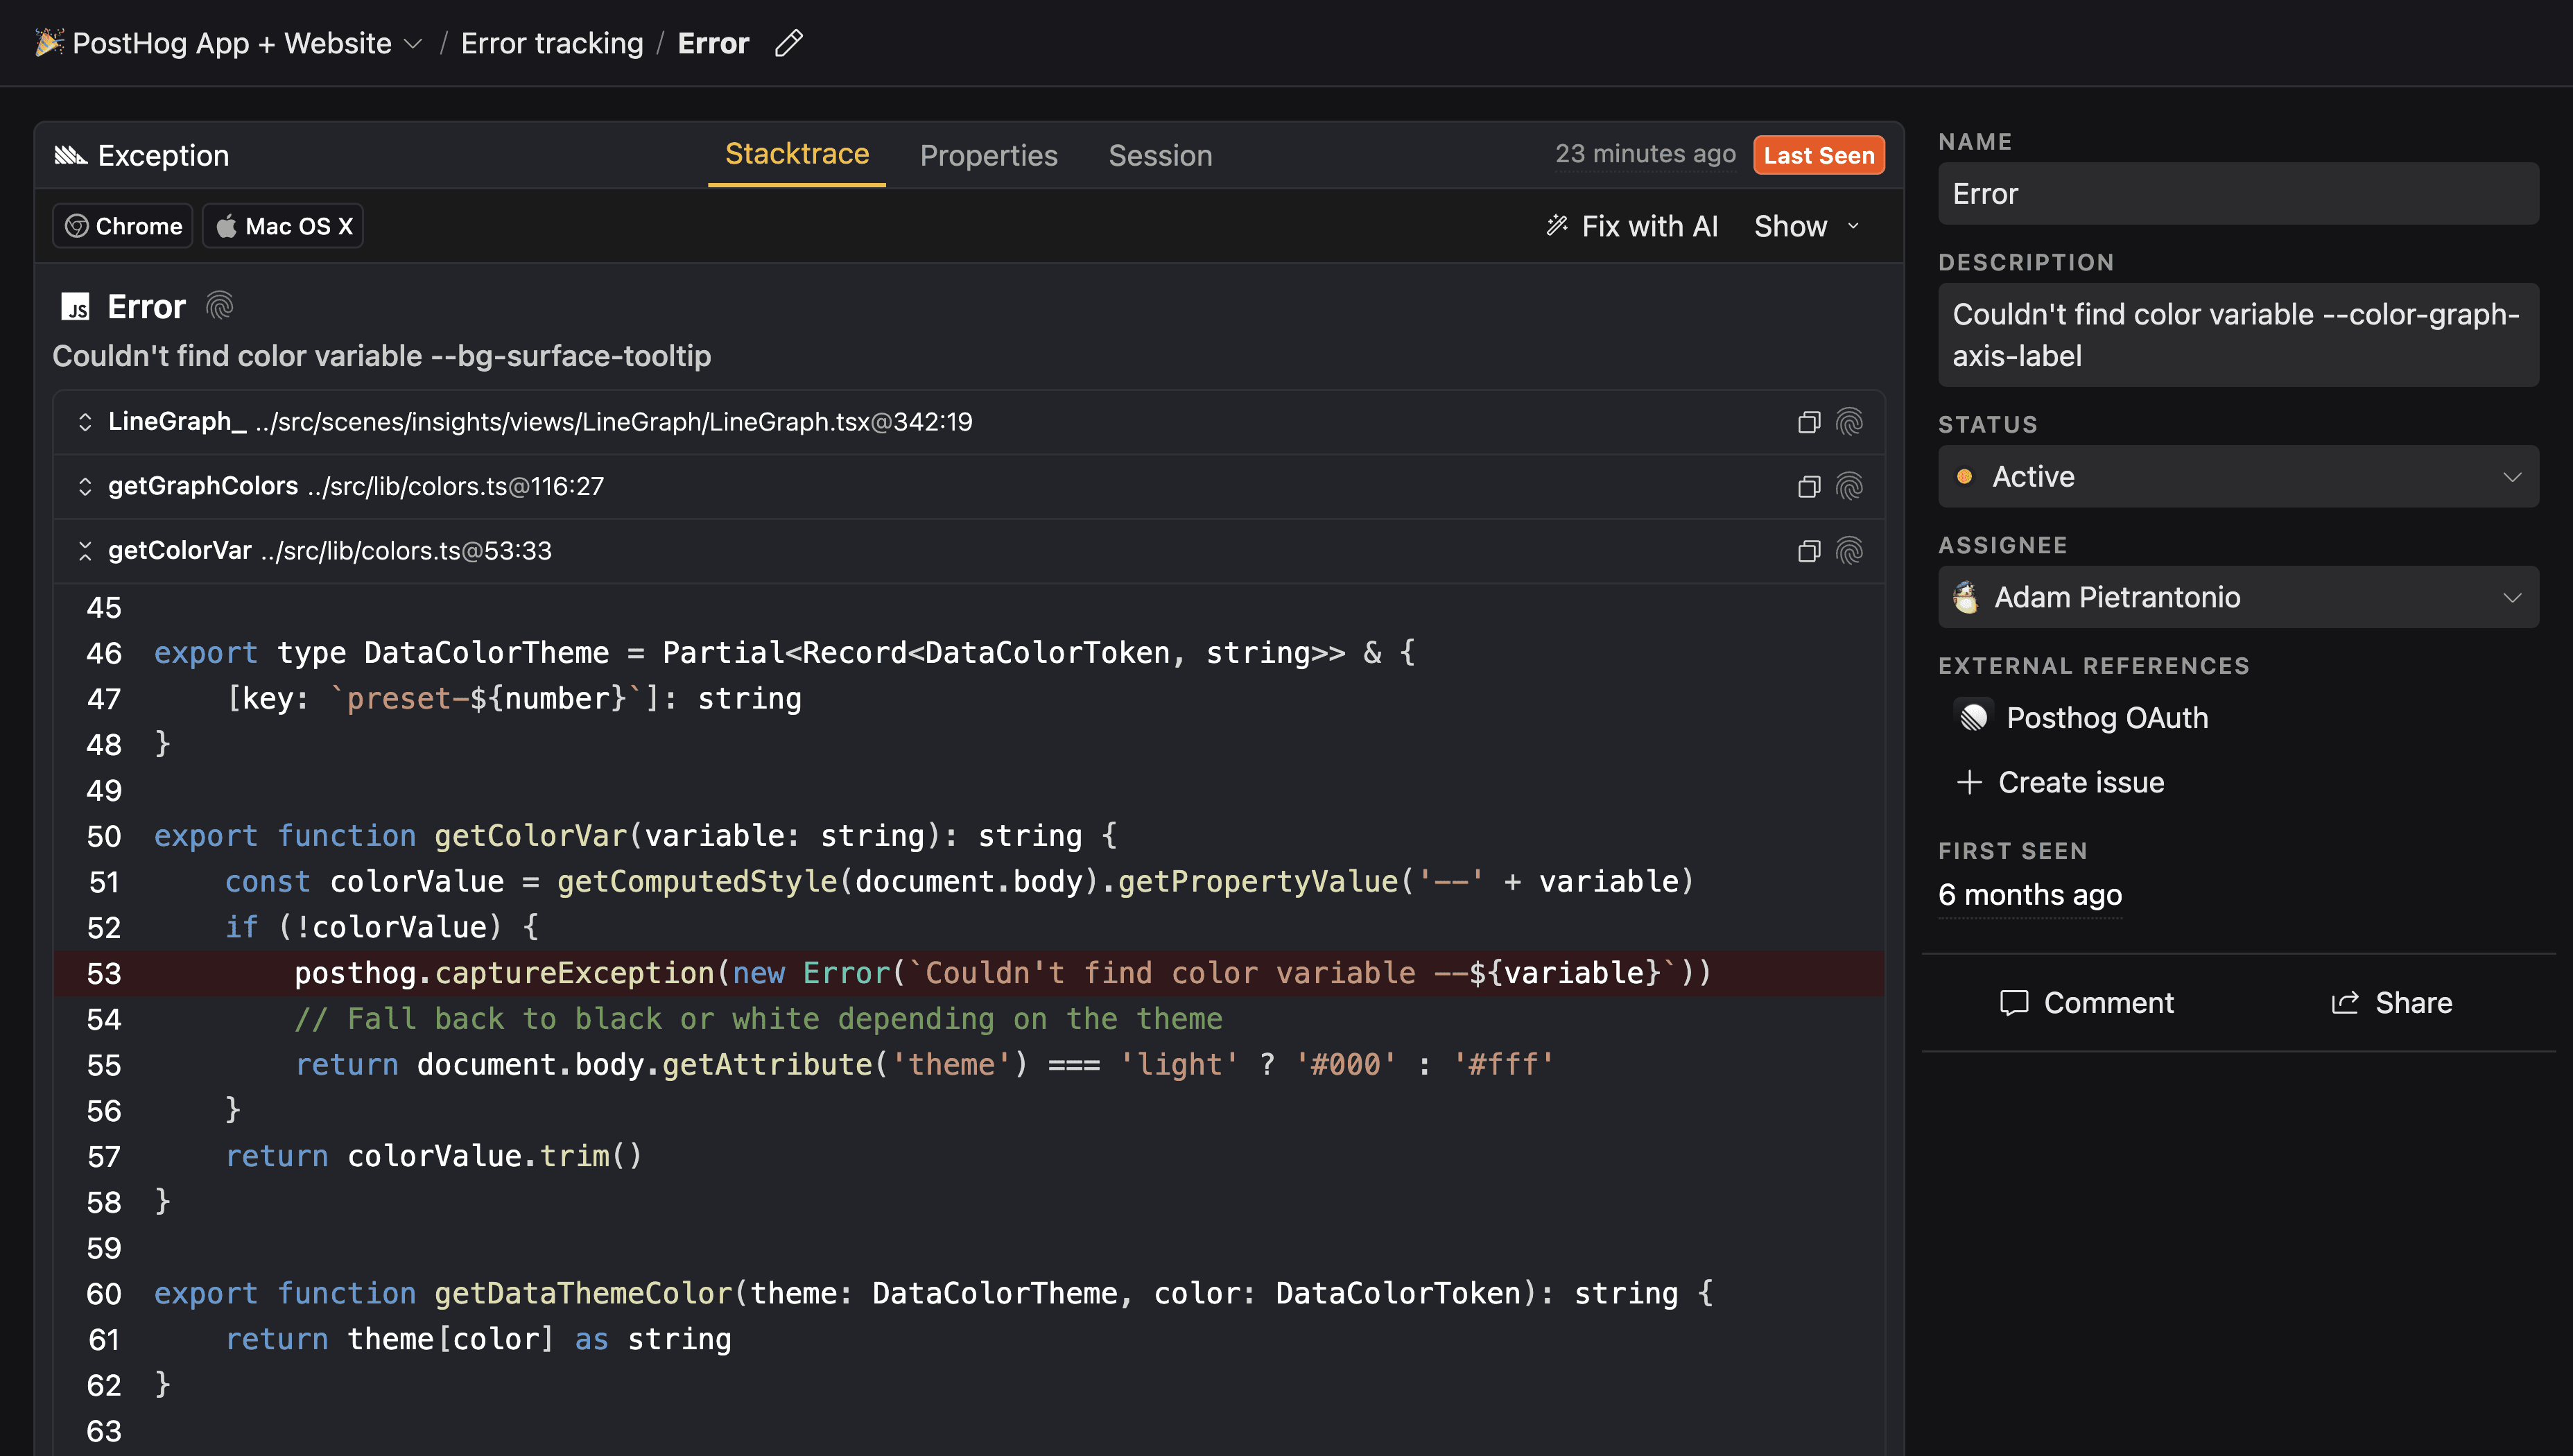
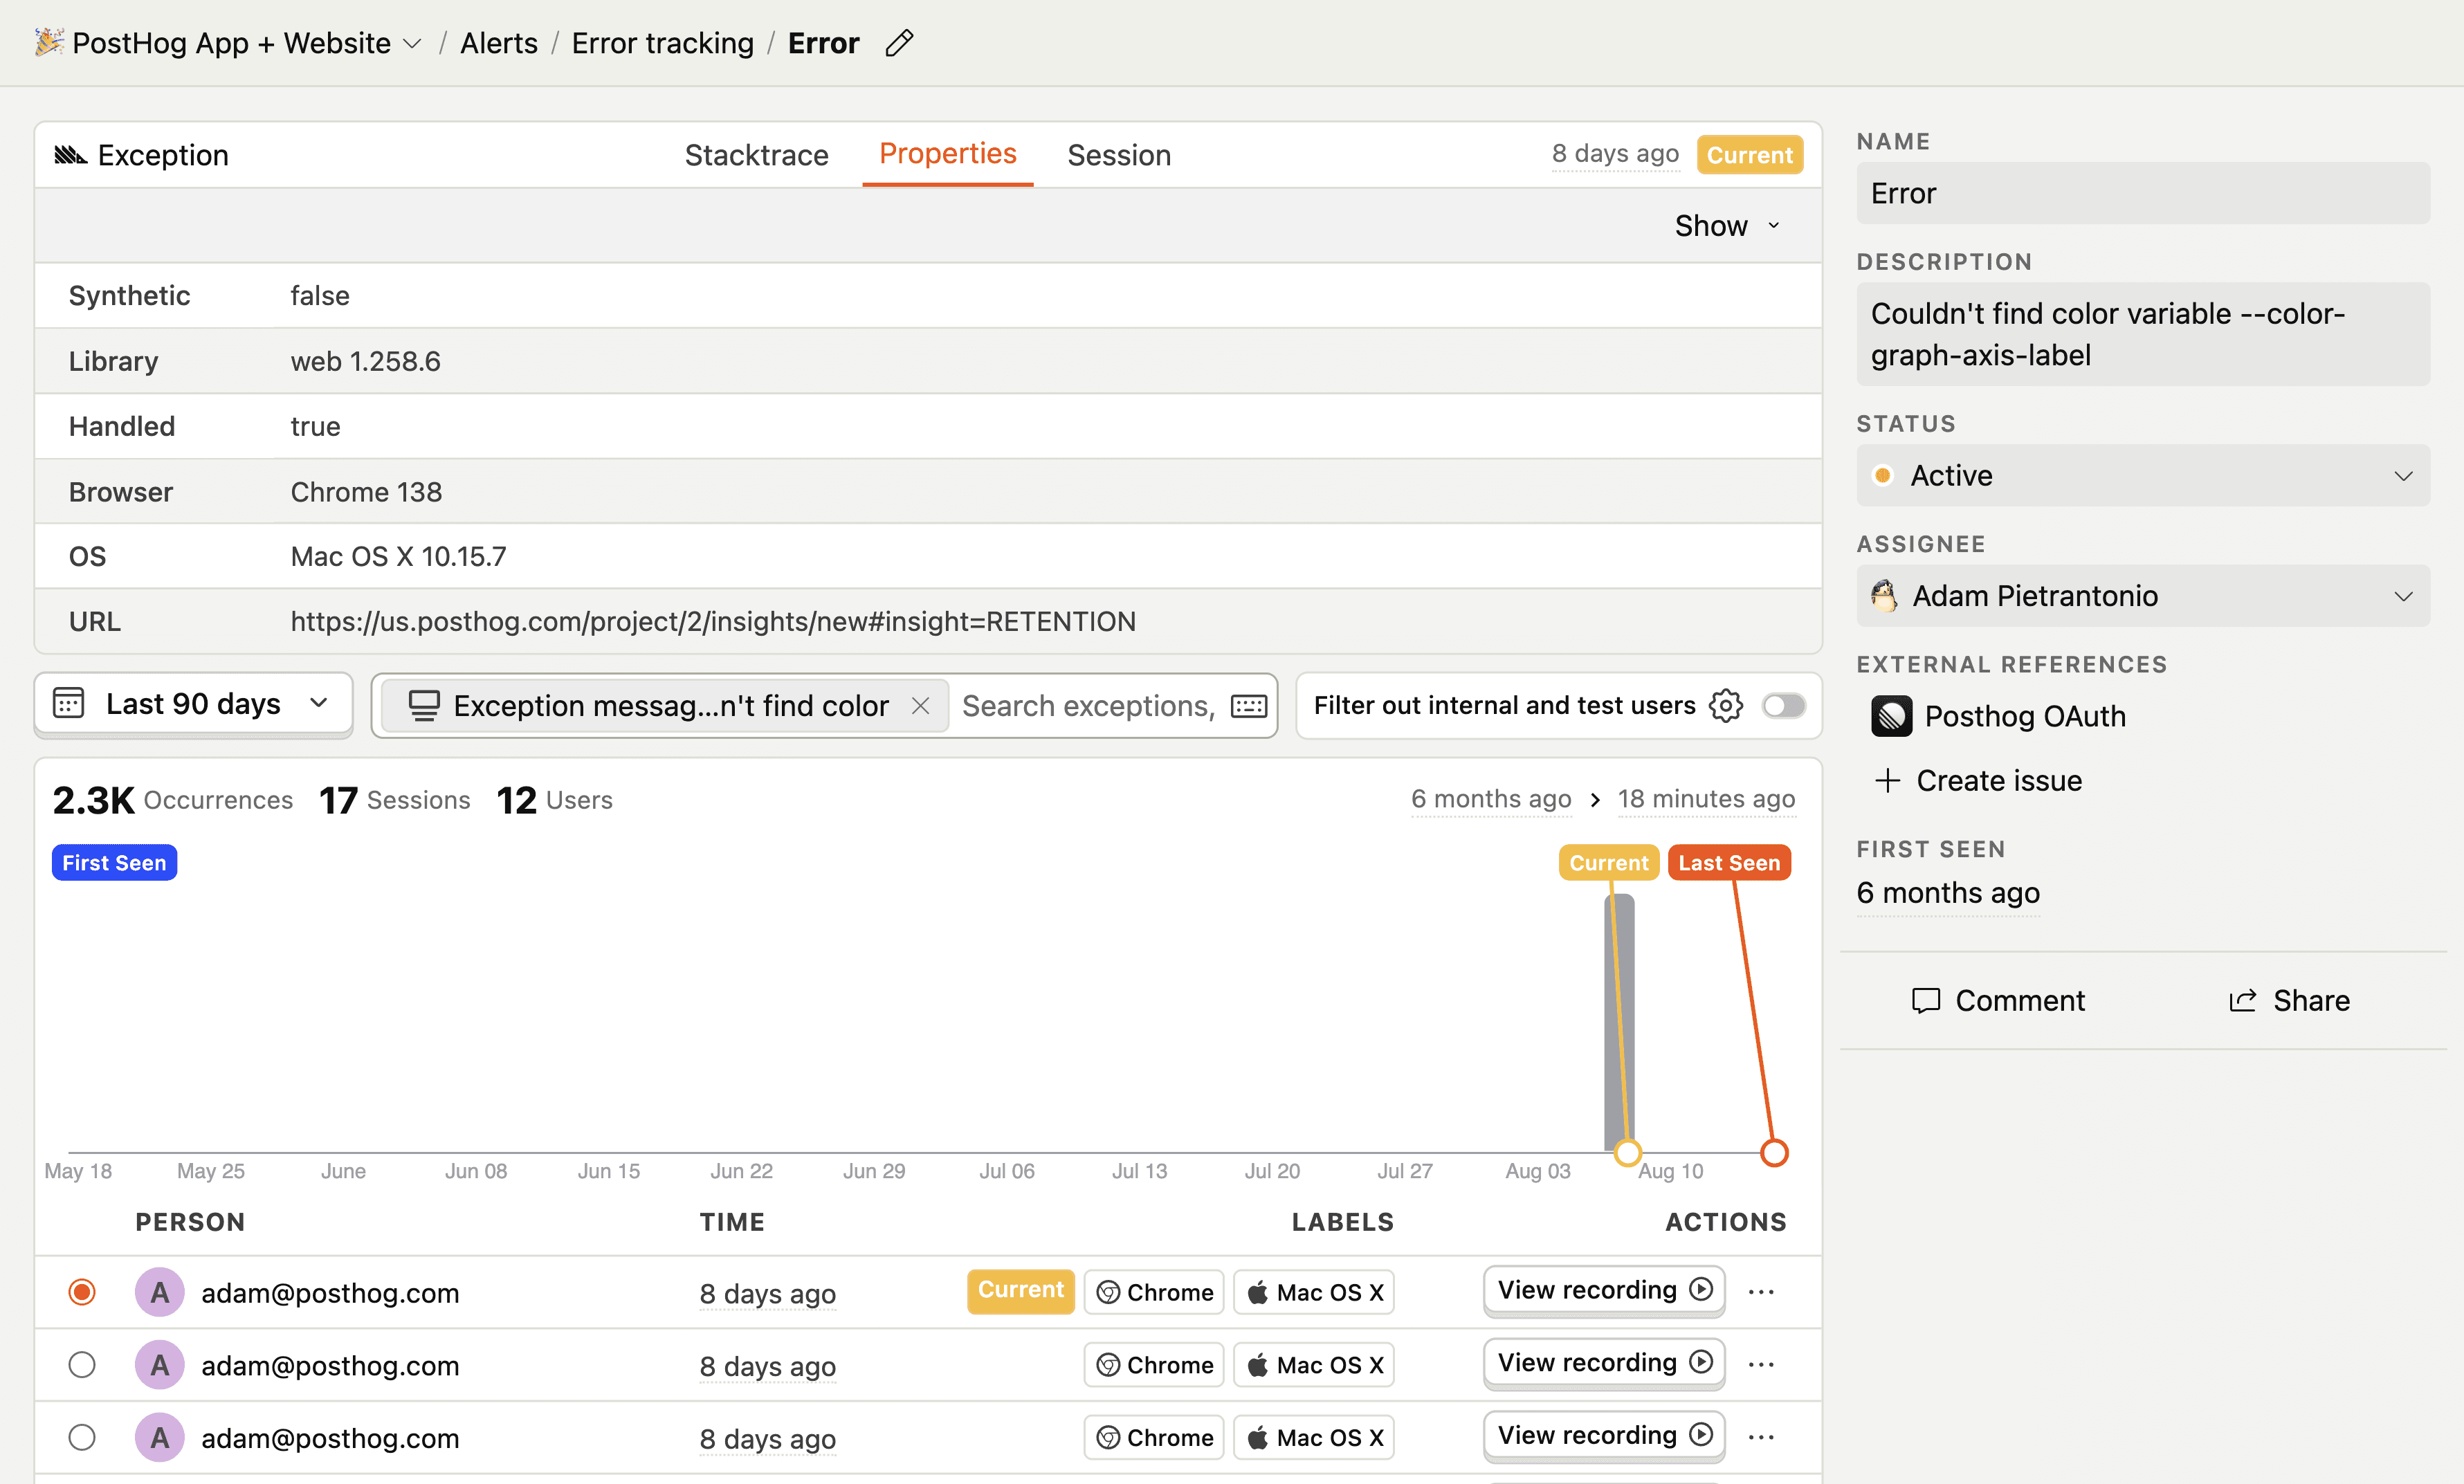
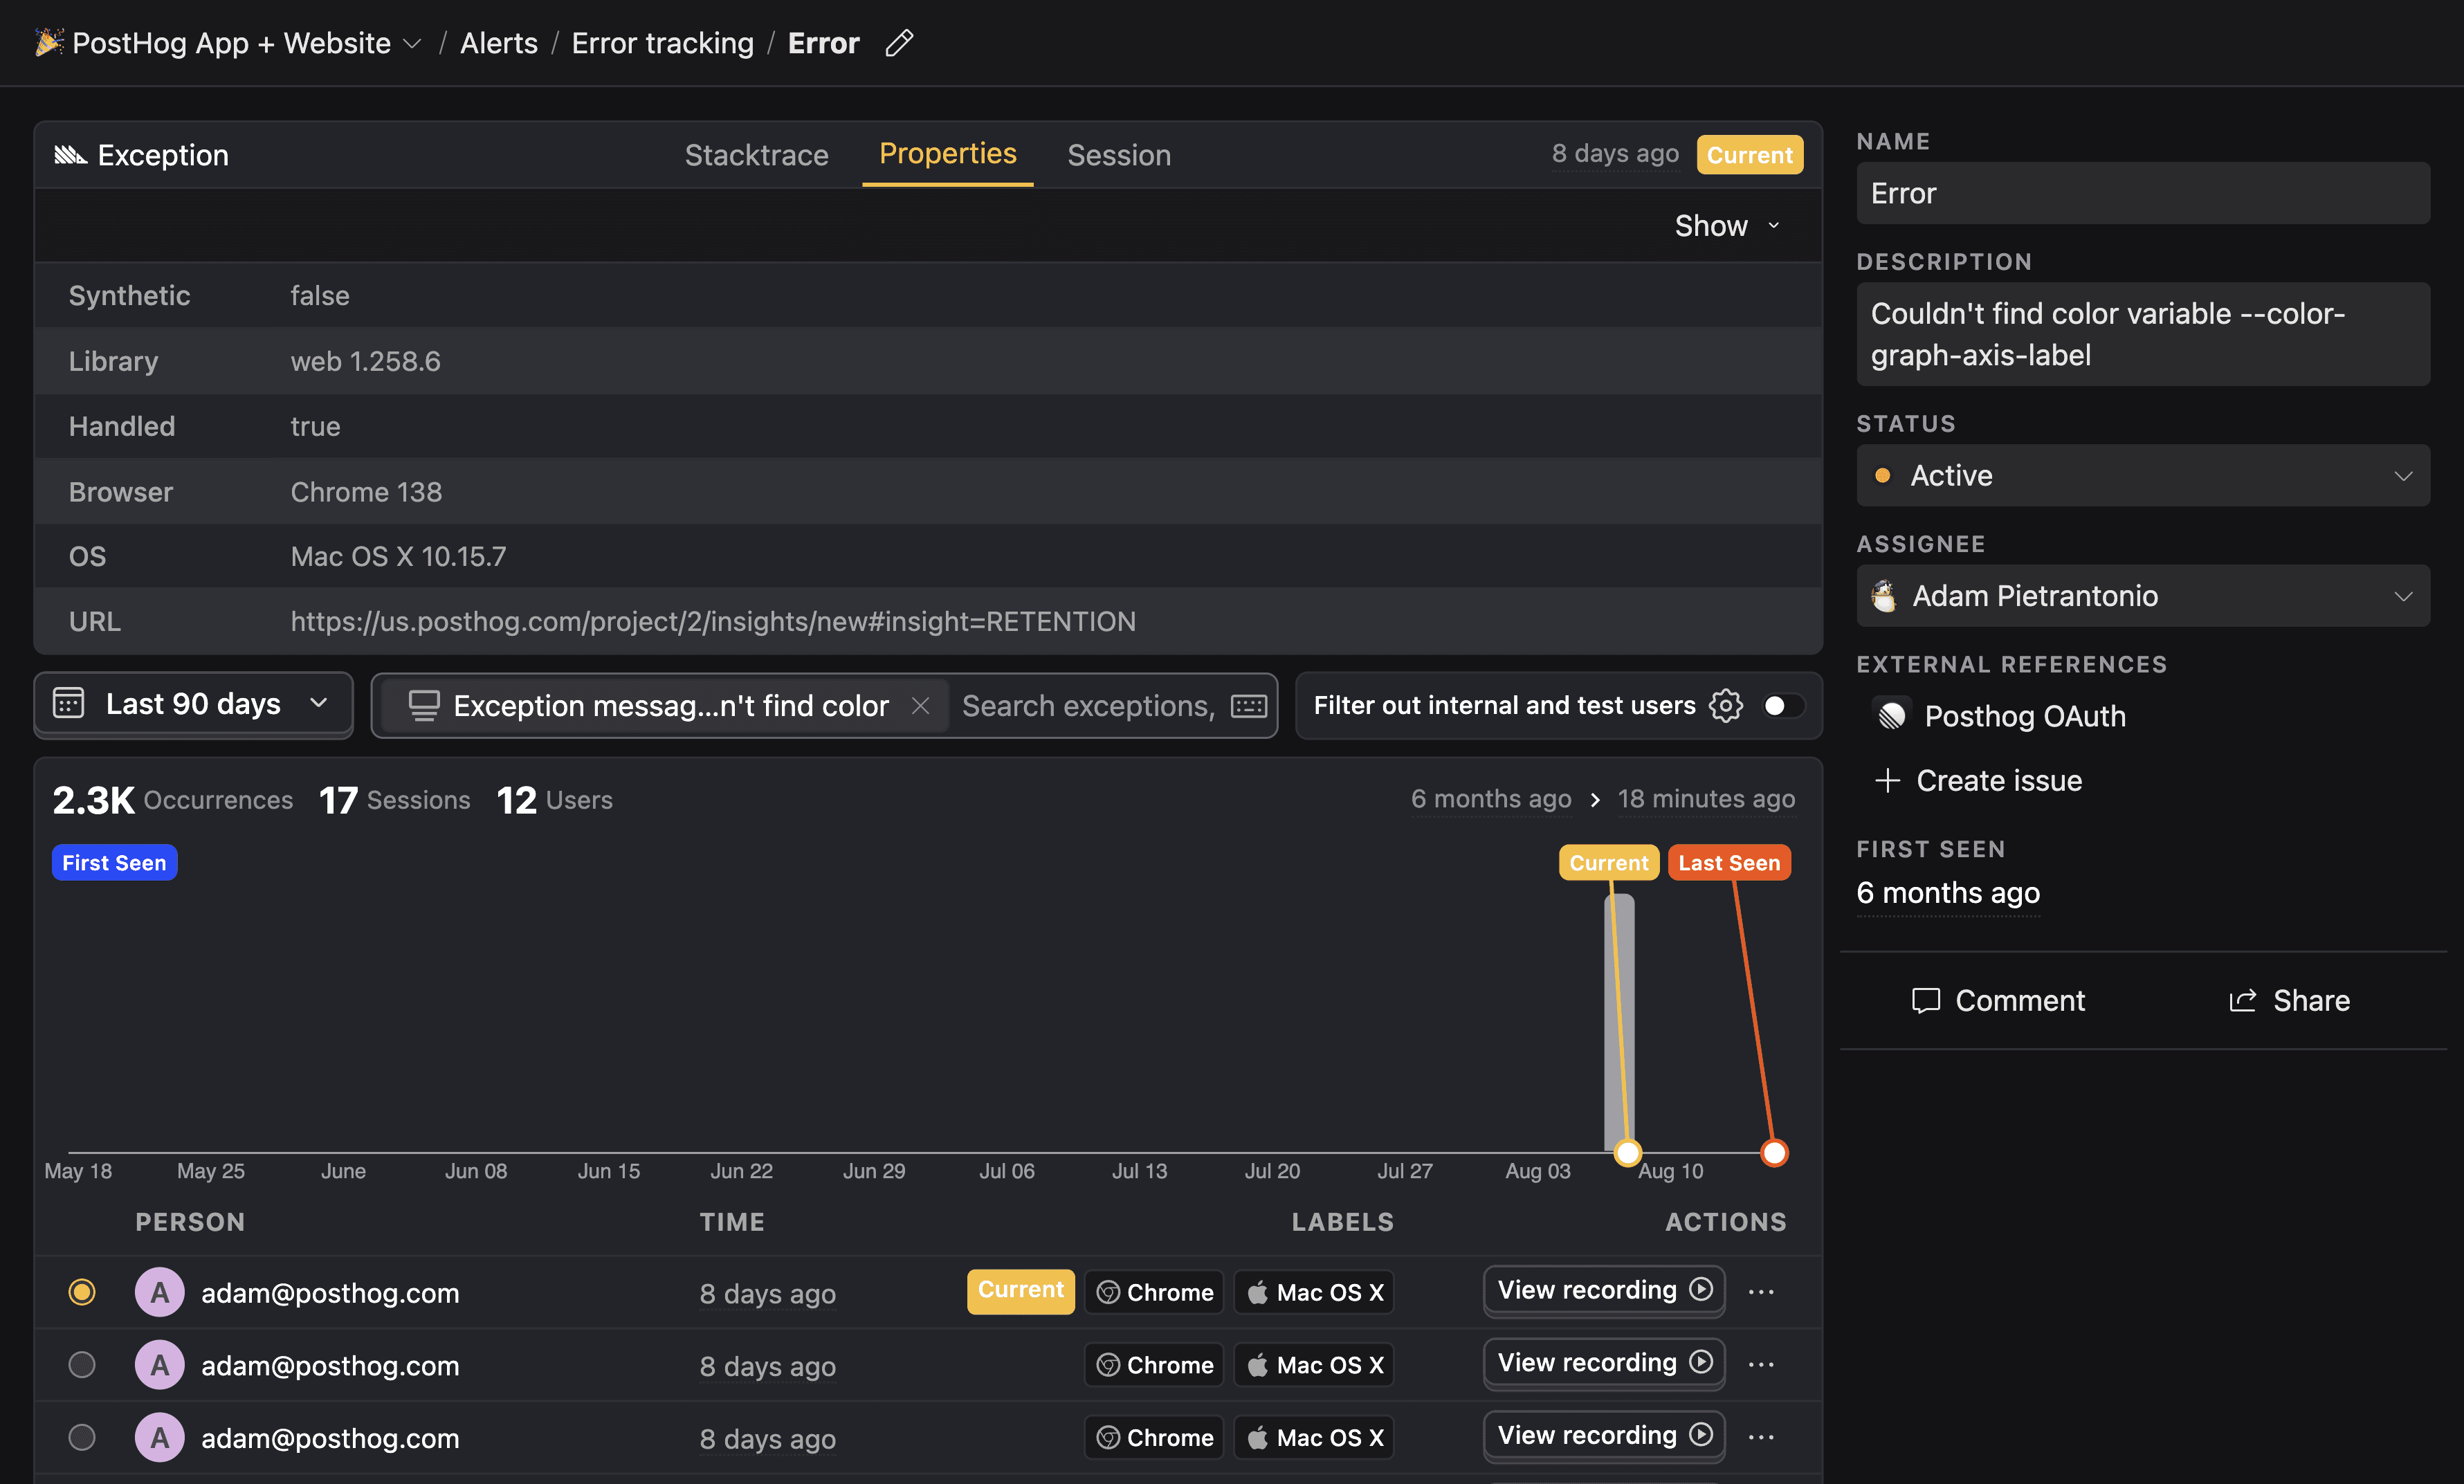
Under the Properties tab, you can view additional metadata about the exception event.
Watch session replays
Error tracking works with session replays to help you understand the context of an issue. This is useful for reproducing and debugging issues.
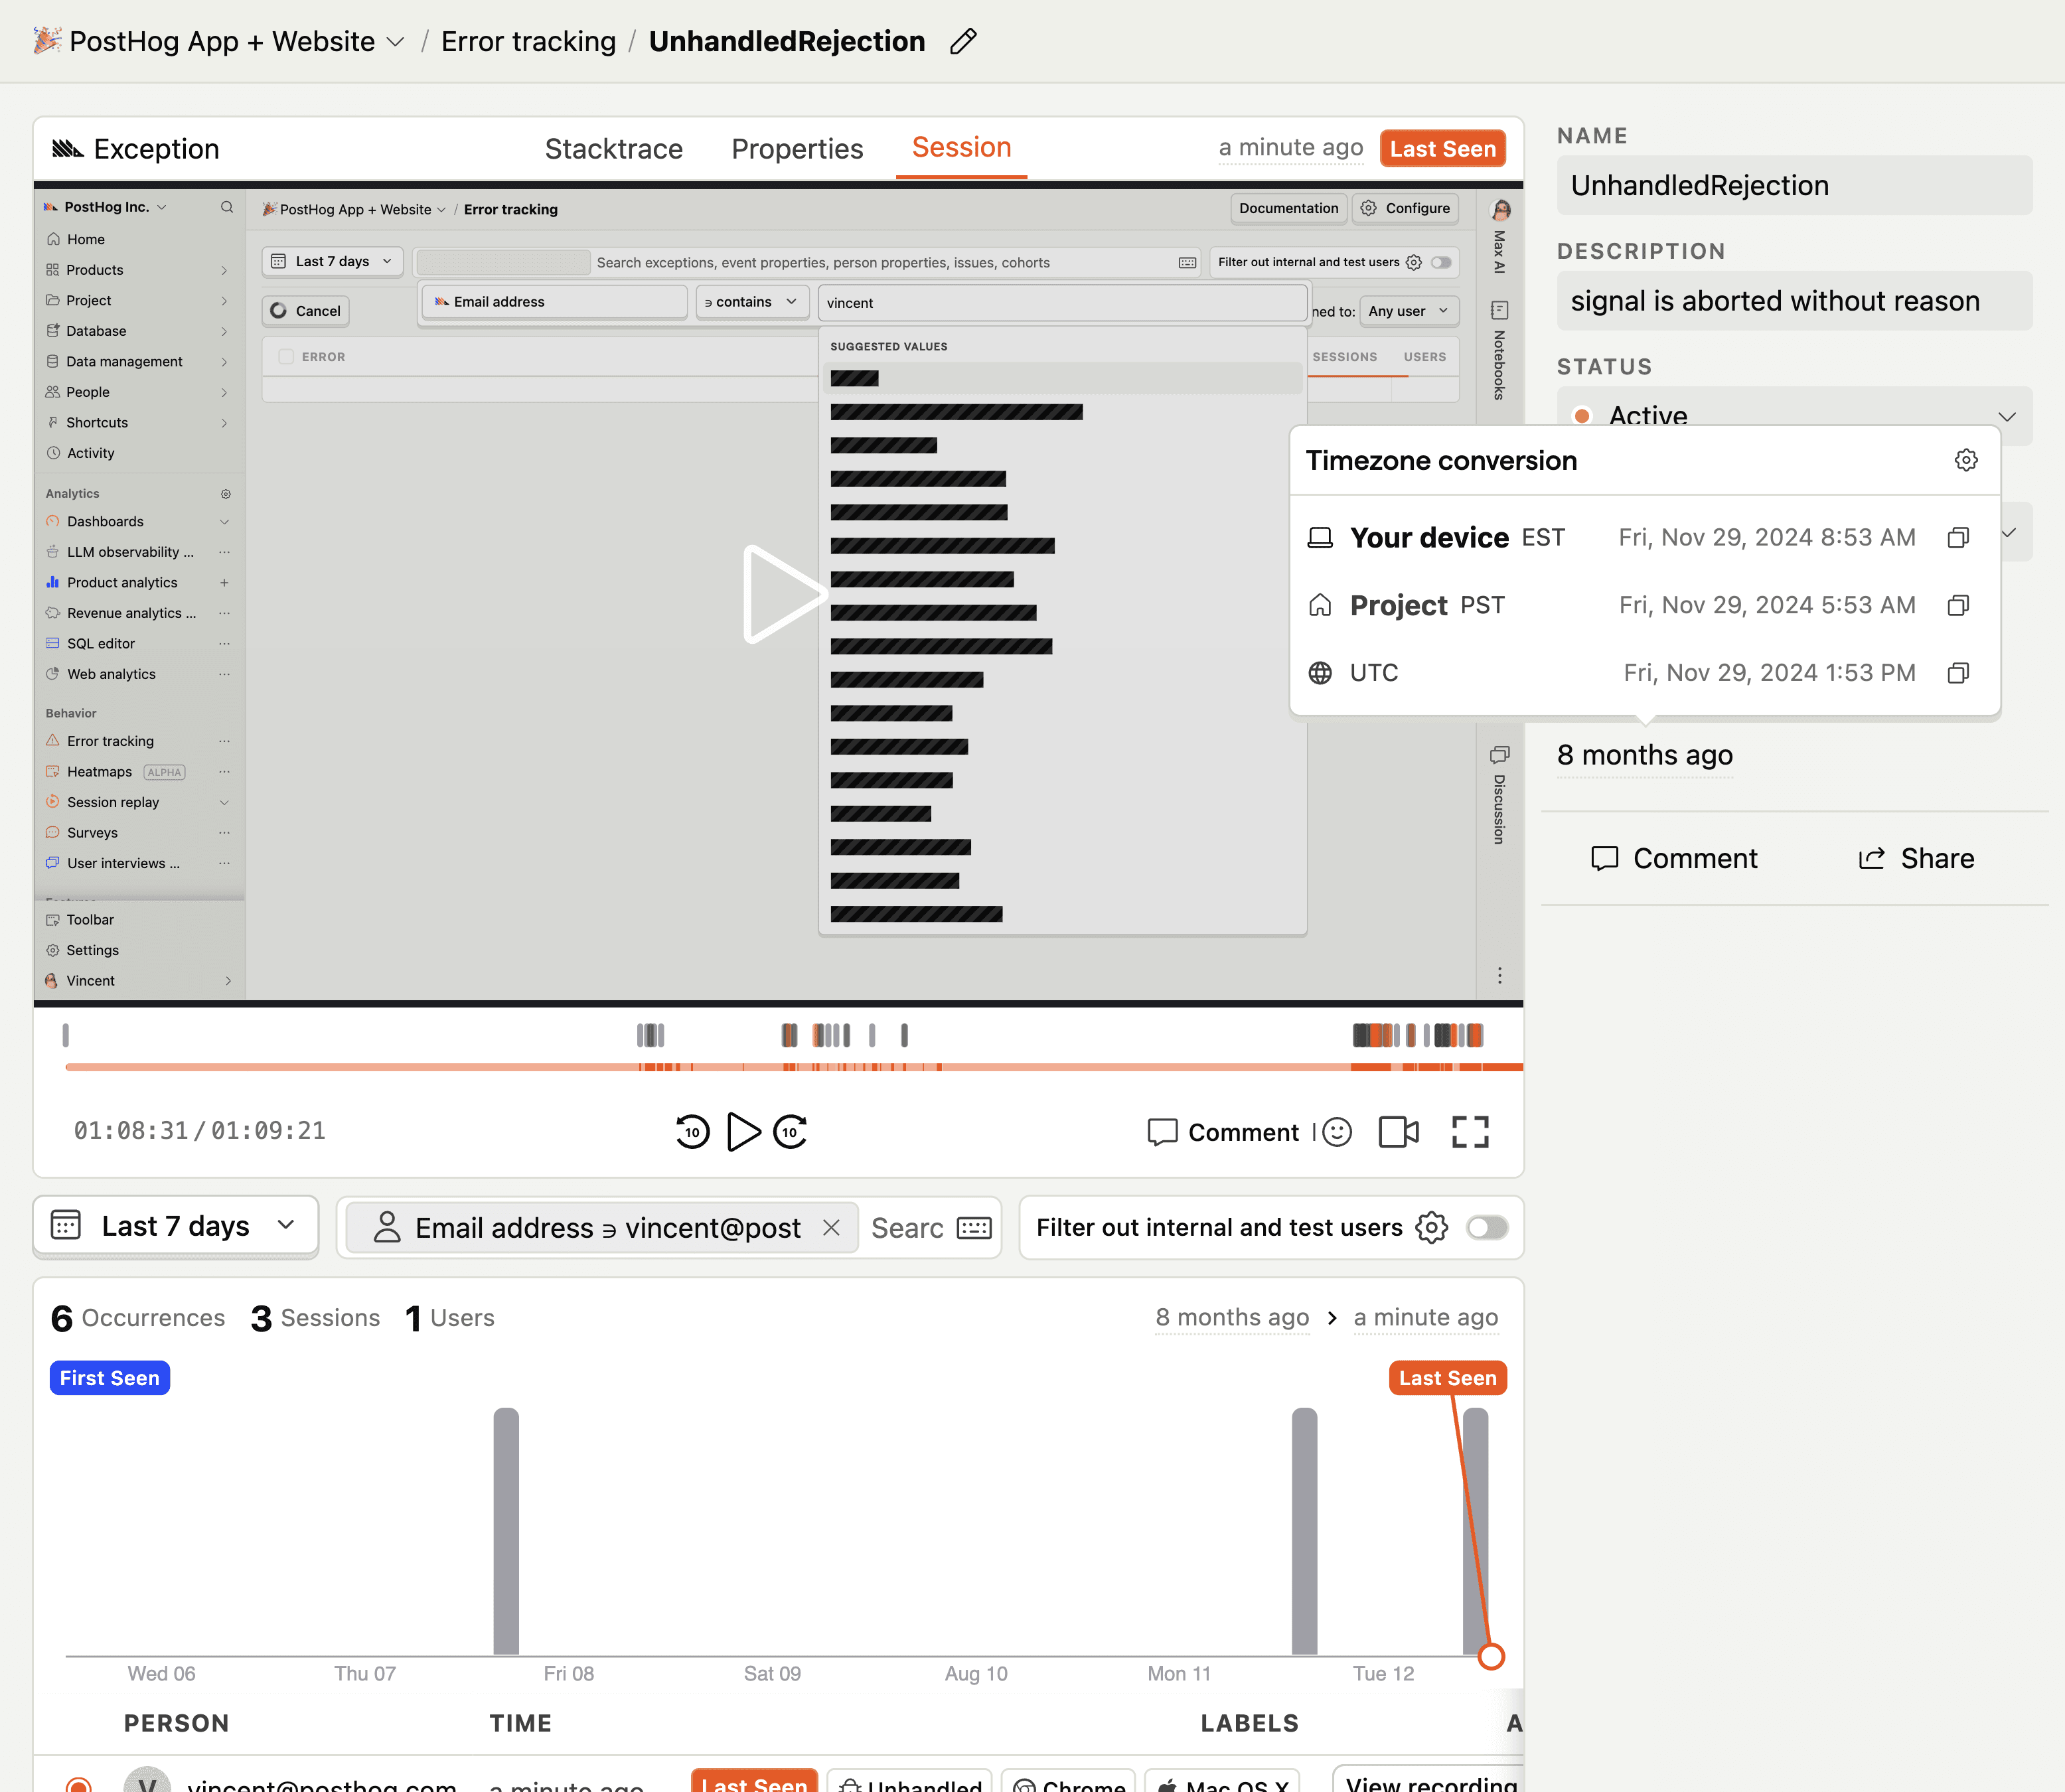
You can view a session replay for an exception by:
- Selecting an exception in the exception list and clicking the Session tab at the top of the page.
- Clicking the View recording button besides each exception.

Assign issues to teammates
Issues can be assigned to a teammate from the list or issue page. To do this, select the assignee option and search for the teammate you want to assign it to, and select them. You can click this dropdown again to remove the assignee.