


LLM analytics dashboard
Contents
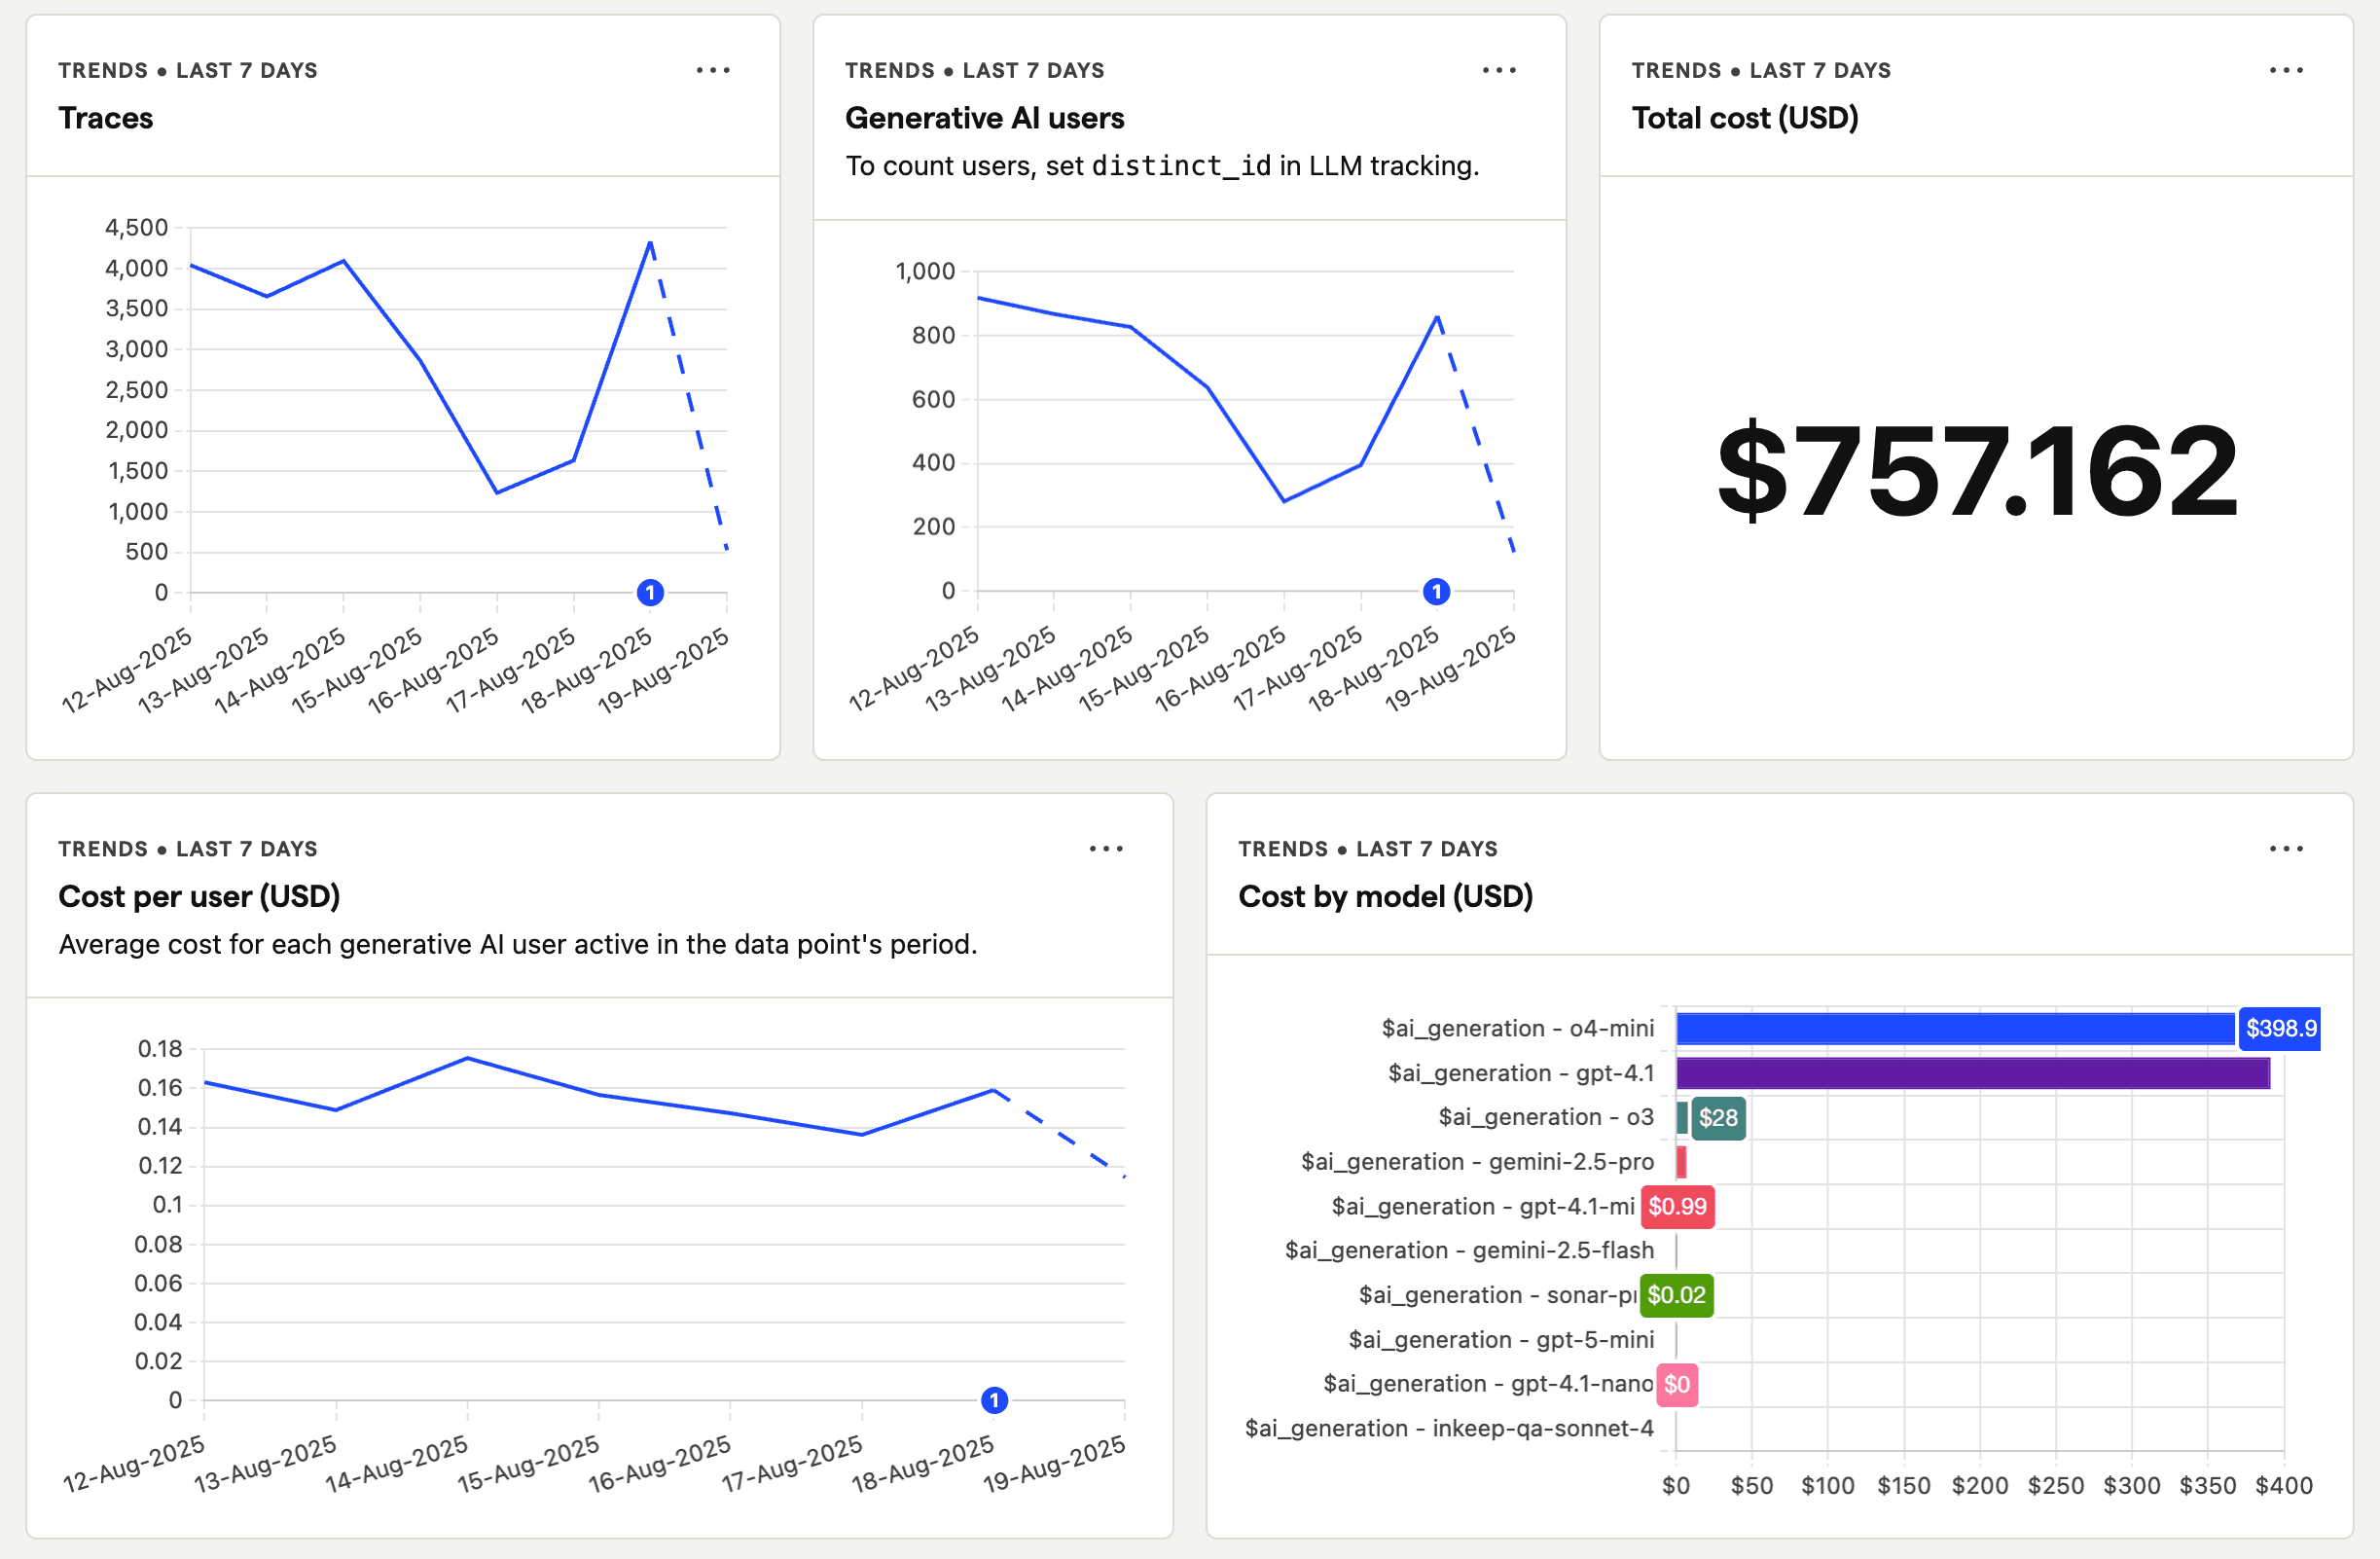
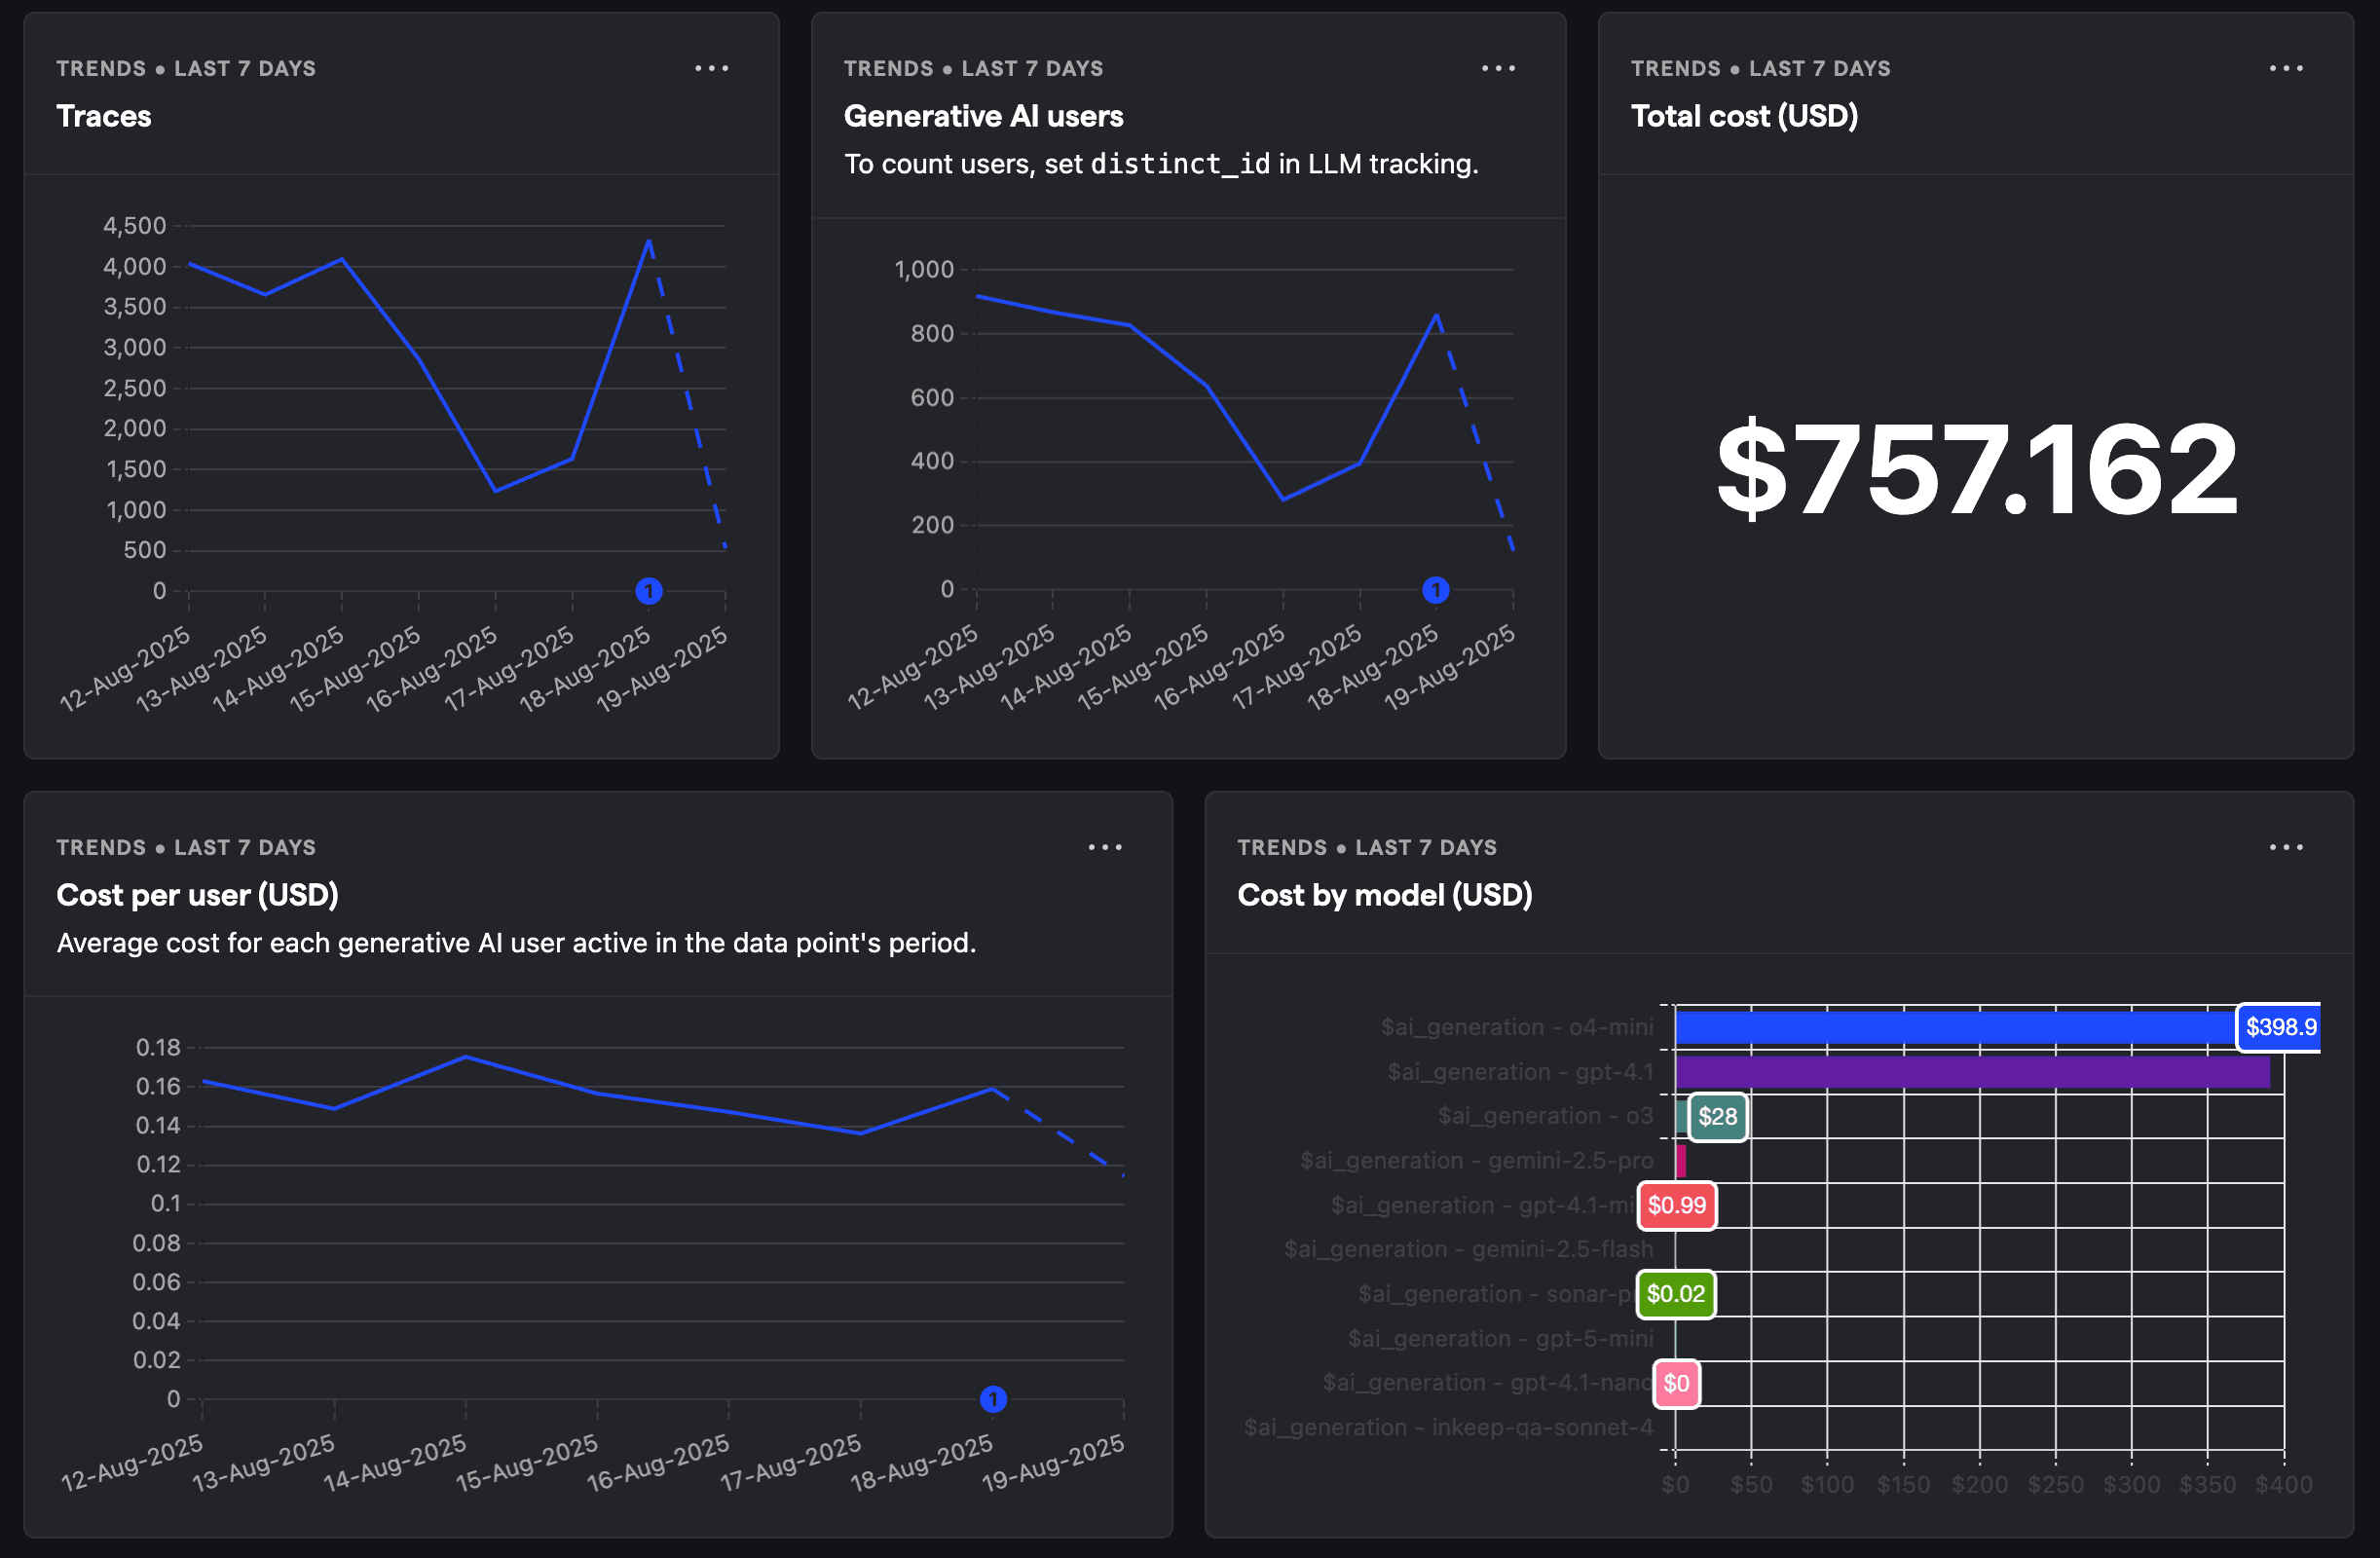
The LLM analytics dashboard provides an overview of your LLM usage and performance. Out of the box, it includes insights on:
- Users
- Traces
- Costs
- Generations
- Latency
It can be filtered like any dashboard in PostHog, including by event, person, and group properties. Our SDKs autocapture especially useful properties like provider, tokens, cost, model, and more.
Customizing the dashboard
The LLM analytics dashboard is fully customizable. You can add your own insights, add text cards, and more. To customize the dashboard:
- Head to the LLM analytics dashboard
- Click the Edit dashboard button in the top right
- Click the Add text card button to add labels, or the Add insight button to import insights
Learn more about customizing dashboards in our dashboard docs.
What can you do with the dashboard?
This dashboard is a great starting point for understanding your LLM usage and performance. You can use it to answer questions like:
- Are users using our LLM-powered features?
- What are my LLM costs by customer, model, and in total?
- Are generations erroring?
- How many of my users are interacting with my LLM features?
- Are there generation latency spikes?
To dive into specific generation events, click on the generations, traces, or sentiment tabs to explore your LLM data.