


How to calculate DAU/MAU ratio

Contents
The ratio of daily active users over monthly active users, or DAU/MAU ratio, is a popular engagement metric measuring stickiness. It shows what percentage of your users are active and use your product every day.
Products with high DAU/MAU ratios get users to return often. It shows a deep, repeated desire to use the product. Facebook popularized the DAU/MAU ratio, which they used to judge the success of their products (and still do).
This tutorial provides examples of good DAU/MAU ratios, touches on limitations, then provides ways to calculate and customize it in PostHog.
What is a good DAU/MAU ratio?
A good DAU/MAU ratio depends on the type of product, industry, audience, and many other factors. To get an idea of what good DAU/MAU ratios are, we can look at world-class products that care enough to report that metric.
Facebook, the popularizer of the DAU/MAU ratio, has nearly always had a ratio over 50%. As of March 2023, they had 2.04 billion daily active users and 2.99 billion monthly active users, giving them a DAU/MAU ratio of ~68%.
Snapchat, another popular consumer social app, in Q1 2023 had 383 million daily active users and 750 million monthly active users, giving them a DAU/MAU ratio of ~51%.
MetaMask, a popular crypto wallet, had a DAU/MAU ratio of ~25% in February 2022.
League of Legends, one of the most popular multiplayer online games, has 10.2M daily active users and 153.5M monthly active users in April 2023, giving it a DAU/MAU ratio of ~6%.
Tip: to benchmark your DAU/MAU ratio, look for the daily and monthly active users of competitors. Companies, especially when public, often report these numbers in financial statements or mention them in blogs, announcements, or interviews.
The limitations of the DAU/MAU ratio
Although your DAU/MAU ratio is a great measurement of engagement and stickiness, it is less relevant for products that don’t care about that or are not expecting users to engage daily. These include:
B2B SaaS: many B2B SaaS users have no choice but to use the product. Their employer chooses a product and they come along for the ride. The DAU/MAU ratio doesn’t provide valuable insights. Instead, these companies care more about adoption, retention, feature usage, and net promoter score. Read "The most useful B2B SaaS product metrics" for more.
Ecommerce: transactions happen less frequently than daily, meaning DAU/MAU ratio will be low. Daily transactions are not expected here – few people order books from Amazon or clothes from H&M daily. These companies care more about conversion, order value, lifetime value, and customer acquisition costs.
Travel: like ecommerce, people travel infrequently. For example, Airbnb users only book a couple of trips per year. Even apps like Uber care more about weekly active users, as they don’t expect users to ride or order daily. These companies care about similar metrics to commerce companies, like conversion, lifetime value, and customer acquisition cost.
How to calculate your DAU/MAU ratio
In PostHog, create an insight with two series, one for "pageviews" aggregated by "unique users" and another for "pageviews" aggregated by "monthly active users," then use enable formula mode, and use the formula A/B. Use a trend or a number chart to visualize with the Y-axis unit set to "Percent (0-1)."
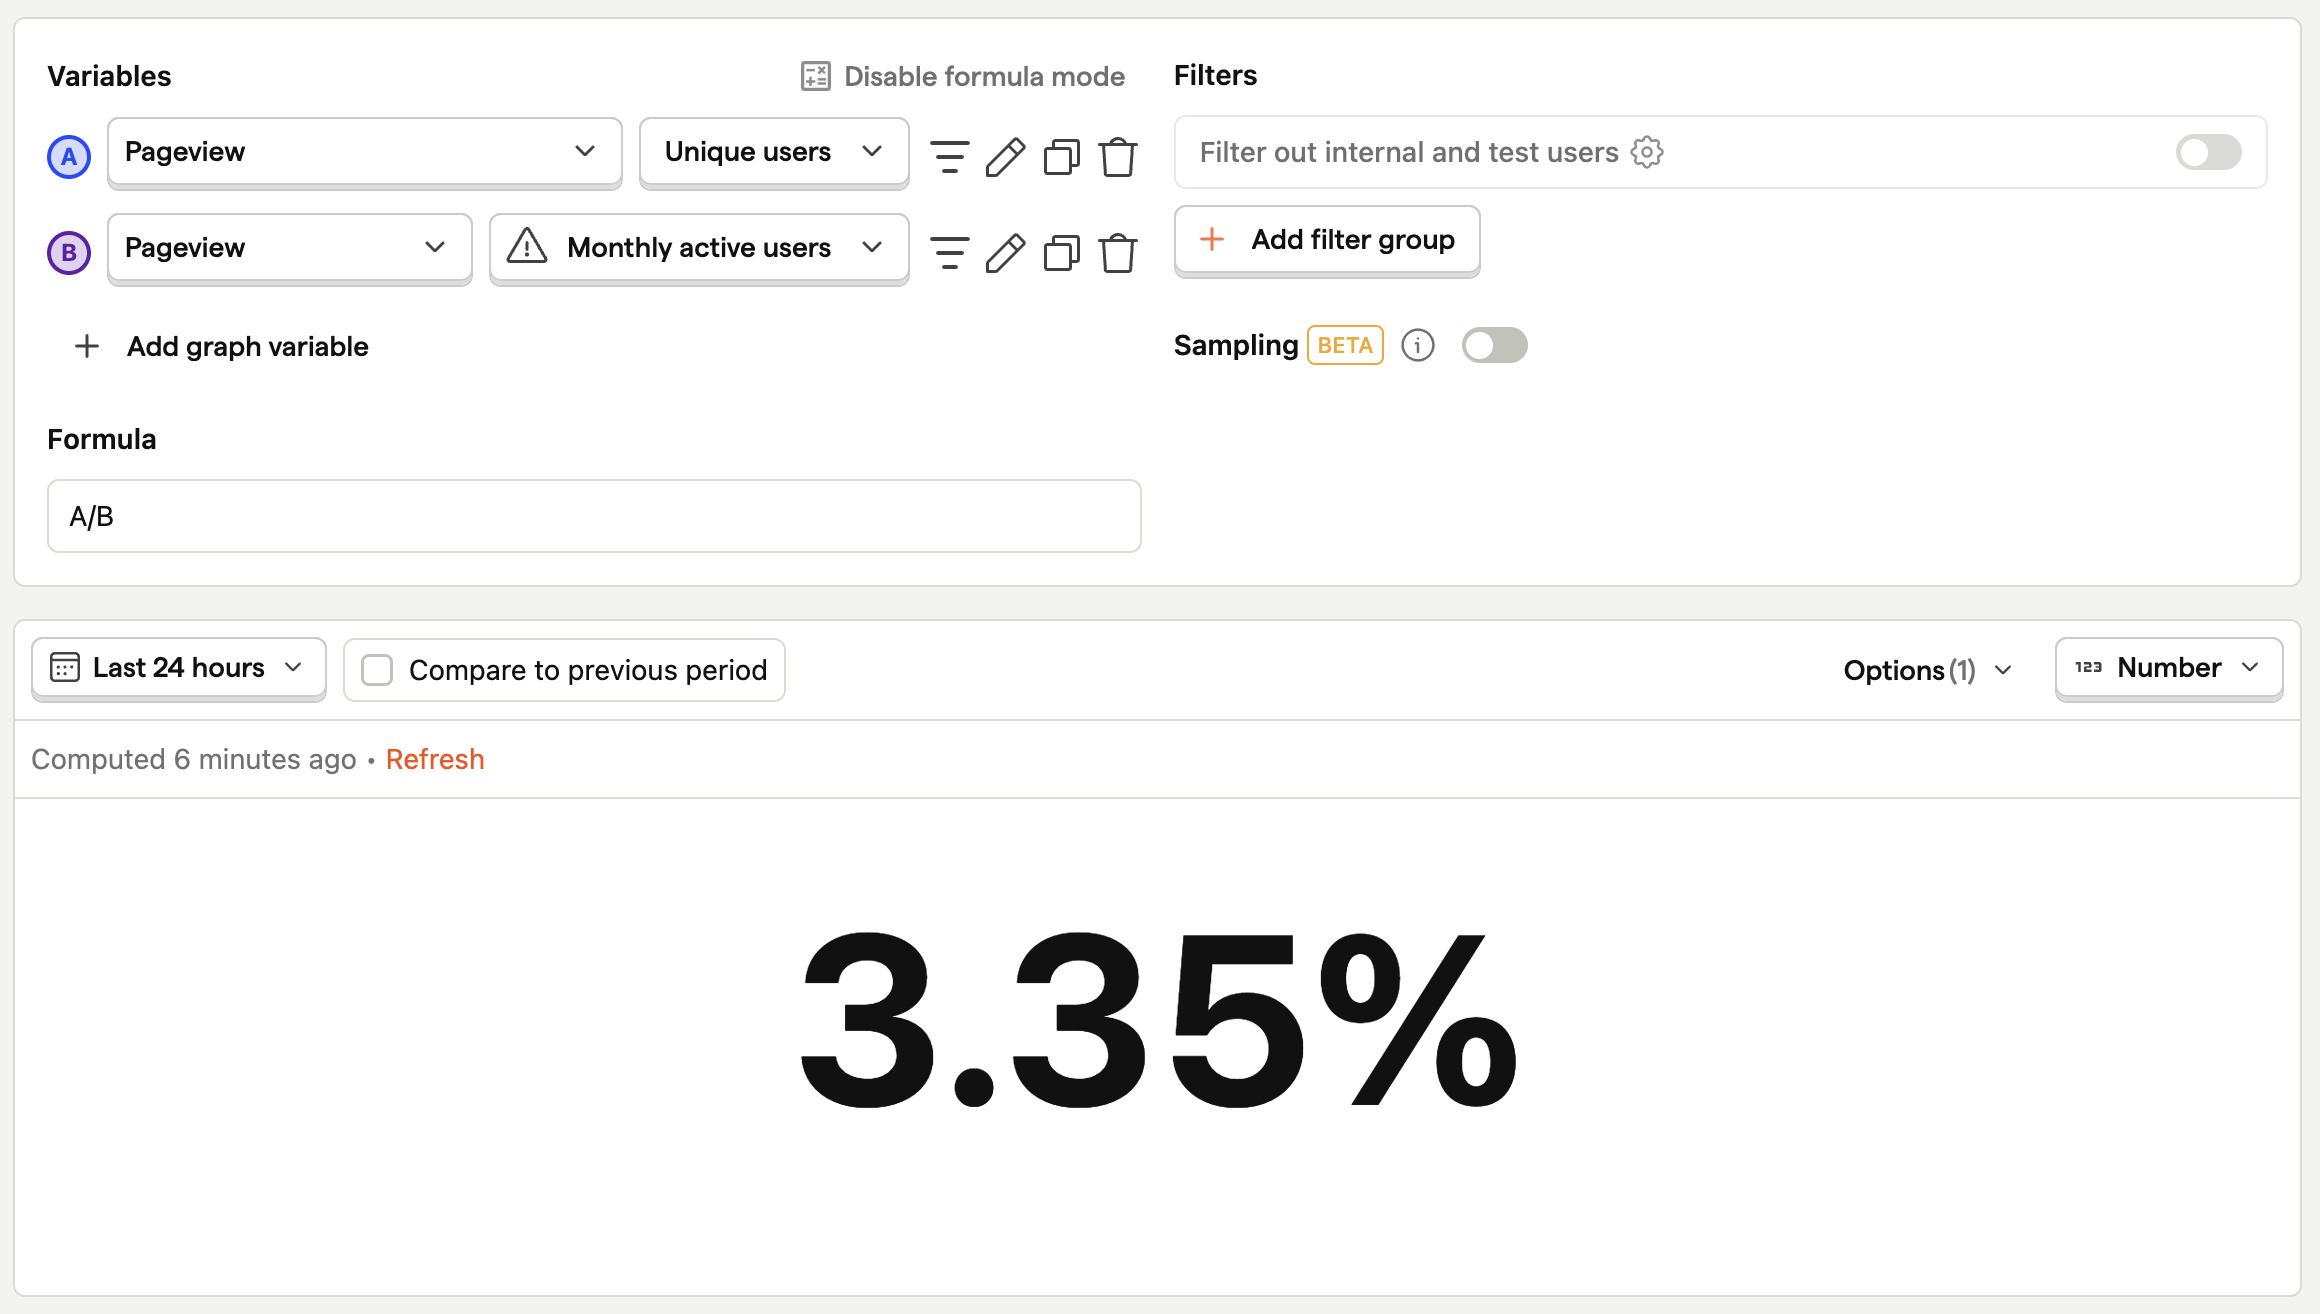
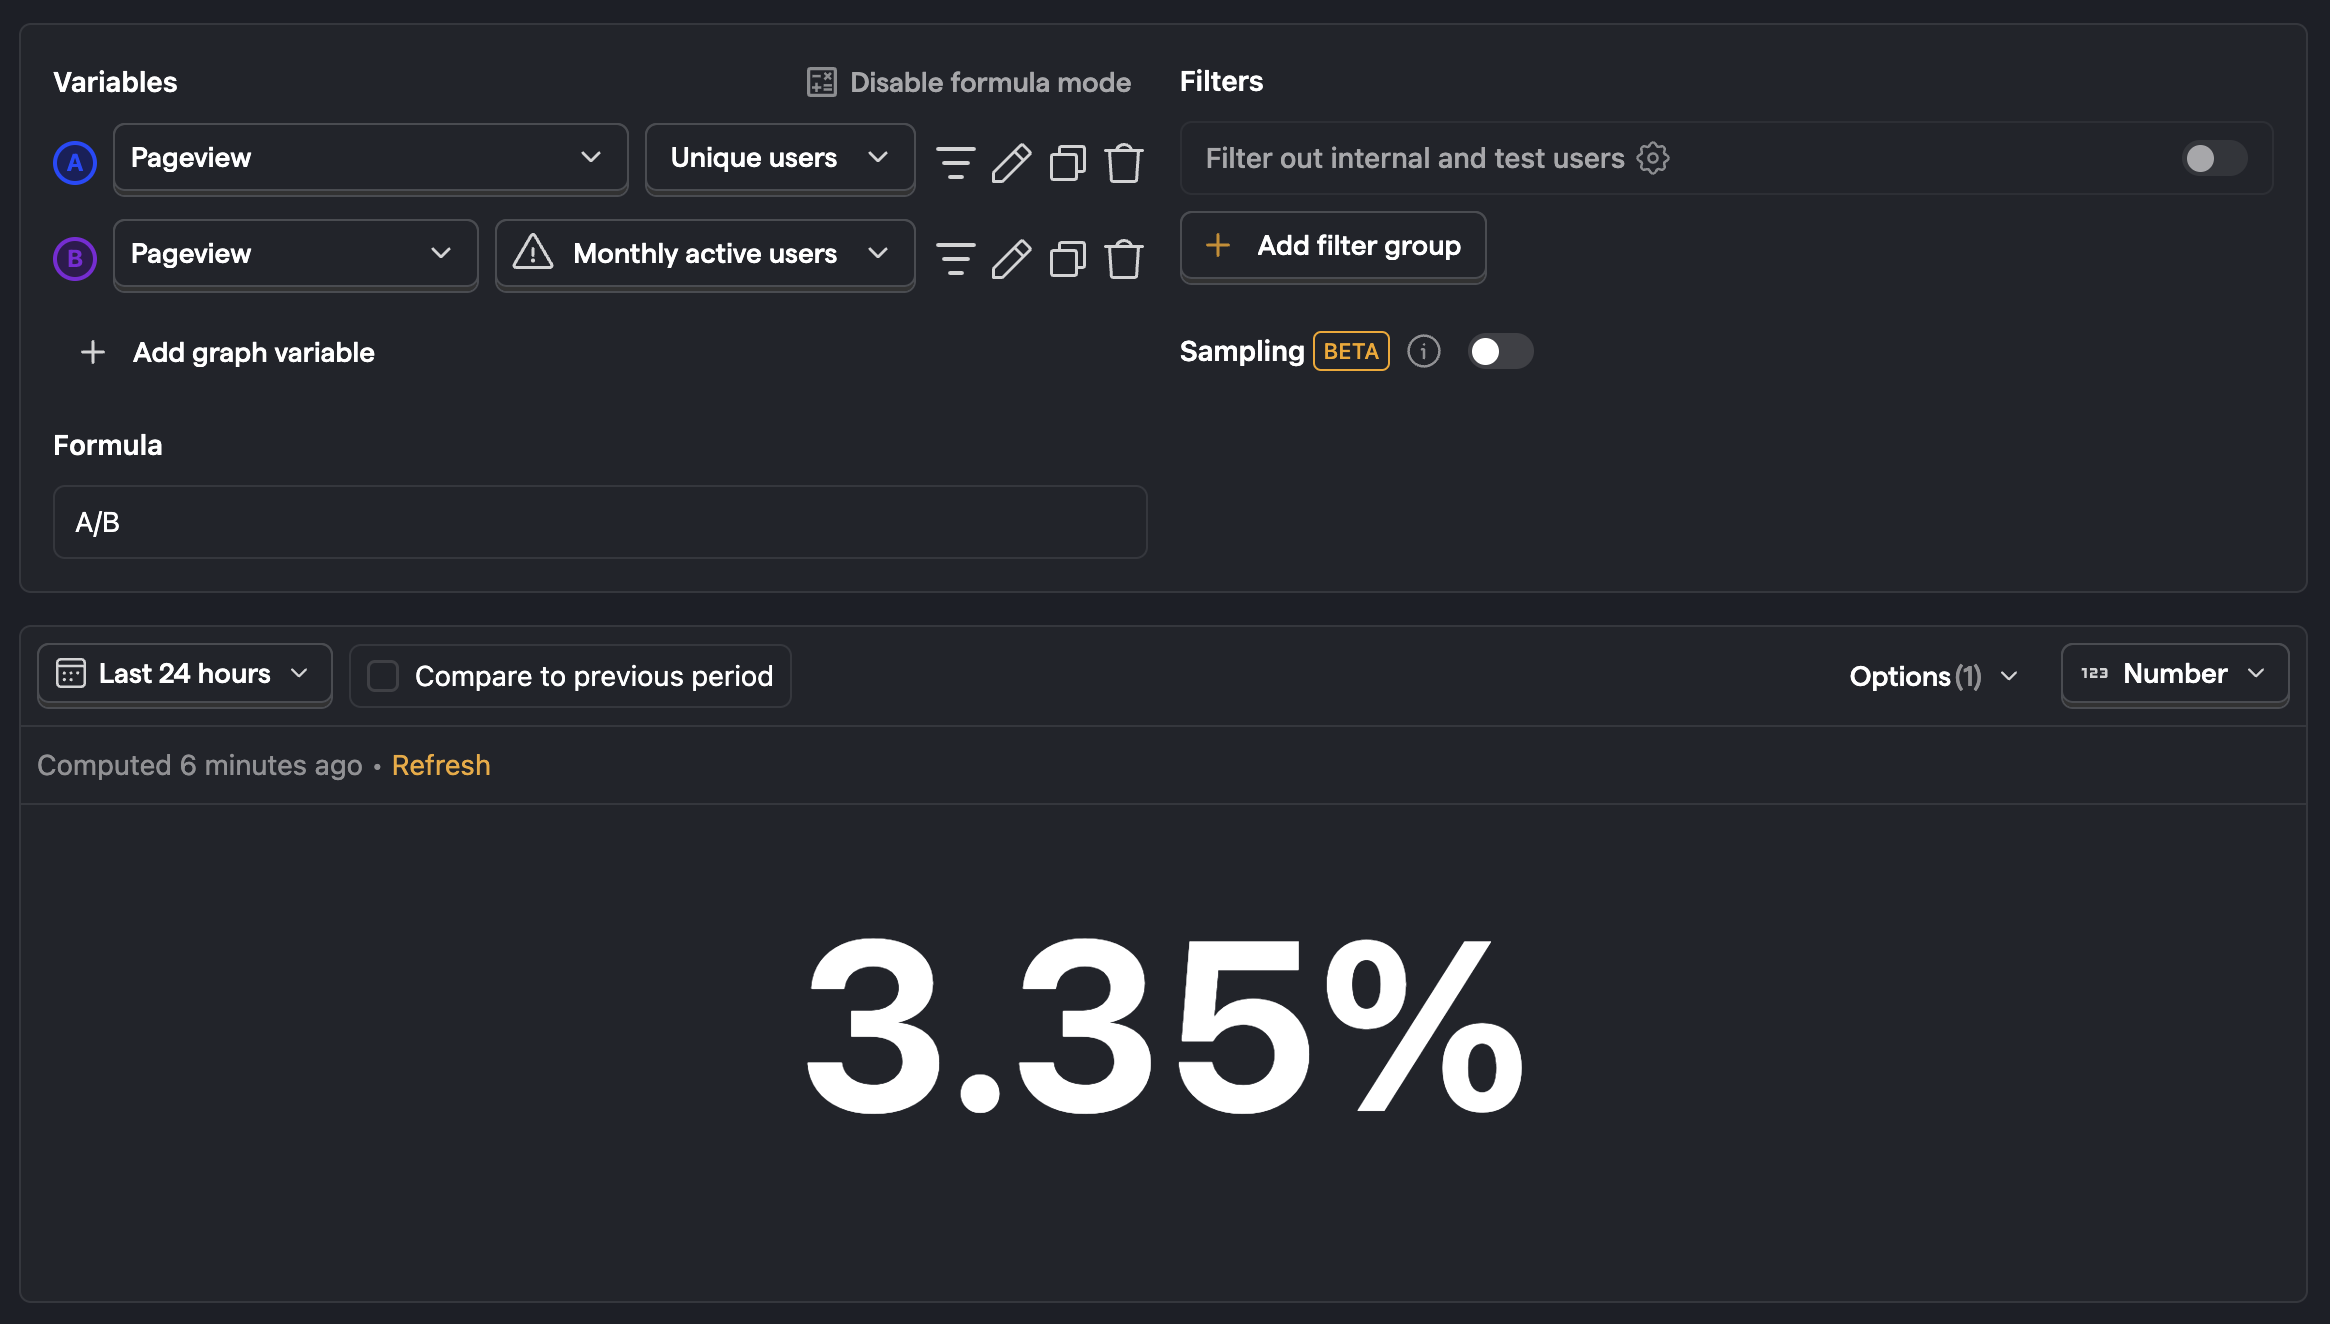
How we calculate unique users and monthly active users in PostHog:
dauaka "unique users": count of unique users in the interval, which defaults to daily. Despite the name, if you select theintervalto be weekly or monthly, this will show weekly or monthly active users respectively.monthly_active: rolling average of users who sent events in the last month.
Customizing your DAU/MAU ratio
There are many ways to customize your DAU/MAU ratio to fit your needs. The easiest way is to use a filter on your insight.
To do this in the same insight, click "+ Add filter group" then select a property like "Browser" and a value like "Chrome." Once set, this gives your DAU/MAU ratio for Chrome users.

Feature DAU/MAU ratio
Products contain many features. Some products get so large that a single DAU/MAU ratio doesn’t represent what’s happening in the product well or doesn’t provide enough detail into what’s driving success.
To better capture the details of your product, you can create per feature DAU/MAU ratio. You can do this by choosing an event or action that represents the usage of your feature as your series instead of "All events." In our case, that action is "Edited document."

New user DAU/MAU ratio
To understand how sticky your product is with new users, you can create a new user cohort and filter your insights by that cohort. To do this, go to cohorts, and create a new cohort that matches persons who completed a "signed up" event or action for the first time in the last 3 months. What you choose for your event or action and time range is up to you.

Once created, you can use this cohort as a filter in your DAU/MAU ratio calculation.
Power user DAU/MAU ratio
Although you can use DAU/MAU ratio as a proxy for power users, it doesn’t fully represent them. Power users are better represented by intensity and volume of usage, rather than the repeated usage a DAU/MAU ratio measures.
To combine these two definitions, you can create a power user cohort, then use it as a filter in your DAU/MAU ratio calculation. To create this cohort, match persons who completed a key usage metric multiple times. For my example, I chose Edited document at least 30 times in the last 30 days.
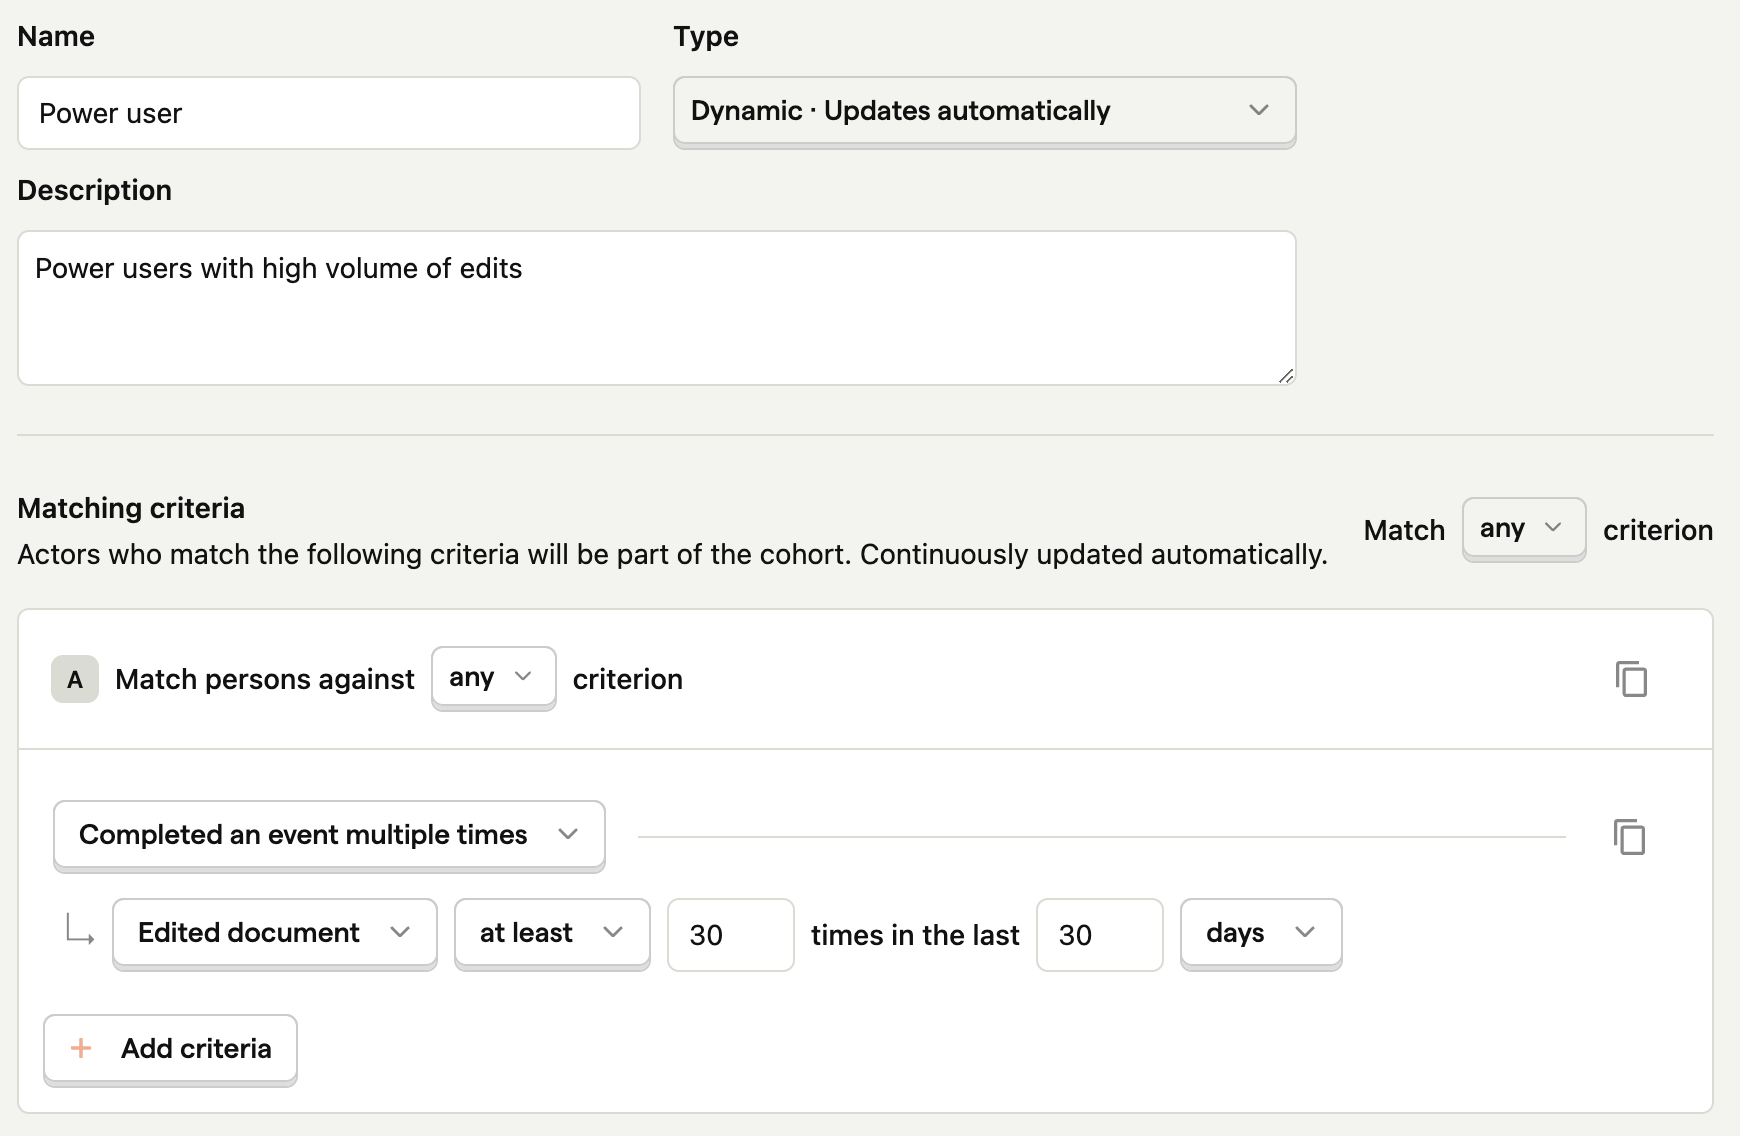
Once saved, you can use this power user cohort as a filter for your DAU/MAU ratio.
Further reading
- How to calculate and lower churn rate
- Calculating average session duration, time on site, and other session-based metrics
- The most useful B2B SaaS product metrics

Subscribe to our newsletter
build mode
Read by 75,000+ founders and builders
We'll share your email with Substack
PostHog is the leading platform for building self-driving products. With a full suite of developer tools – AI observability, product analytics, session replay, feature flags, experiments, error tracking, logs, and more – PostHog captures all the context agents need to diagnose problems, uncover opportunities, and ship fixes. A data warehouse and CDP tie it all together, unifying that context into one source agents can read across. You can steer it all from Slack, the web app, the desktop (PostHog Code), or your own editor via the MCP.