


How to use session replays to improve your support experience

Contents
On top of being useful for understanding user behavior, session replays help solve problems with your product. You can use them to discover issues, understand why they are happening, and work to fix them. In this way, session replays help you provide a better support experience to users.
Finding relevant sessions for users needing support
When a user reports an issue, a session replay turns a long conversation into a short recording viewing. This is because you can see what actions they took, rather than them explaining their situation. It also provides easy access to relevant data and properties (like OS, browser, and custom properties). This helps your team diagnose issues faster.
To find recordings from a specific user that needs support, you can filter for a person or event on the Sessions Recording page. For example, to find a recent session replay where my account had a problem, I could filter for sessions:
- in the last 24 hours
- which has the
Rageclickevent - from a person with my email address.

Once you’ve found a relevant recording, click the toggle above the events to show the ones matching your filters (in this case, Rageclick) to go straight to the issue. You can also search for other events within the session (such as exceptions). This shows you those events in the recording, the behavior before or after, and the related person and event data.
Finding a session replay connected to the issue saves you time in multiple ways:
- You don’t have to go back and forth with the user for details.
- You get the session and data context which enables you to respond better.
- If it is a bug, you have the steps to debug and recreate to easily share with your team.
Sharing recordings as a support team
Once you’ve found a session replay related to an issue, you can share a link with your teammates (including a timestamp). This helps them access the recording and details (like the person and their properties) quickly. Just click the share button at the top of the recording viewer to open this modal.

You can share these links on platforms you use to coordinate user support, such as Zendesk, Slack, GitHub, HubSpot, and Salesforce. This is valuable context for other people supporting that user. It is also useful for development teams who require data on the user and “steps to recreate the issue” so they can solve the issue. It is a simple, useful connection between your support tools and PostHog.
Combining error monitoring and session replay
You can combine PostHog’s suite of dev tools for a better support experience through real user monitoring. Because errors hurt user experience, capturing and monitoring them is vital to triaging and resolving them. Using custom event capture and integrations enables PostHog to capture errors. You can then use that error data to analyze session replays and provide better support.
The most basic way to do this is to send custom error events in problem areas using a capture call. In an extremely basic form, it looks like this:
You could then use the error event to understand their frequency, details, and context in session replays. Every language, library, framework, and project has a different way of handling errors, and the customizability of PostHog can fit all of them.
Console logs in recordings
PostHog also includes the option to record console logs in session replays. This is useful for getting errors that log to the console. To turn this on, go to Project Settings and under recordings toggle “Capture console logs.” This adds console logs (as well as errors and warnings) to a separate tab on the recordings page.
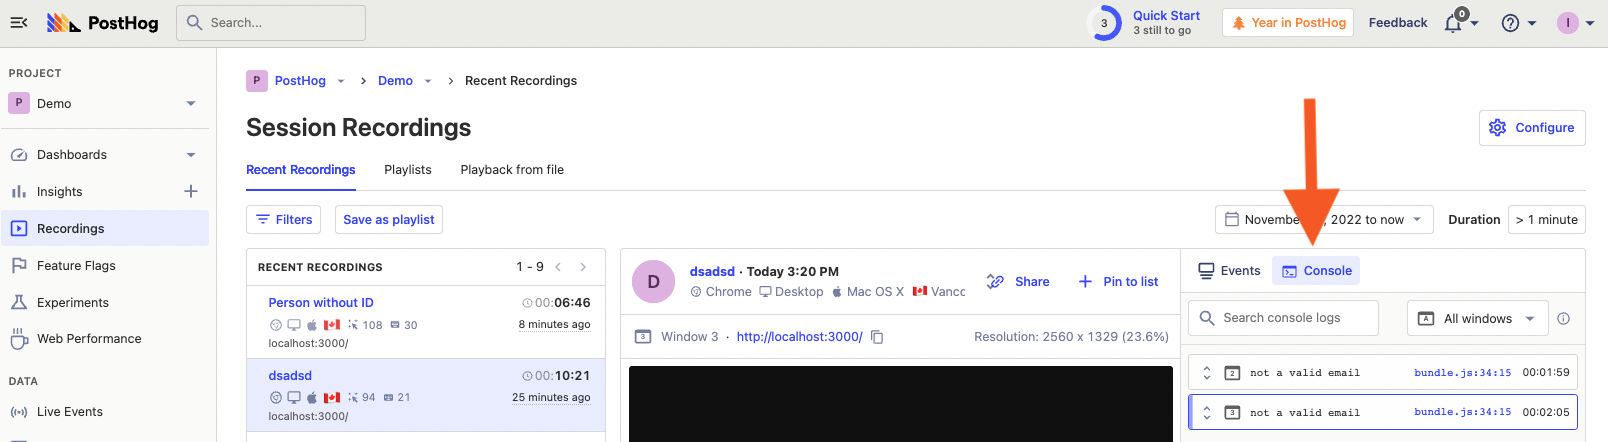
Within a recording, you can search for the specific console logs you’re looking for, and see the details about them (such as strings or objects they include).
Further reading
- How to use filters + session replays to understand user friction
- How to add session replays to Zendesk
Subscribe to our newsletter
build mode
Read by 75,000+ founders and builders
We'll share your email with Substack
PostHog is the leading platform for building self-driving products. With a full suite of developer tools – AI observability, product analytics, session replay, feature flags, experiments, error tracking, logs, and more – PostHog captures all the context agents need to diagnose problems, uncover opportunities, and ship fixes. A data warehouse and CDP tie it all together, unifying that context into one source agents can read across. You can steer it all from Slack, the web app, the desktop (PostHog Desktop), or your own editor via the MCP.