How to correlate errors with product performance using Sentry
May 04, 2022

- Level: Easy 🦔
- Estimated reading time: 5 minutes ☕️
PostHog offers a variety of tools which are useful for real user monitoring and debugging errors, such as Session Recording, Paths and Trends — yet it is not a bespoke error monitoring tool.
Sentry is an excellent error-monitoring tool with specialist tools for investigating issues such as slow API calls or database queries, yet lacks the tools to analyse these issues in terms of company metrics.
In this tutorial, we’ll demonstrate how connecting PostHog and Sentry enables you to correlate errors in Sentry with other product metrics, and to debug issues more easily.
Interested in capturing errors in PostHog? Our new error tracking product is currently in beta. Learn more about it in our docs.
Step 1: Connect PostHog with Sentry
First, we need to connect Sentry and PostHog via a two-way integration so that they can share data directly. PostHog offers Sentry integrations via Javascript and Python — though note that the Javascript integration requires that both PostHog and Sentry are using JS modules.
Step 2: Track Sentry errors in PostHog
Once the integration is setup, Sentry will automatically start sending $exception events to PostHog every time it detects and logs an error.
Using this as a PostHog event, we can track how many errors are logged over time. The chart below, for example, shows the number of $exception errors over the last 7 days compared to the previous 7 days.

However, this is only the start of what’s possible in PostHog. We can also use PostHog to correlate $exception events with other metrics and PostHog data.
Step 3: Correlate Sentry errors with PostHog data
Each $exception event in PostHog represents an error logged by Sentry, so the next question is: do these events correlate with other events you may have set up such as sign-ups, payments, shares or form fills.
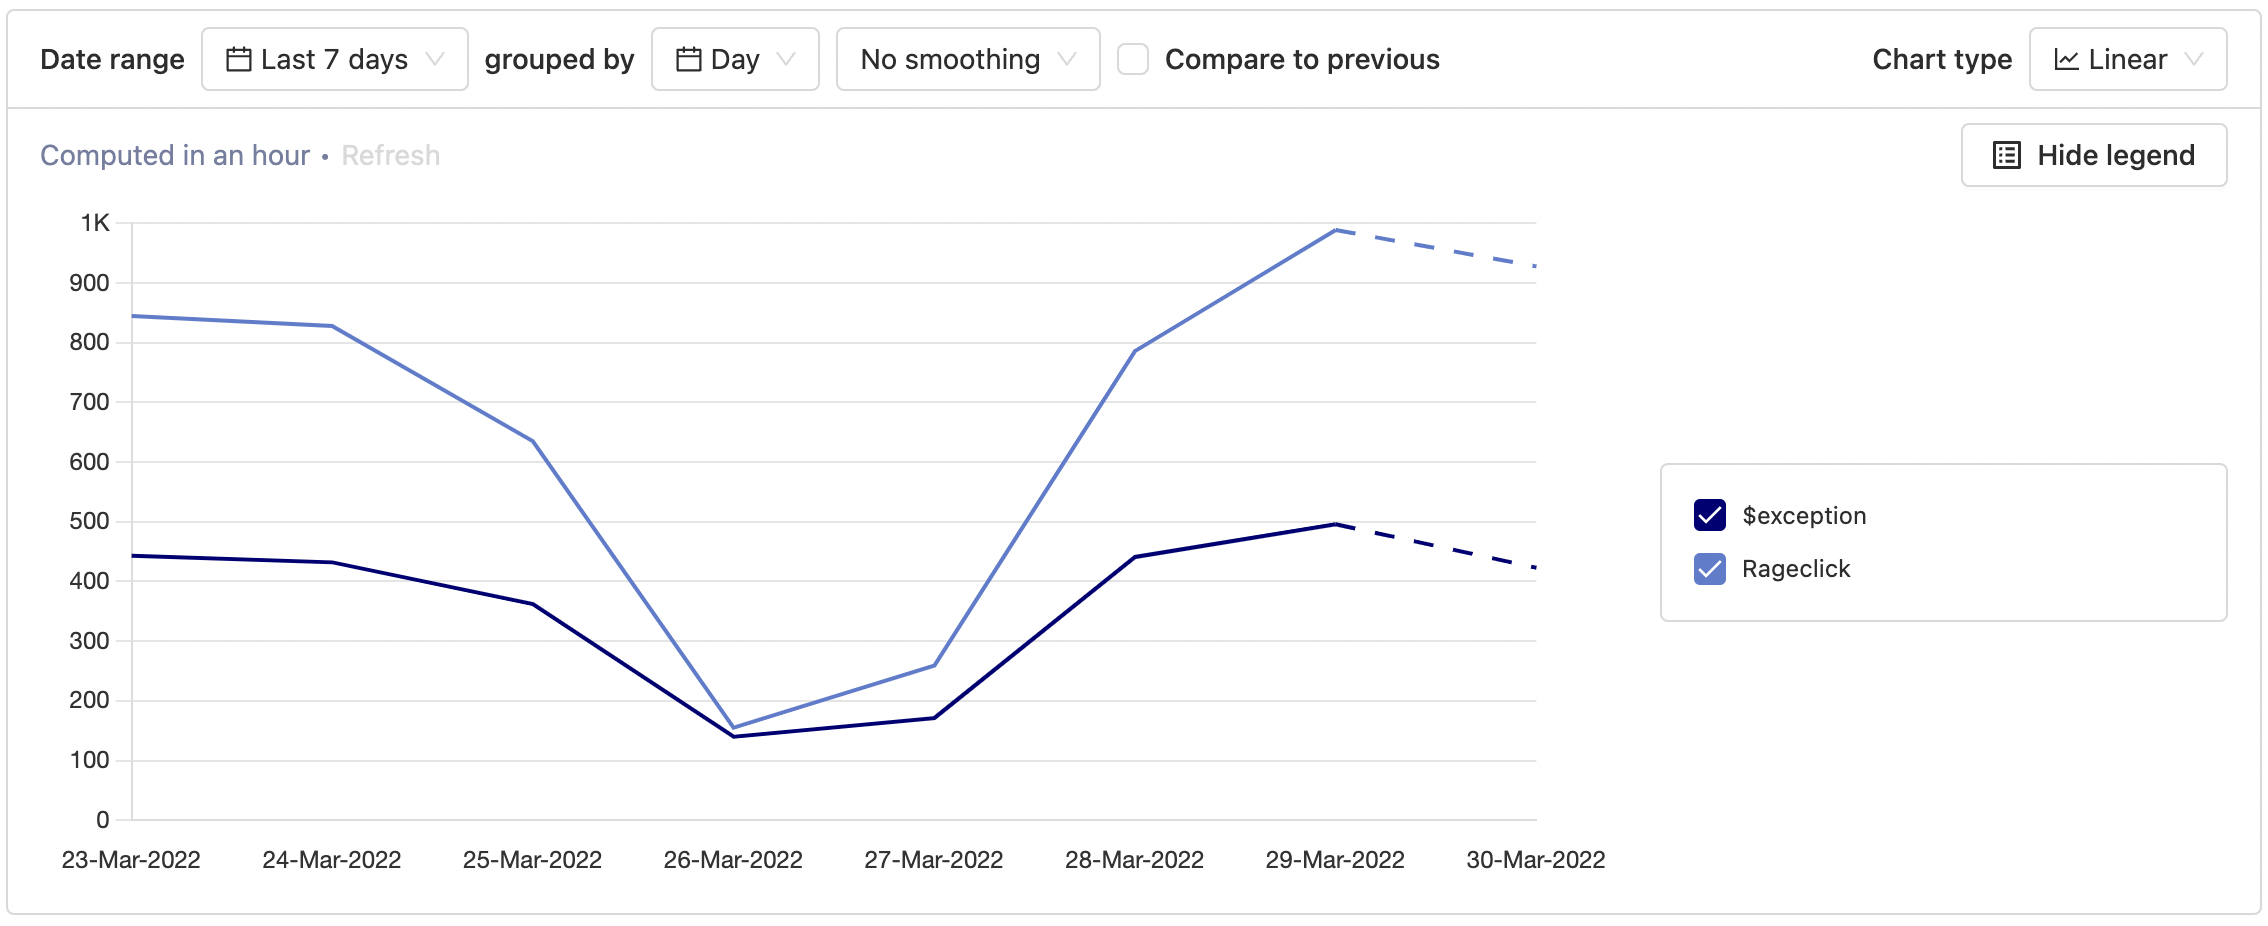
A simple example to illustrate can be seen below, using the Trends tool to correlate $exception events with an event we’ve setup to capture rageclicks. Unsurprisingly, errors correlates closely with rageclicks, which we can take as an indicator that users are experiencing frustration with these errors.
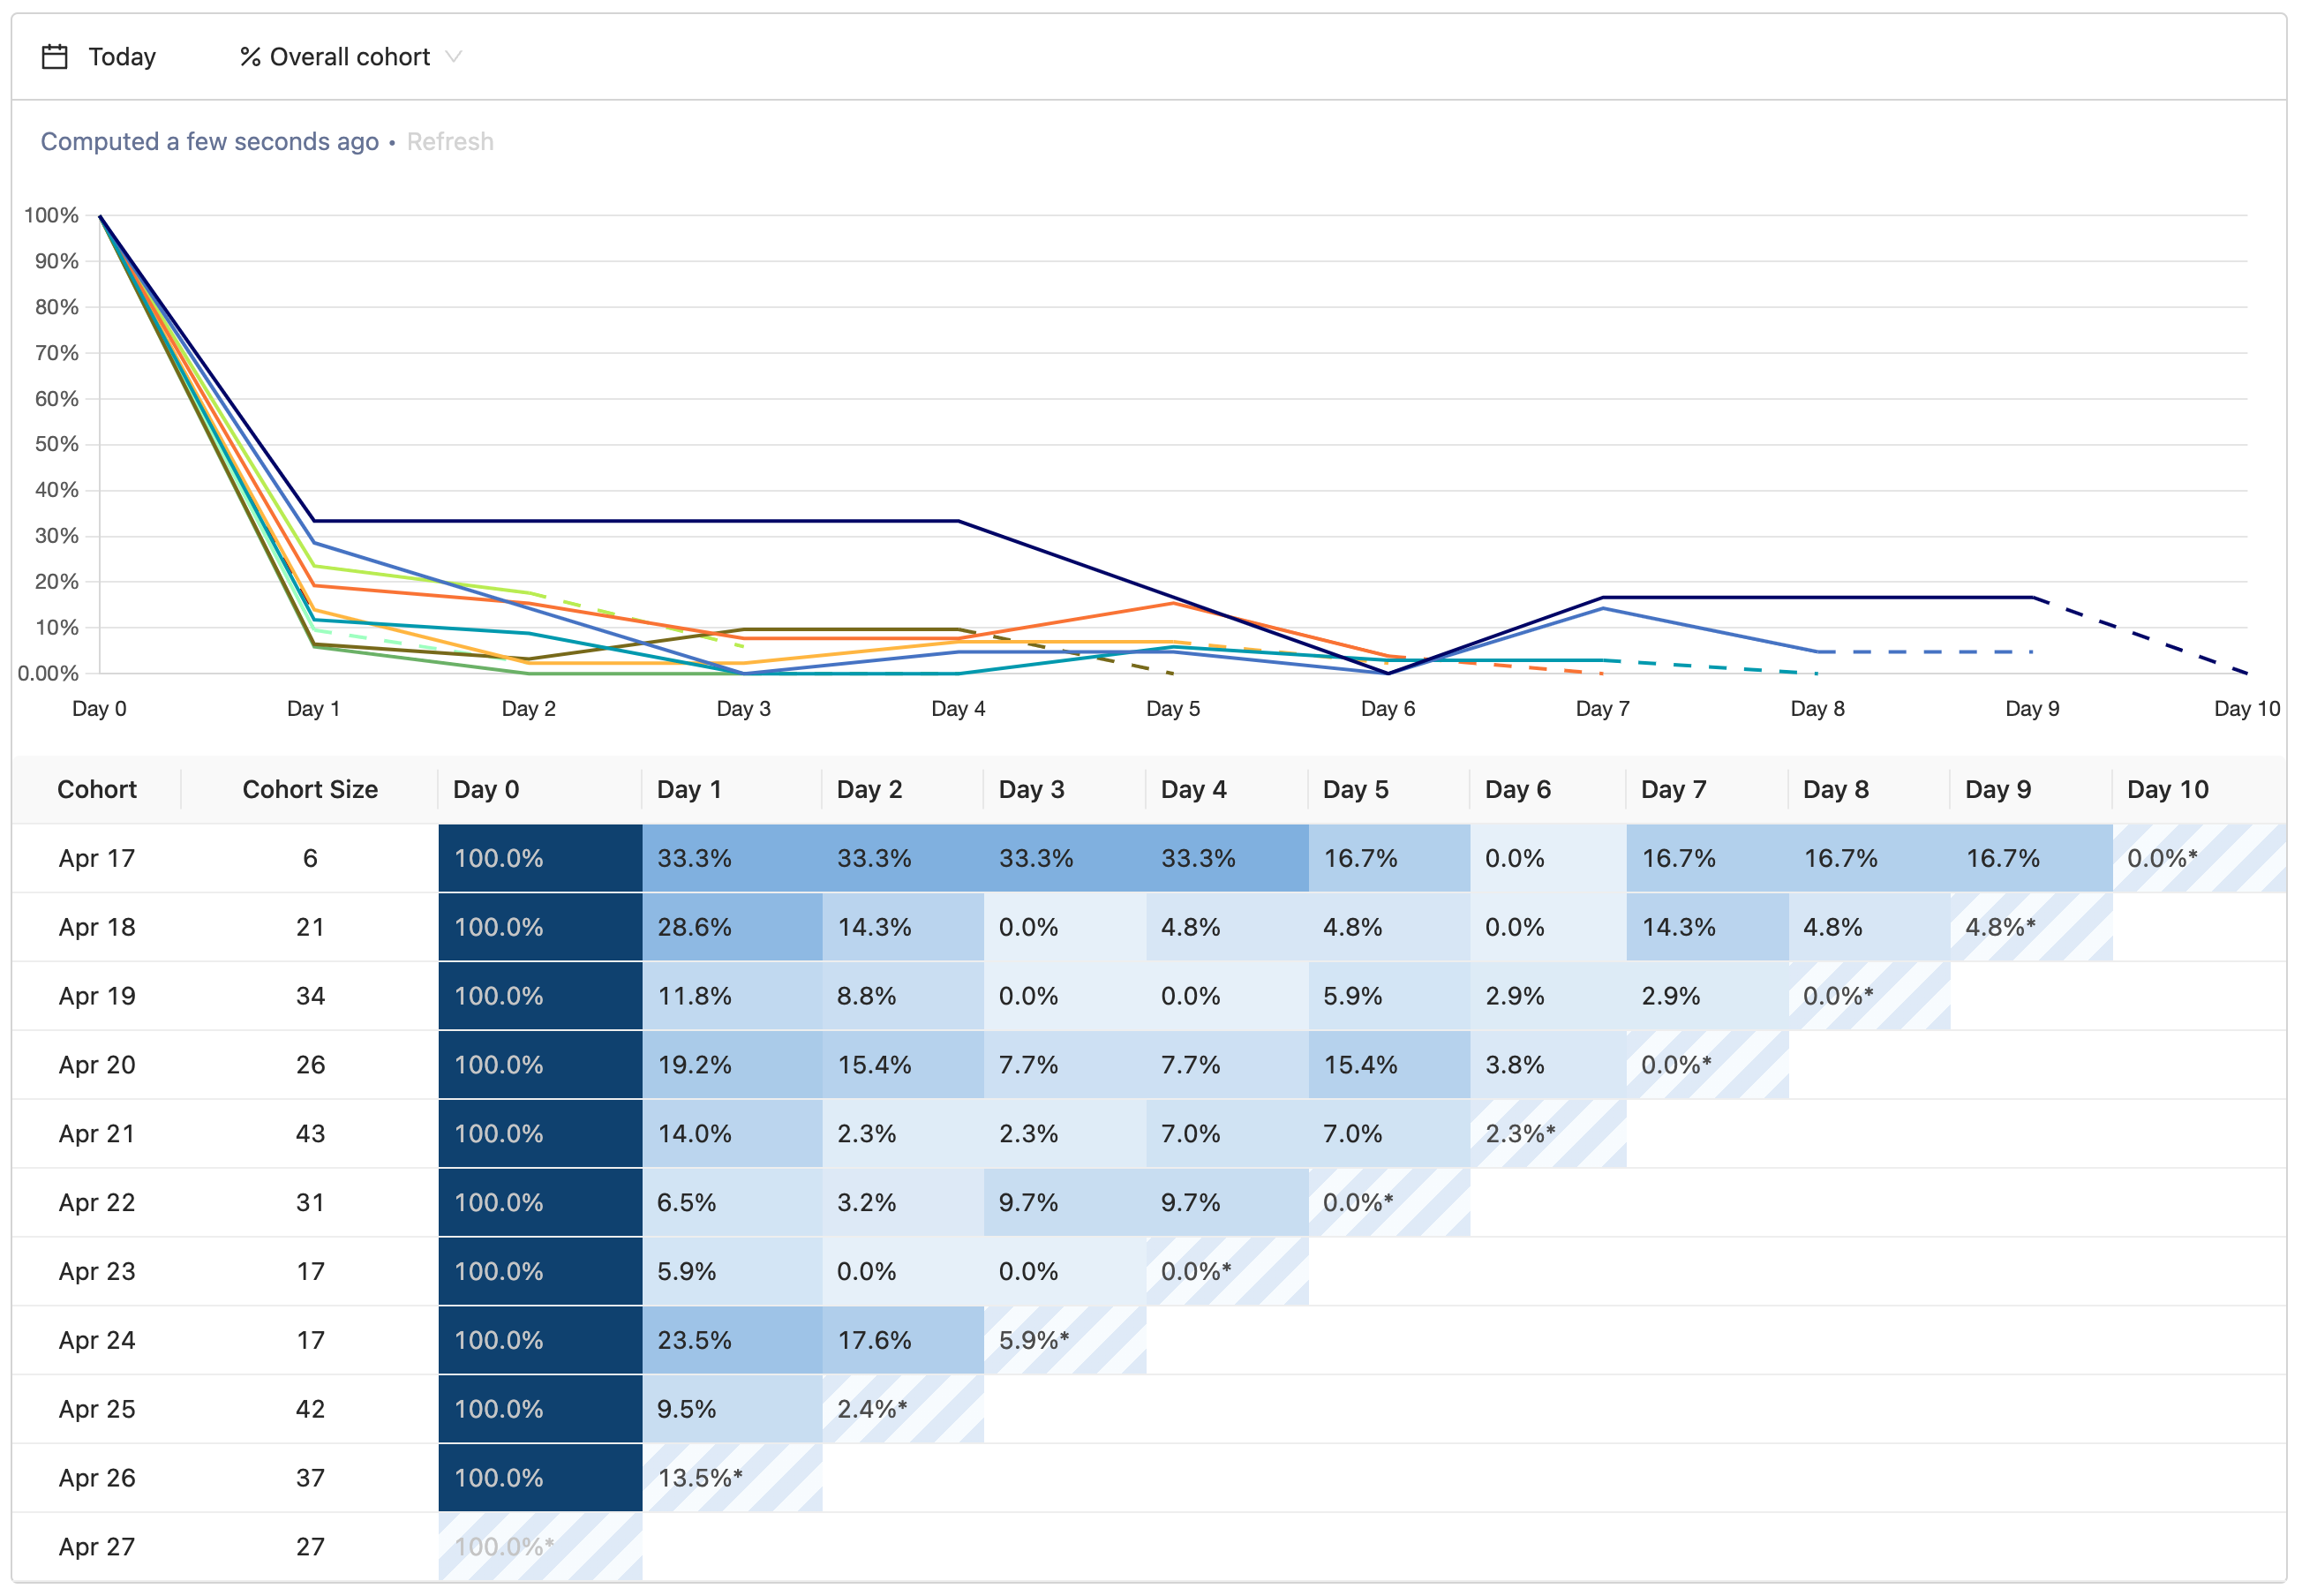
We can also use the $exception event to track user behavior in other ways, such as using the Retention tool to see how errors impact retention.
In this case, we can use Retention to examine $exception events against Insight views (which we can use as a proxy for successful product usage). We can compare this to control groups which did not experience the $exception event to understand how these errors are impacting overall retention.
Step 4: Debug errors using Sentry and PostHog
Connecting PostHog and Sentry also makes it easier to debug issues and explore them using tools such as Session Recording.
For example, you can jump directly from an error in Sentry to a view of the specific person in PostHog in order to view the recording directly. This enables you to view the error as it happens, with the $exception event clearly shown on the timeline — a useful tool for understanding the steps leading up to an error and getting full context.
There are many other ways to explore $exception events sent by Sentry and debug errors using tools such as Funnels, Cohorts, Lifecycle and more. Check the docs for more ideas and inspiration!

Subscribe to our newsletter
Product for Engineers
Read by 60,000+ founders and builders
We'll share your email with Substack
Questions? Ask Max AI.
It's easier than reading through 682 pages of documentation