


How to set up OpenRouter LLM observability

Contents
Since publishing this post, we've integrated further with OpenRouter. You can enable the PostHog integration directly through OpenRouter Broadcast – no SDK instrumentation required. All your LLM calls will then be tracked automatically in PostHog's AI Observability. See the OpenRouter installation docs for details.
OpenRouter makes it easy to use a range of different LLMs. No matter which you use, understanding API usage, costs, and latency is crucial for understanding how users interact with your AI features. In this tutorial, we'll show you how to monitor important metrics such as:
- Total cost across different models
- Average cost per user
- Average API response time
- Model performance comparisons
We'll build a basic Next.js app, implement the OpenRouter API, and capture these events automatically using PostHog.
1. Creating a Next.js app
To make requests to OpenRouter and display the responses, we’ll create a basic Next.js app. To do this, start by ensuring Node.js is installed (version 18.0 or newer) then run the following command. Say no to TypeScript, yes to app router, and the defaults for other options.
After creating your app, go into the newly created folder and install the required dependencies:
Now, we can create our frontend. It will be:
- A form with a textfield and button for user input
- A label to show the AI output
- A dropdown to select different OpenRouter models
- An API call to our backend to generate a response
We can do this all in app/page.js like this:
Once saved, run npm run dev to see your new frontend in action.
2. Adding and tracking the generate API route
Next in the app directory, create an api directory, a generate directory inside it, and a route.js file inside that. In app/api/generate/route.js, create your API route to call OpenRouter through the OpenAPI client and generate a response. We’ll use PostHog’s OpenAI provider to capture all the details of the call.
Altogether, this looks like this:
Now, when you run npm run dev again, you can choose your model, enter your message, and press send to get a response. This also captures an $ai_generation event in PostHog.
3. Viewing generations in PostHog
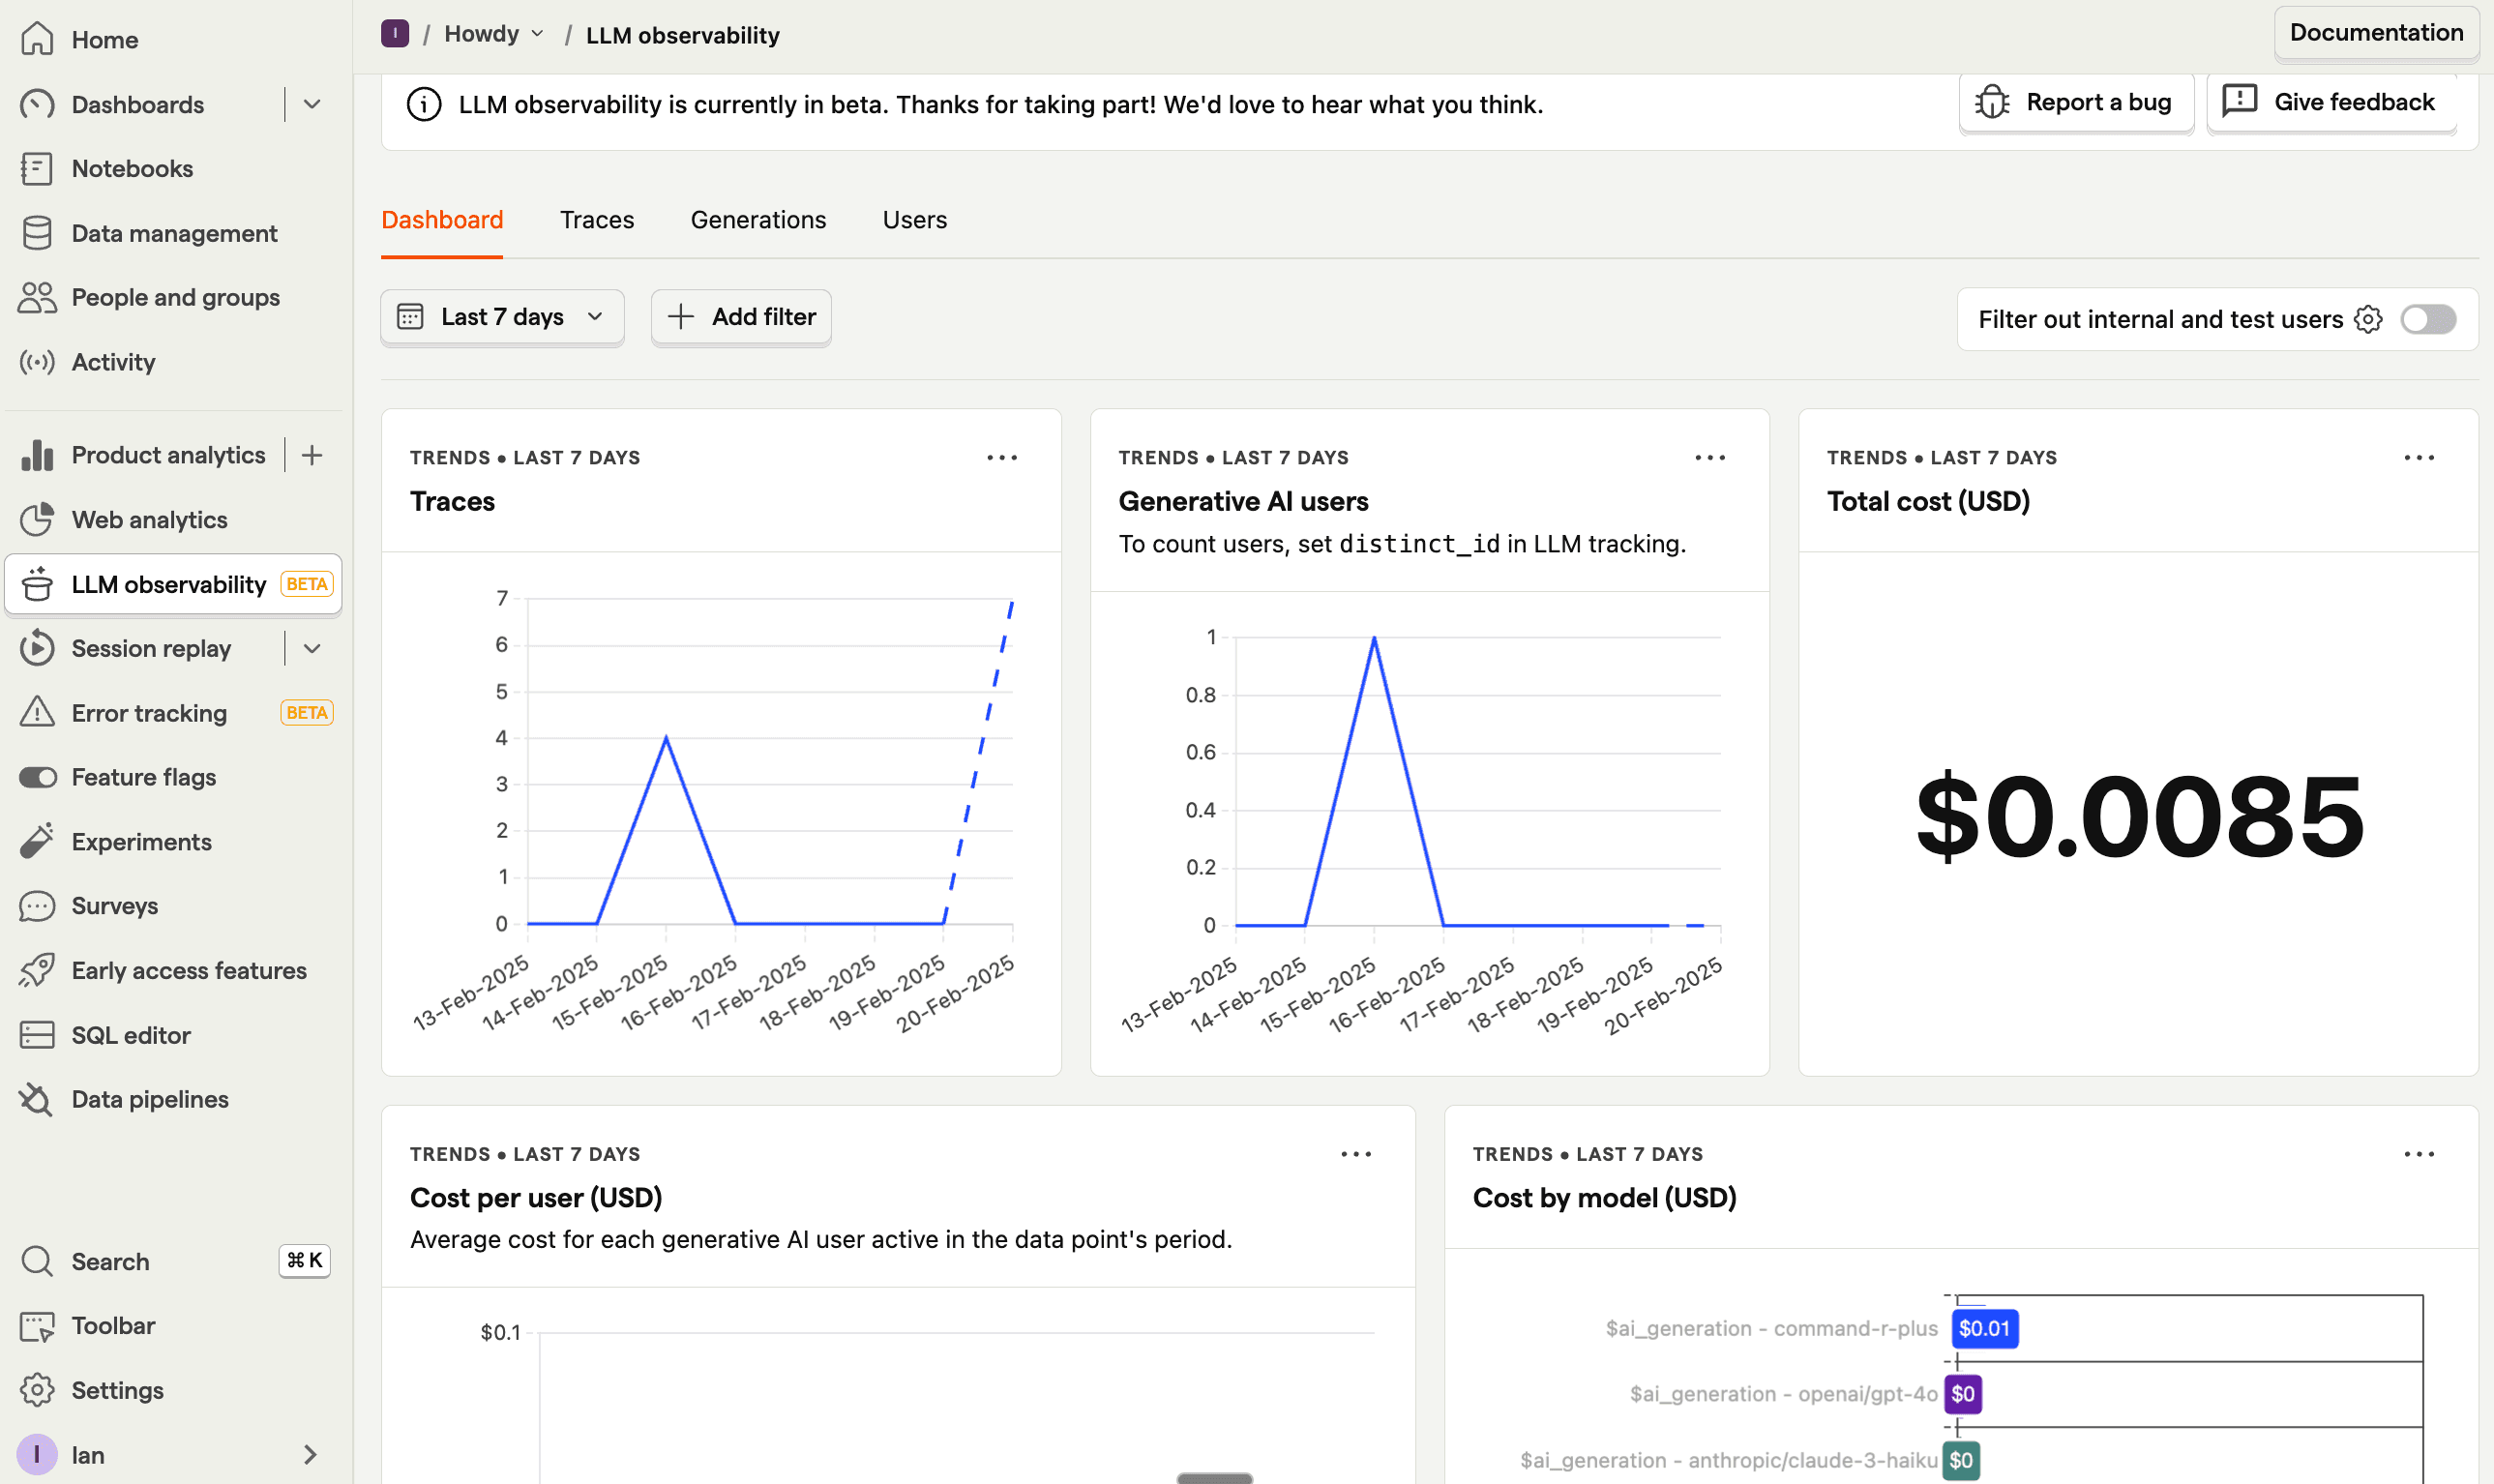
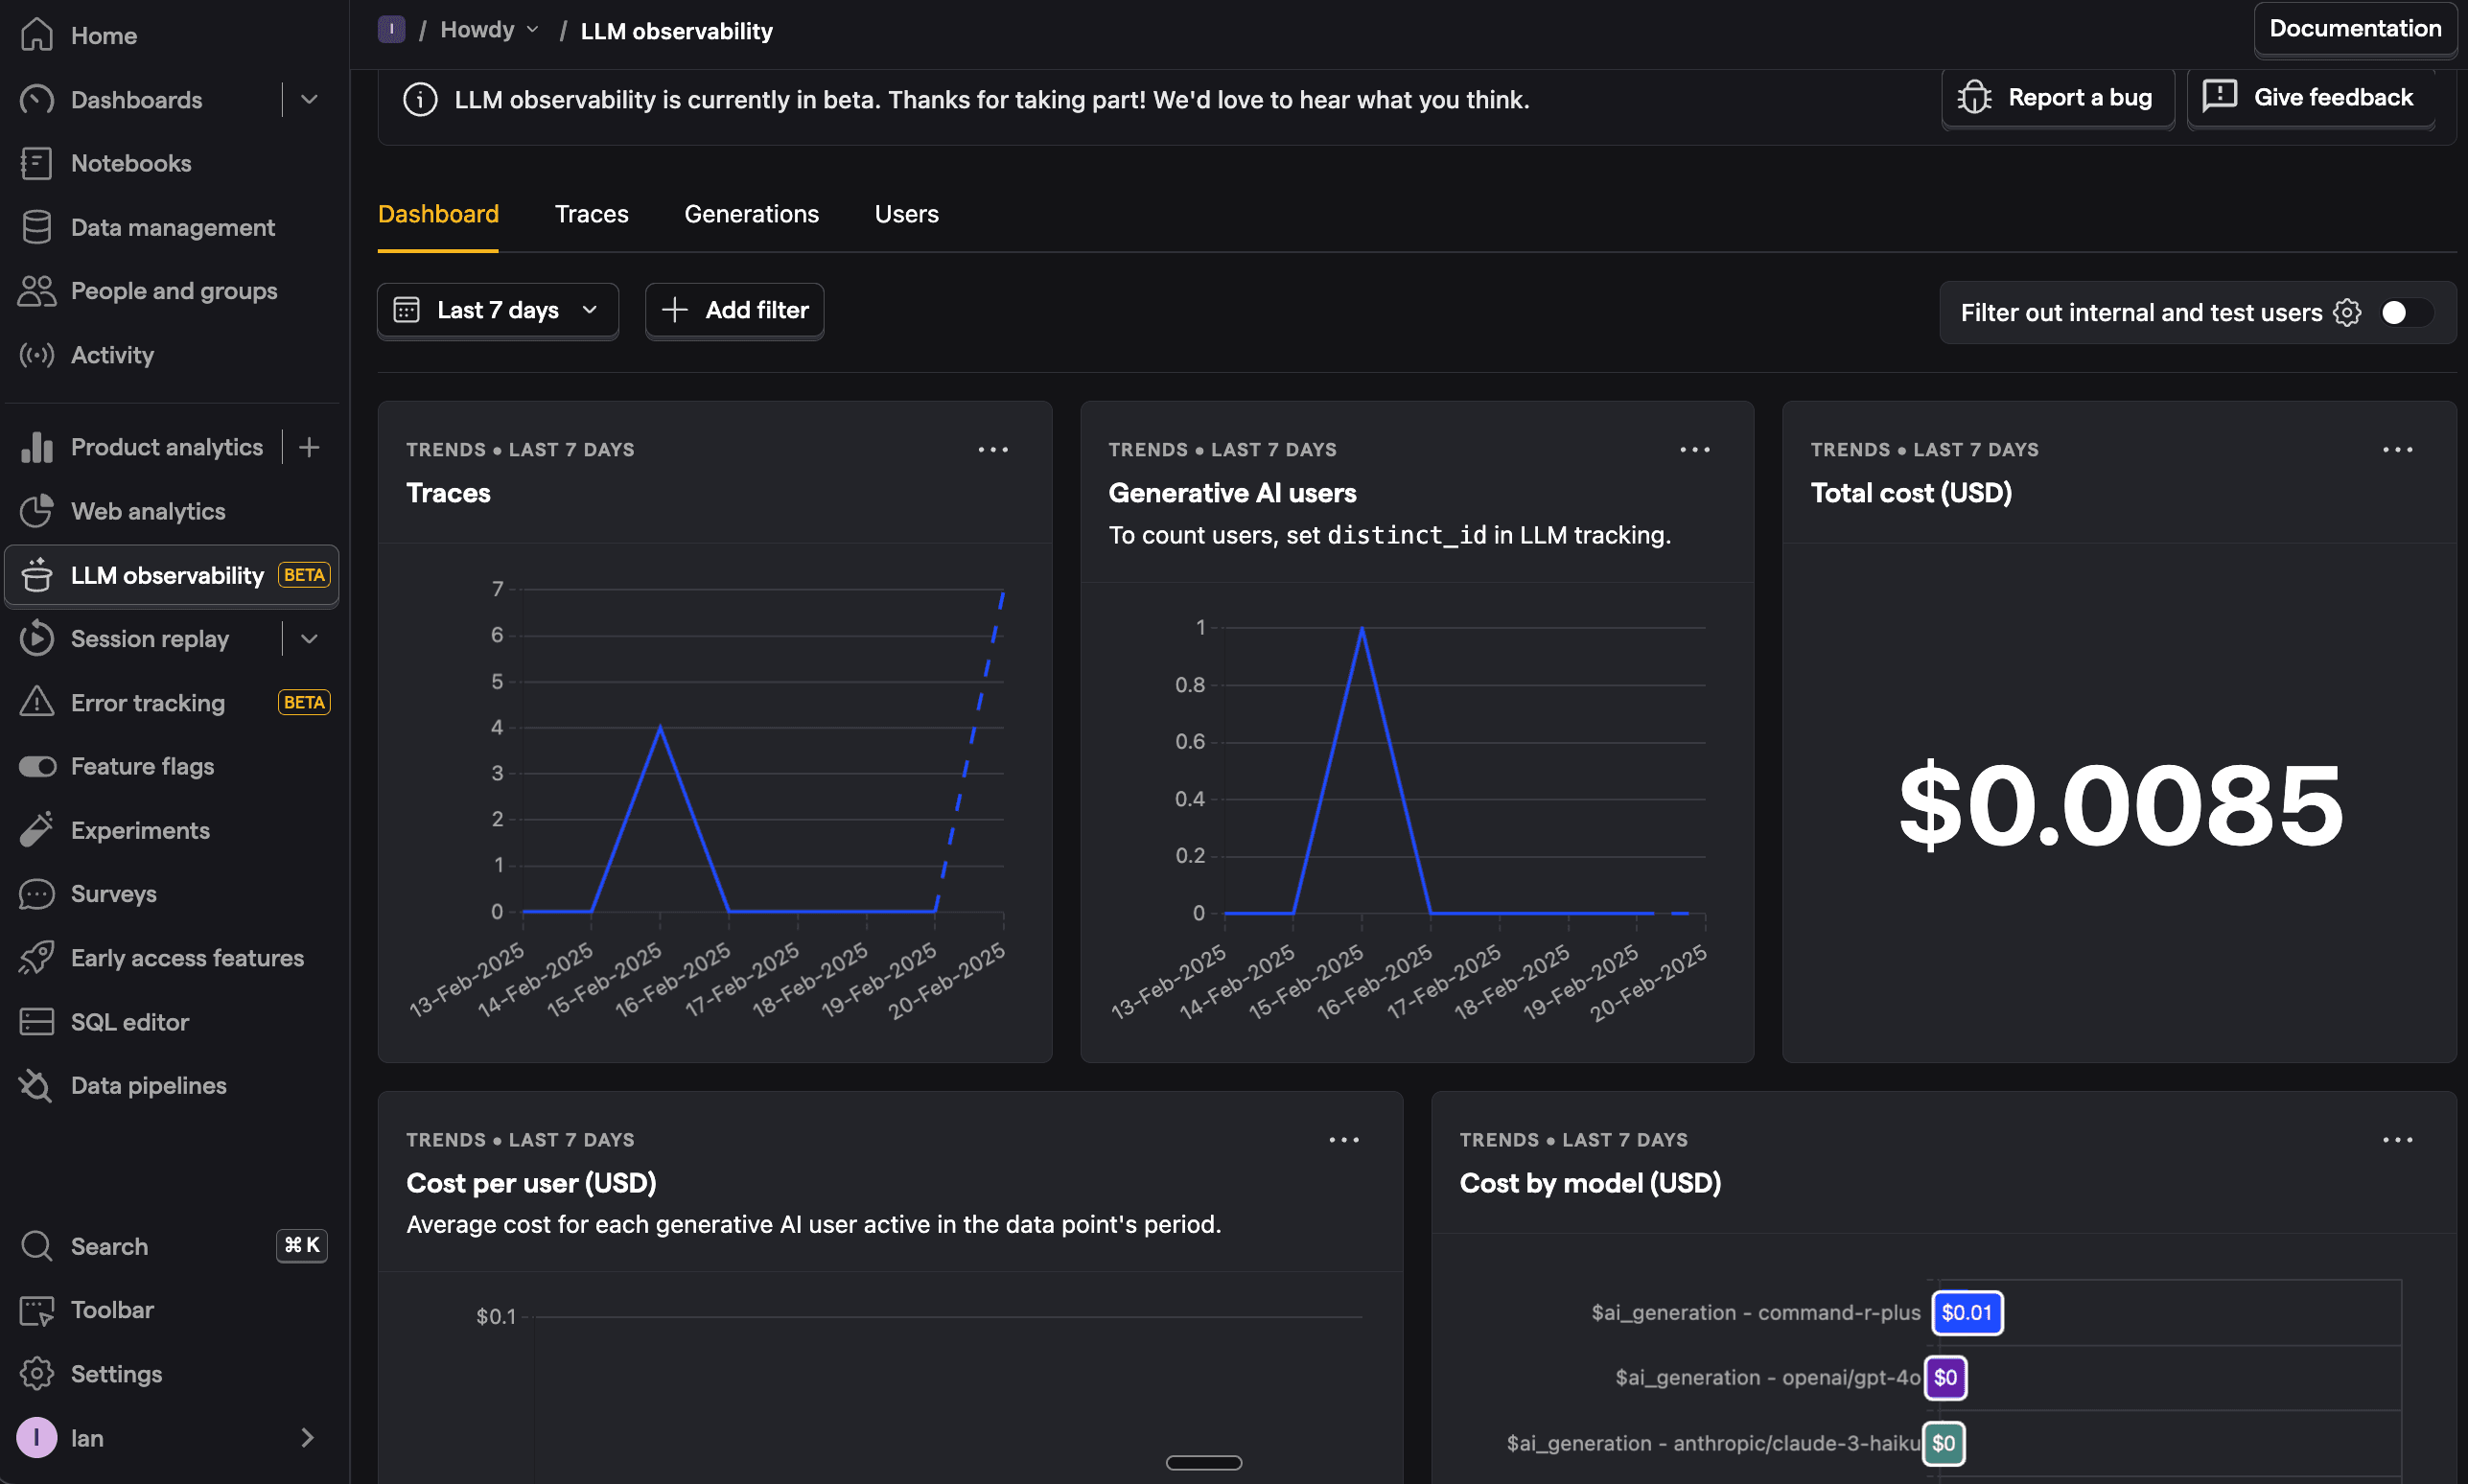
After generating a few responses with different models, go to PostHog to access the AI Observability dashboard to see:
- Overview of all AI interactions
- Cost breakdowns by model
- Response latency comparisons
- Token usage across different providers
- Full conversation traces
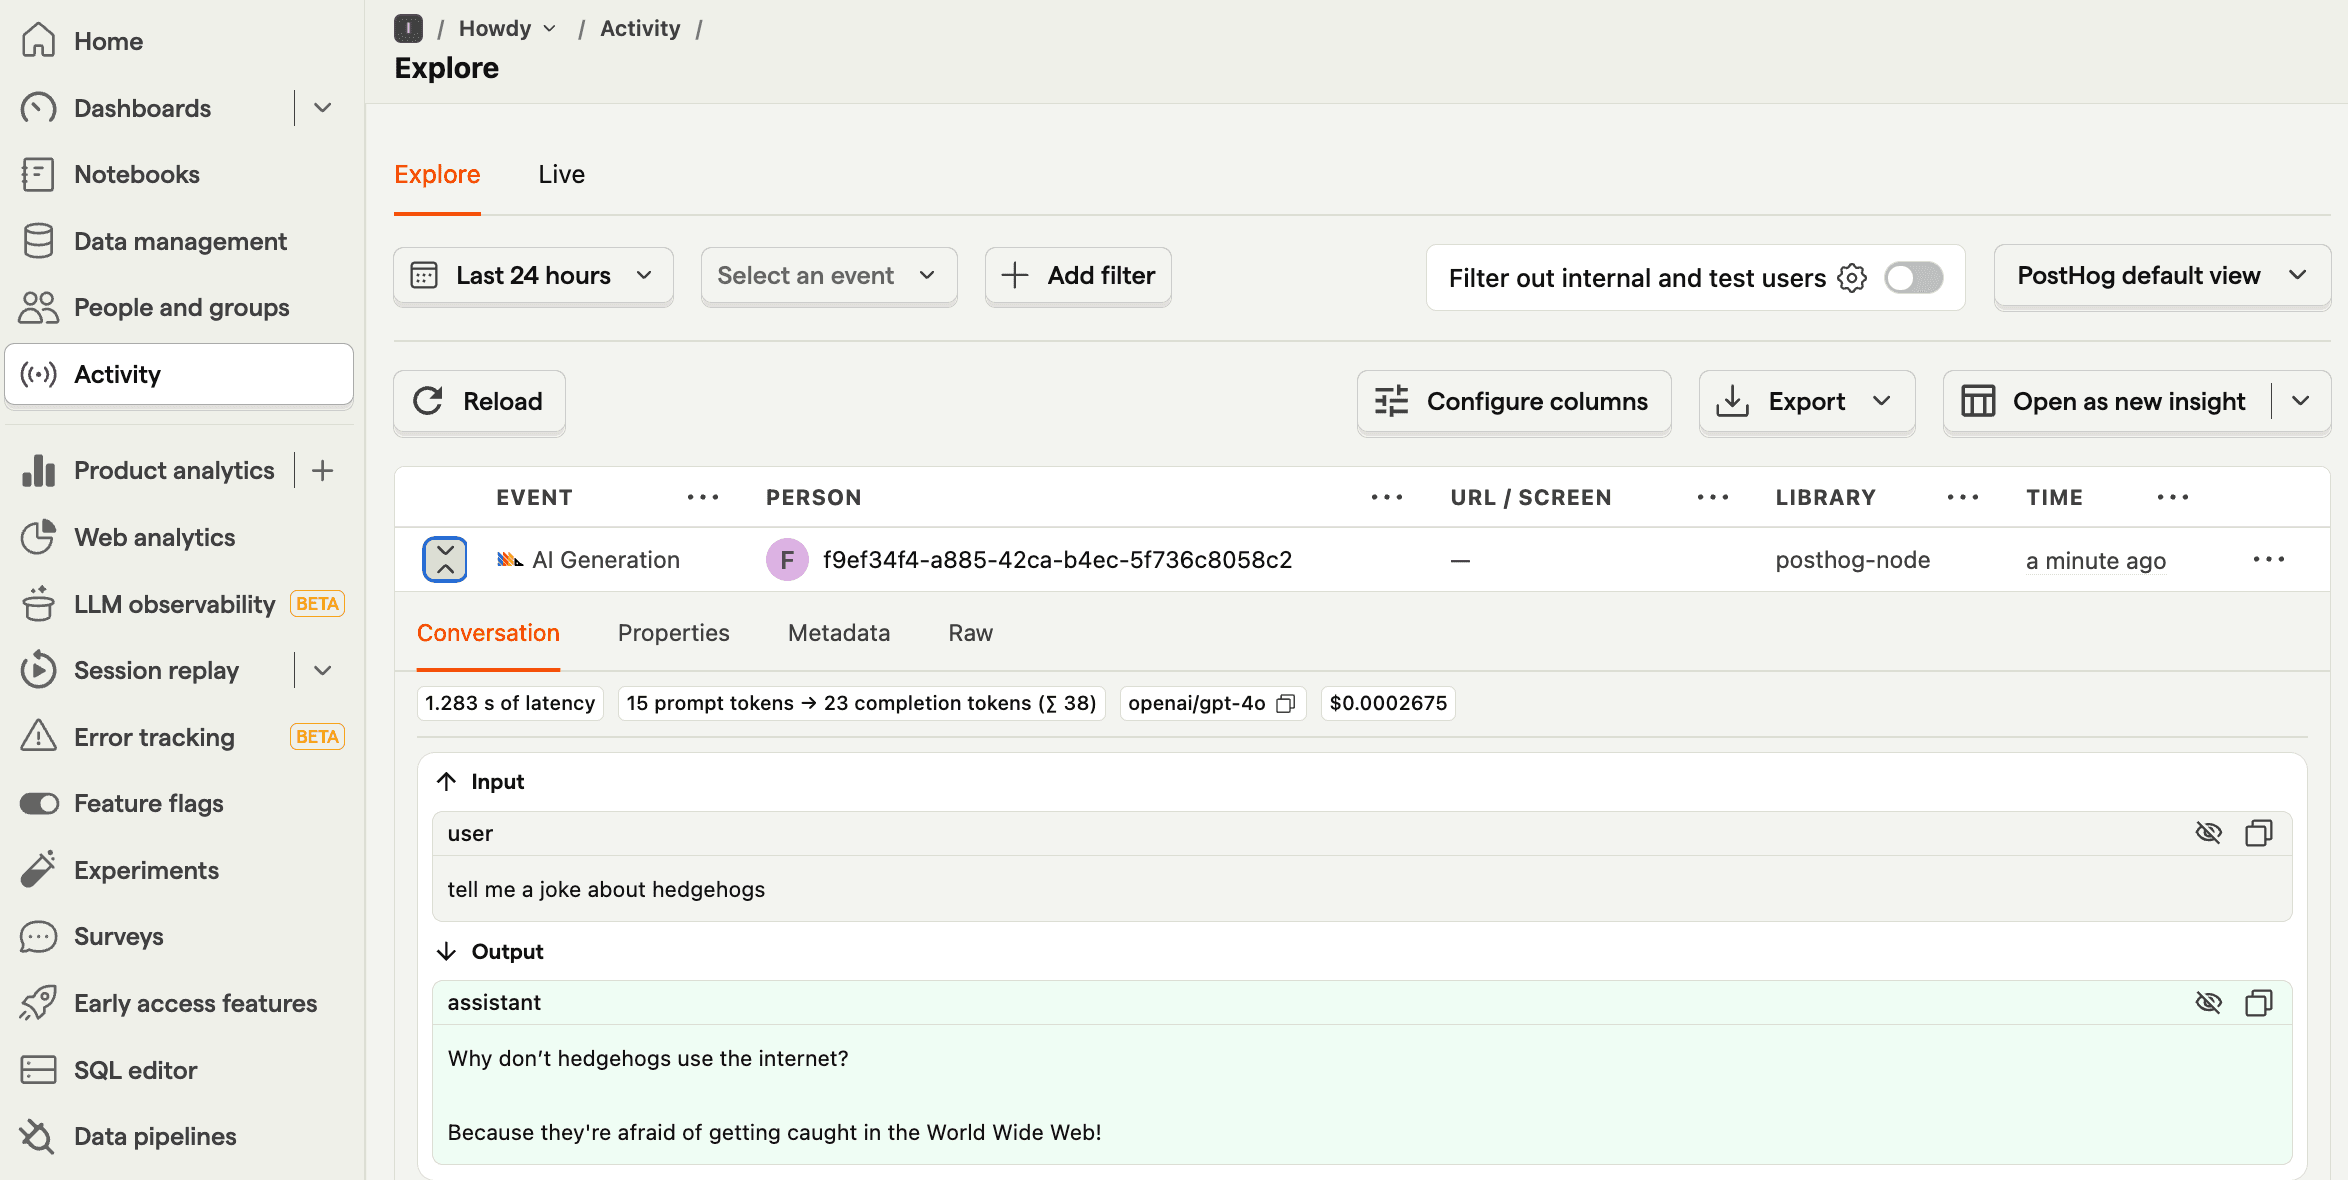
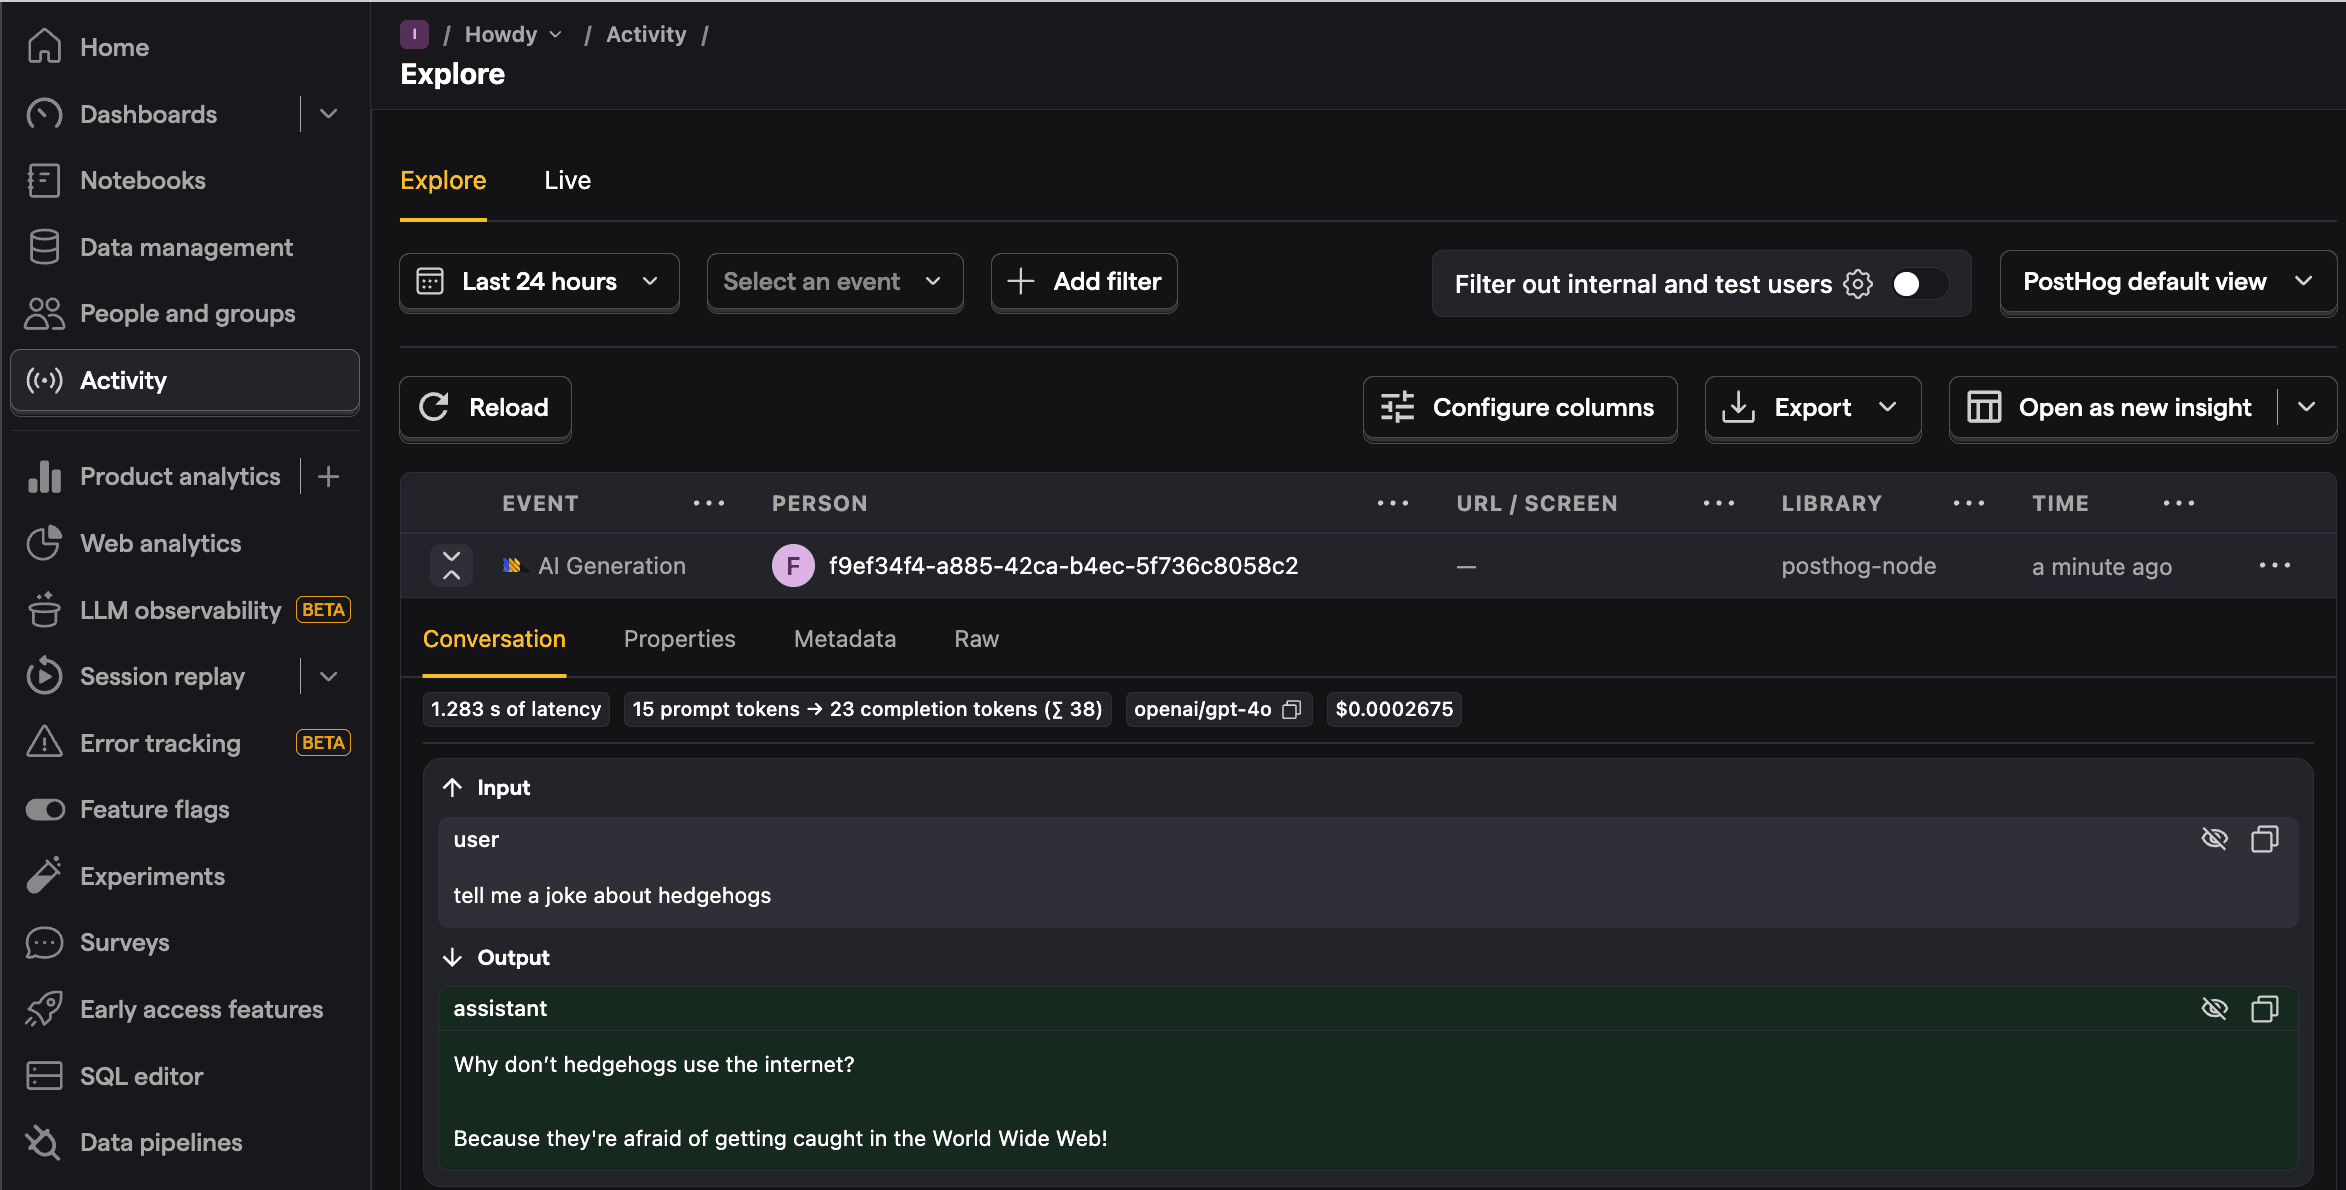
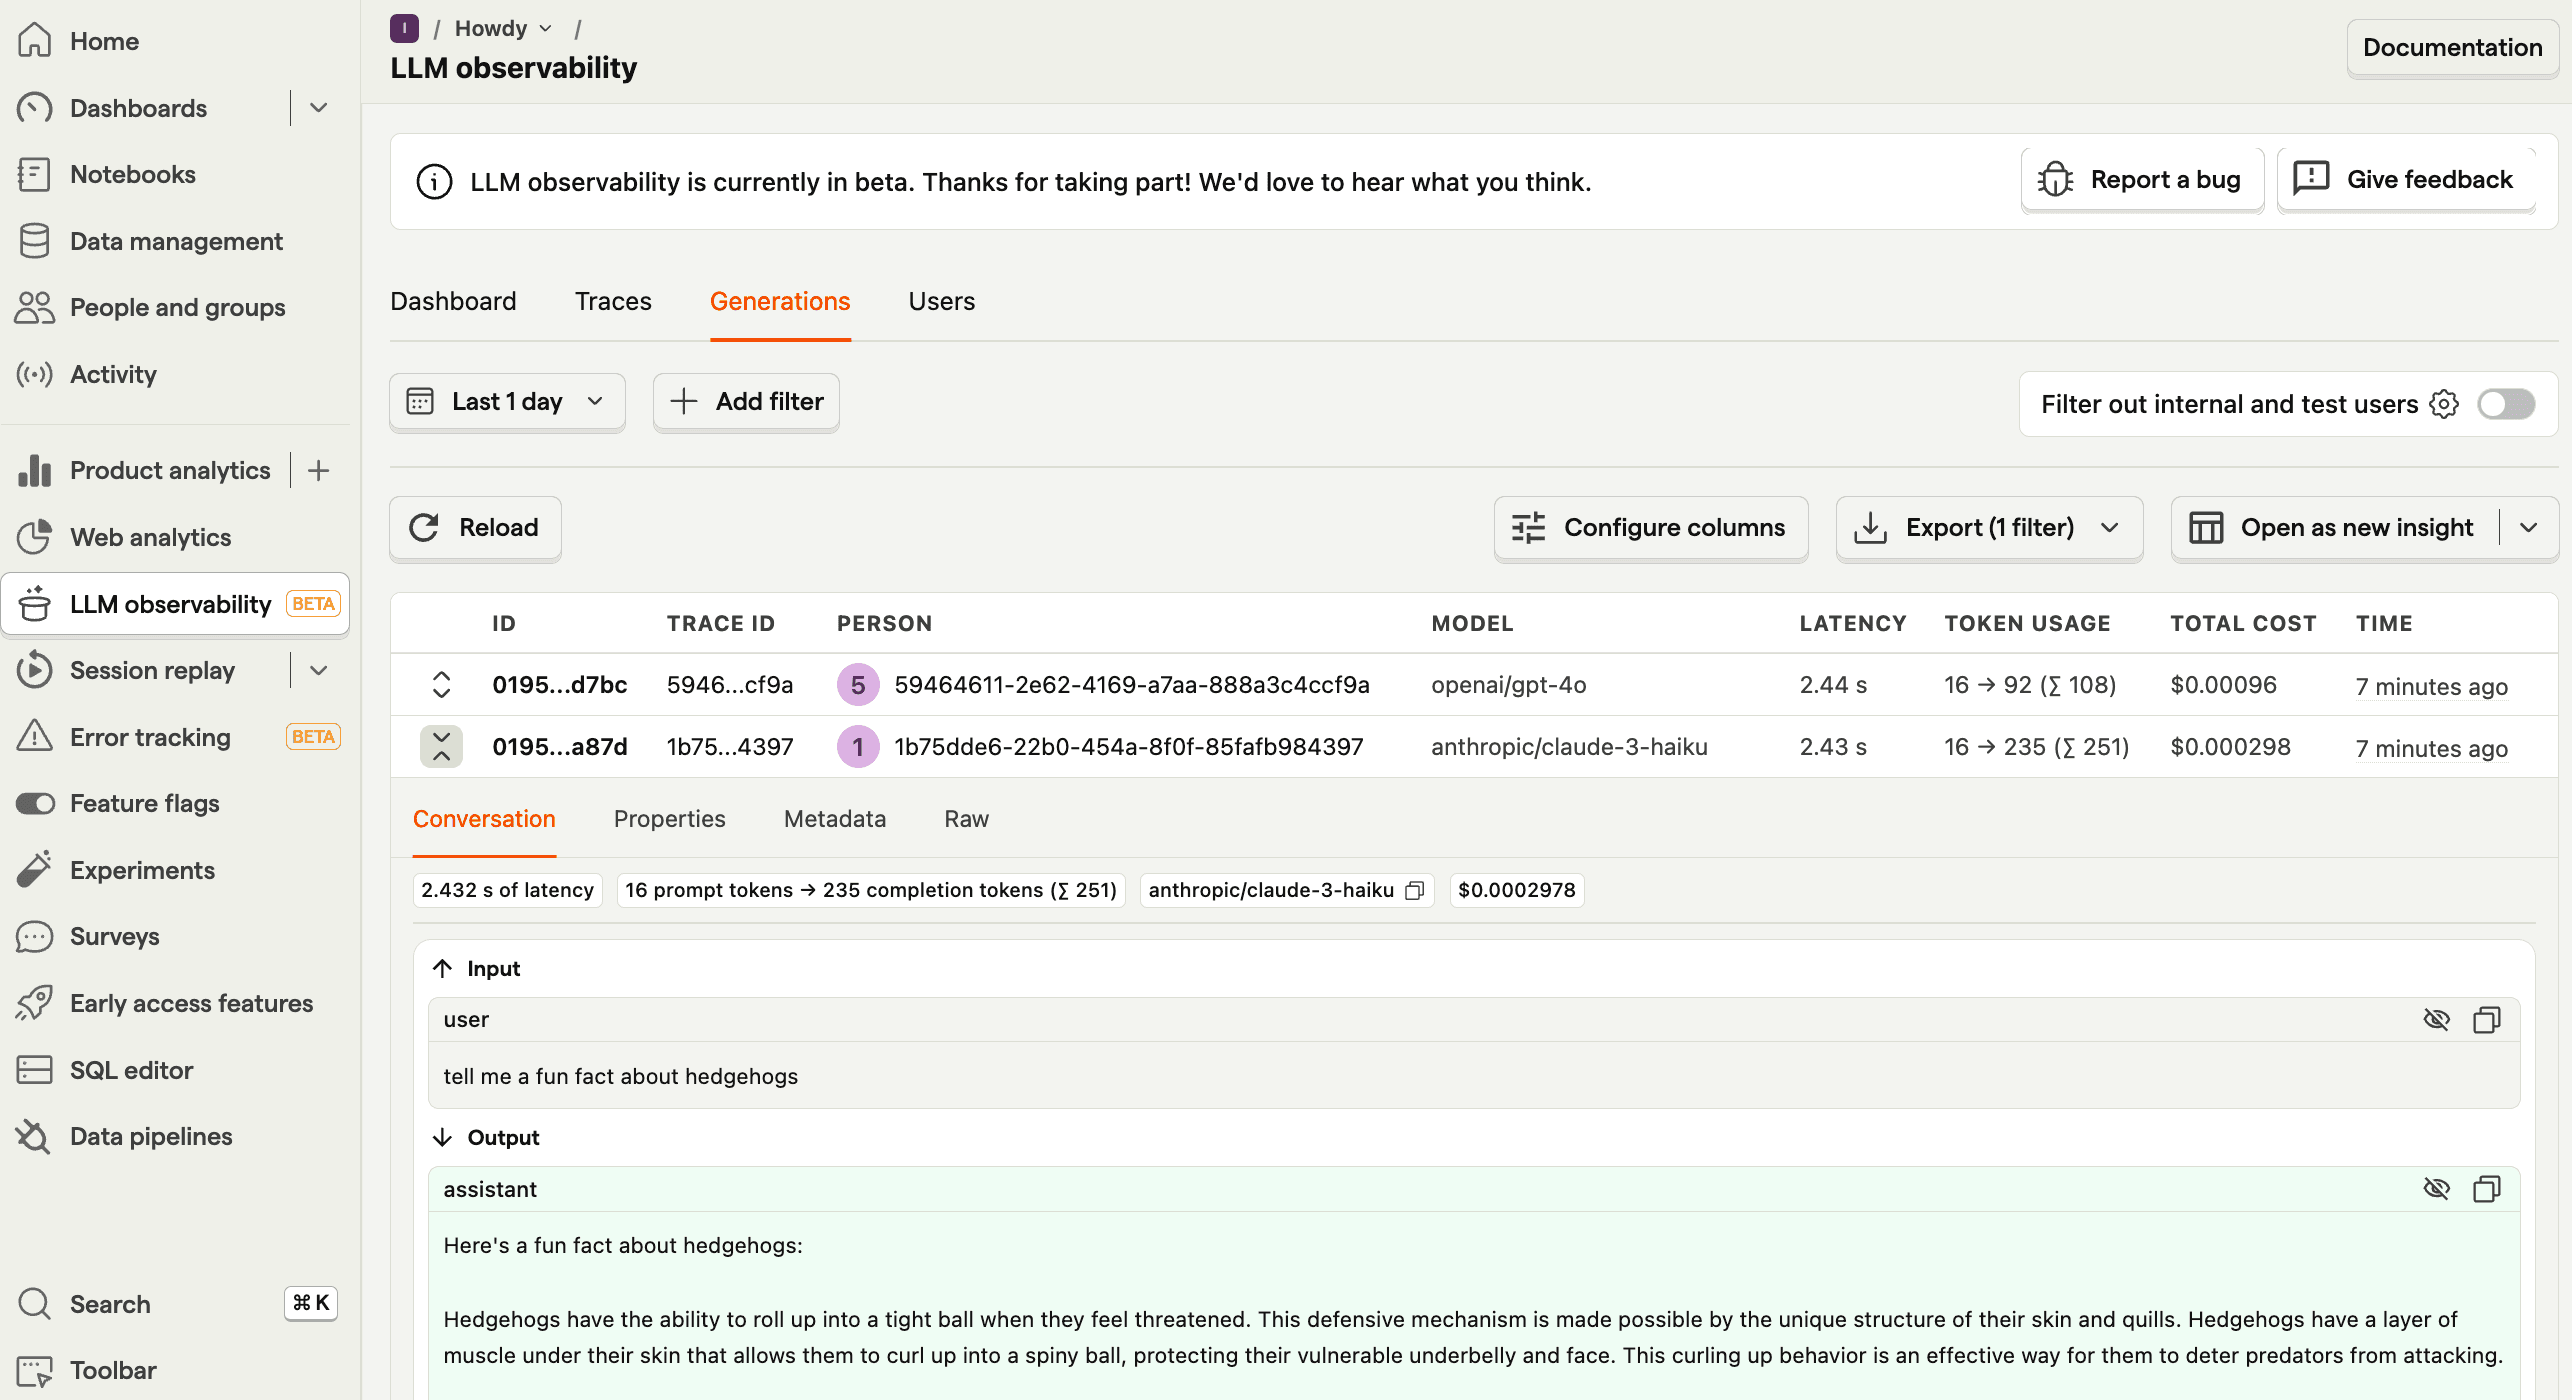
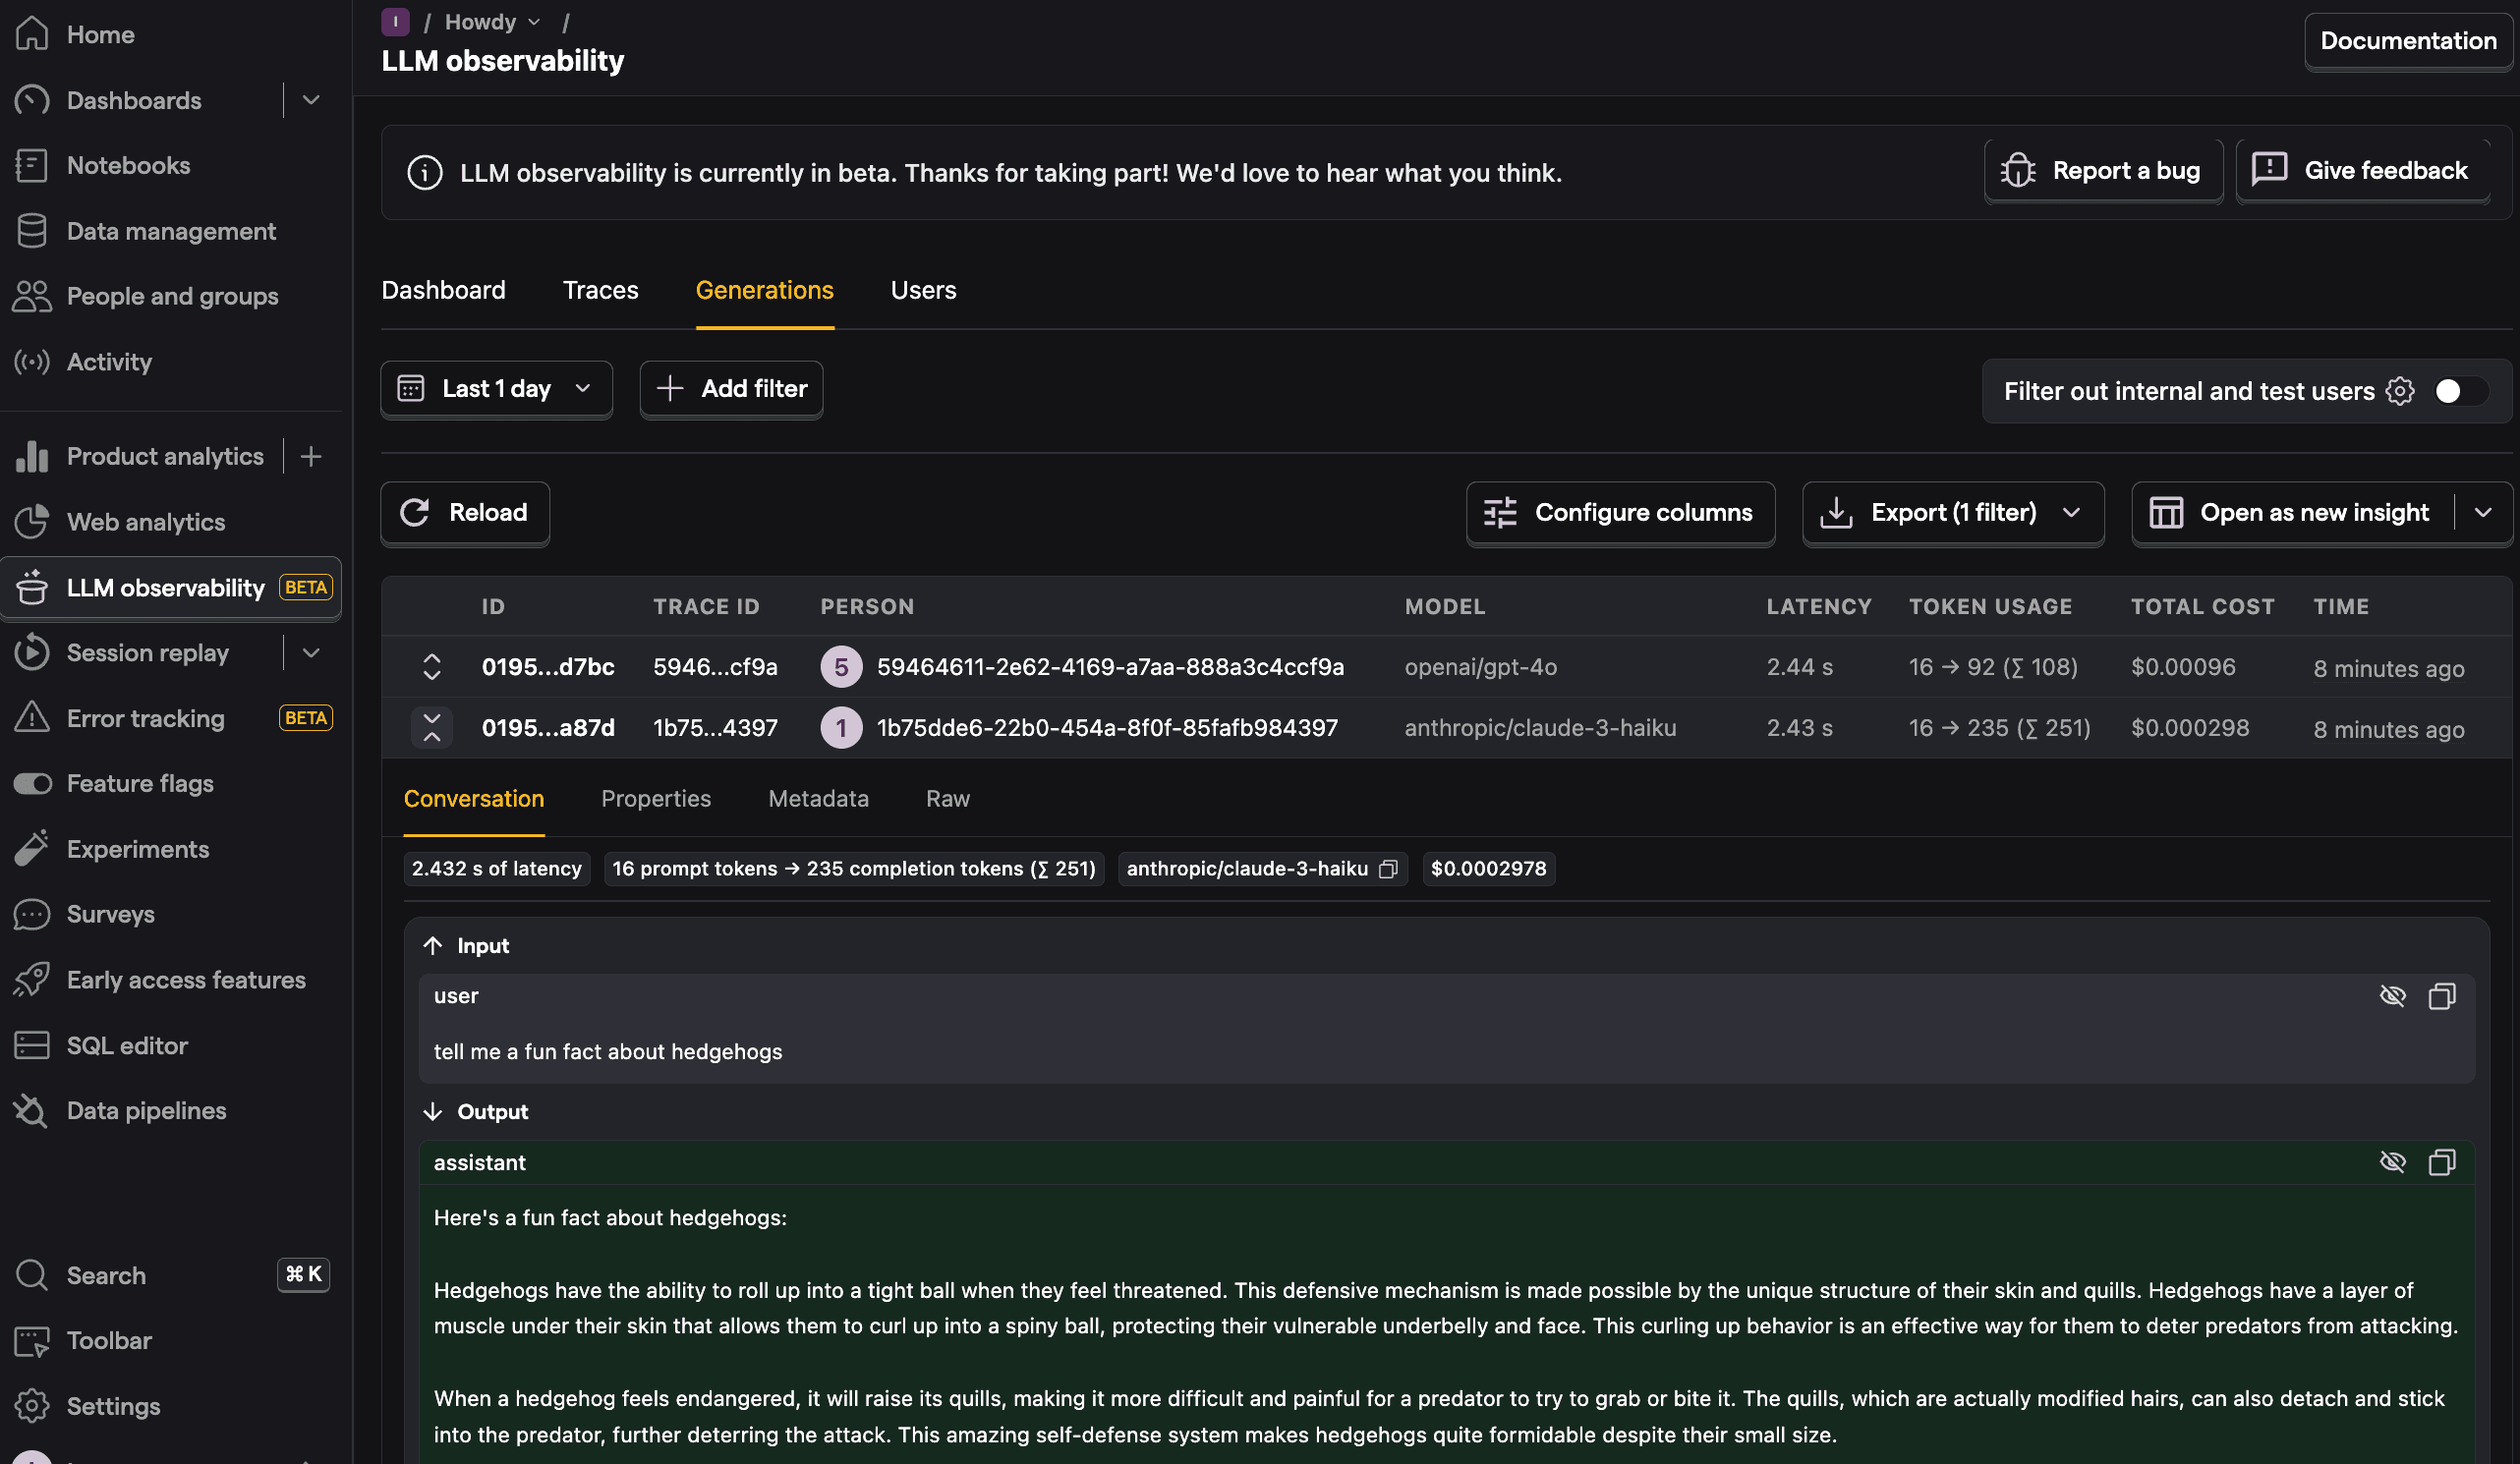
Head to the generations tab to get details on each generation as well as model, cost, token usage, latency, and more. You can even see the conversation input and output.
Further reading
PostHog is the leading platform for building self-driving products. With a full suite of developer tools – AI observability, product analytics, session replay, feature flags, experiments, error tracking, logs, and more – PostHog captures all the context agents need to diagnose problems, uncover opportunities, and ship fixes. A data warehouse and CDP tie it all together, unifying that context into one source agents can read across. You can steer it all from Slack, the web app, the desktop (PostHog Desktop), or your own editor via the MCP.