


How to set up AI Observability for Anthropic's Claude

Contents
Tracking your Claude usage, costs, and latency is crucial to understanding how your users are interacting with your AI and LLM-powered features.
In this tutorial, we'll build a basic Next.js app, implement the Claude API, and capture these events automatically using PostHog AI Observability.
1. Creating a Next.js app
To showcase how to track important metrics, we create a simple app with the following:
- A form with a textfield and button for user input
- A dropdown to select different Anthropic models
- An API route to call Claude and generate a response
- A label to show Claude's output
First, ensure Node.js is installed (version 18.0 or newer) then run the following to create a new Next.js app. Say no to TypeScript, yes to app router, and the defaults for all the other options.
After creating your app, go into the newly created claude-analytics directory and install the PostHog Node SDK and ai package as well as Anthropic's JavaScript SDK.
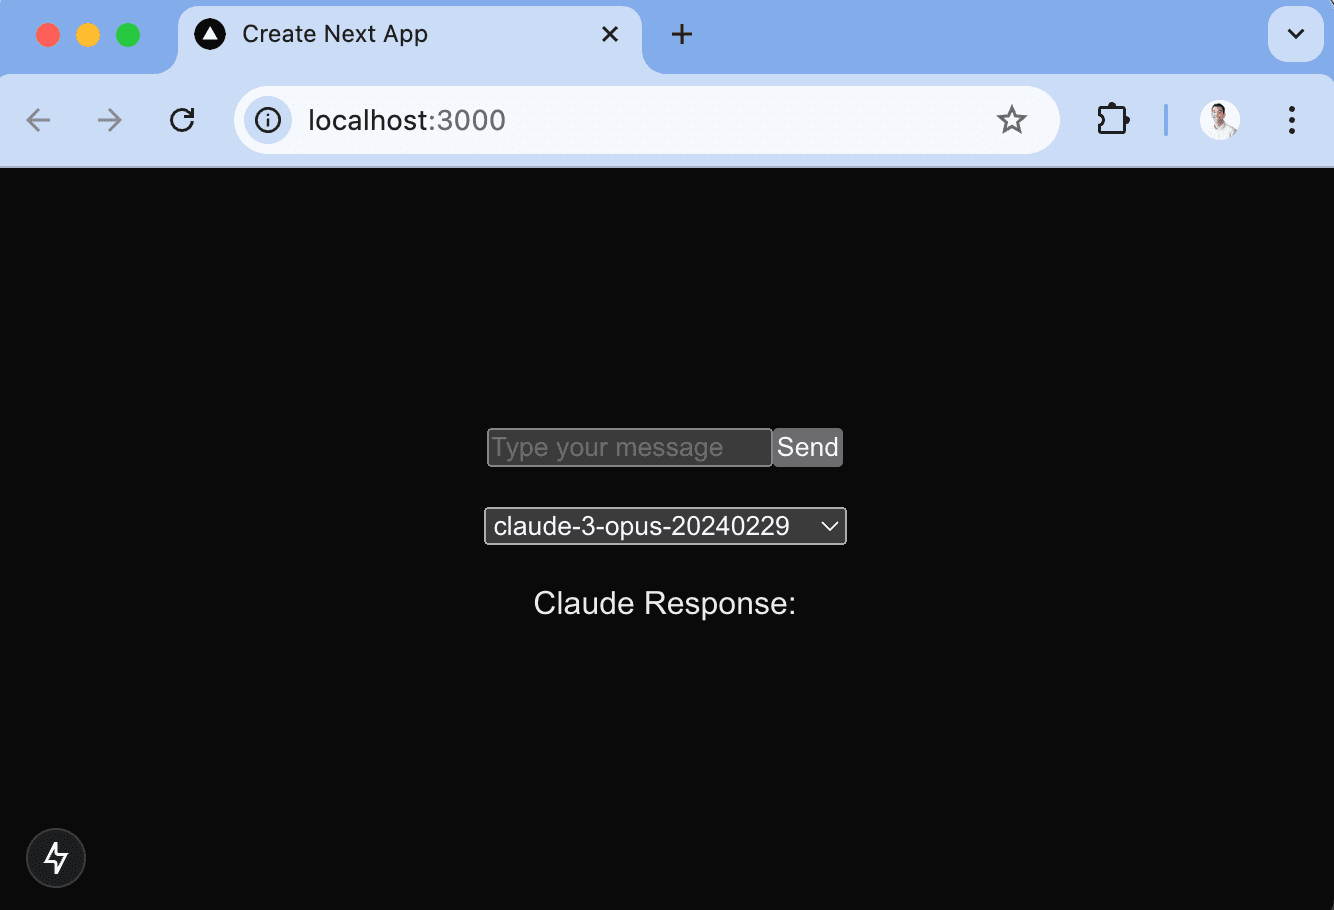
Next, we'll create our frontend by replacing the placeholder code in app/page.js. Our frontend will be a simple form with an input, model selector, and response label. Each of these needs a state. We'll also set up an API call to /api/generate with the user's input and model.
Once updated, run npm run dev to see our app in action:
2. Adding and tracking the generate API route
In the app folder, create an api folder, a generate folder inside it, and then a route.js file in that. This is our /api/generate API route that calls the Claude API and returns the response.
Next, set up:
- The PostHog Node client using our project token and API host which you can get from your project settings.
- The Anthropic client which requires an API key from your Anthropic console.
With both of these set up, we simply call the anthropic.messages.create method with the input and model then return the response. You can include a posthogDistinctId if you want to track specific users.
Now, when we run npm run dev again and submit an input, we should see a response as well as the generation autocaptured into PostHog as a $ai_generation event.
3. Viewing generations in PostHog
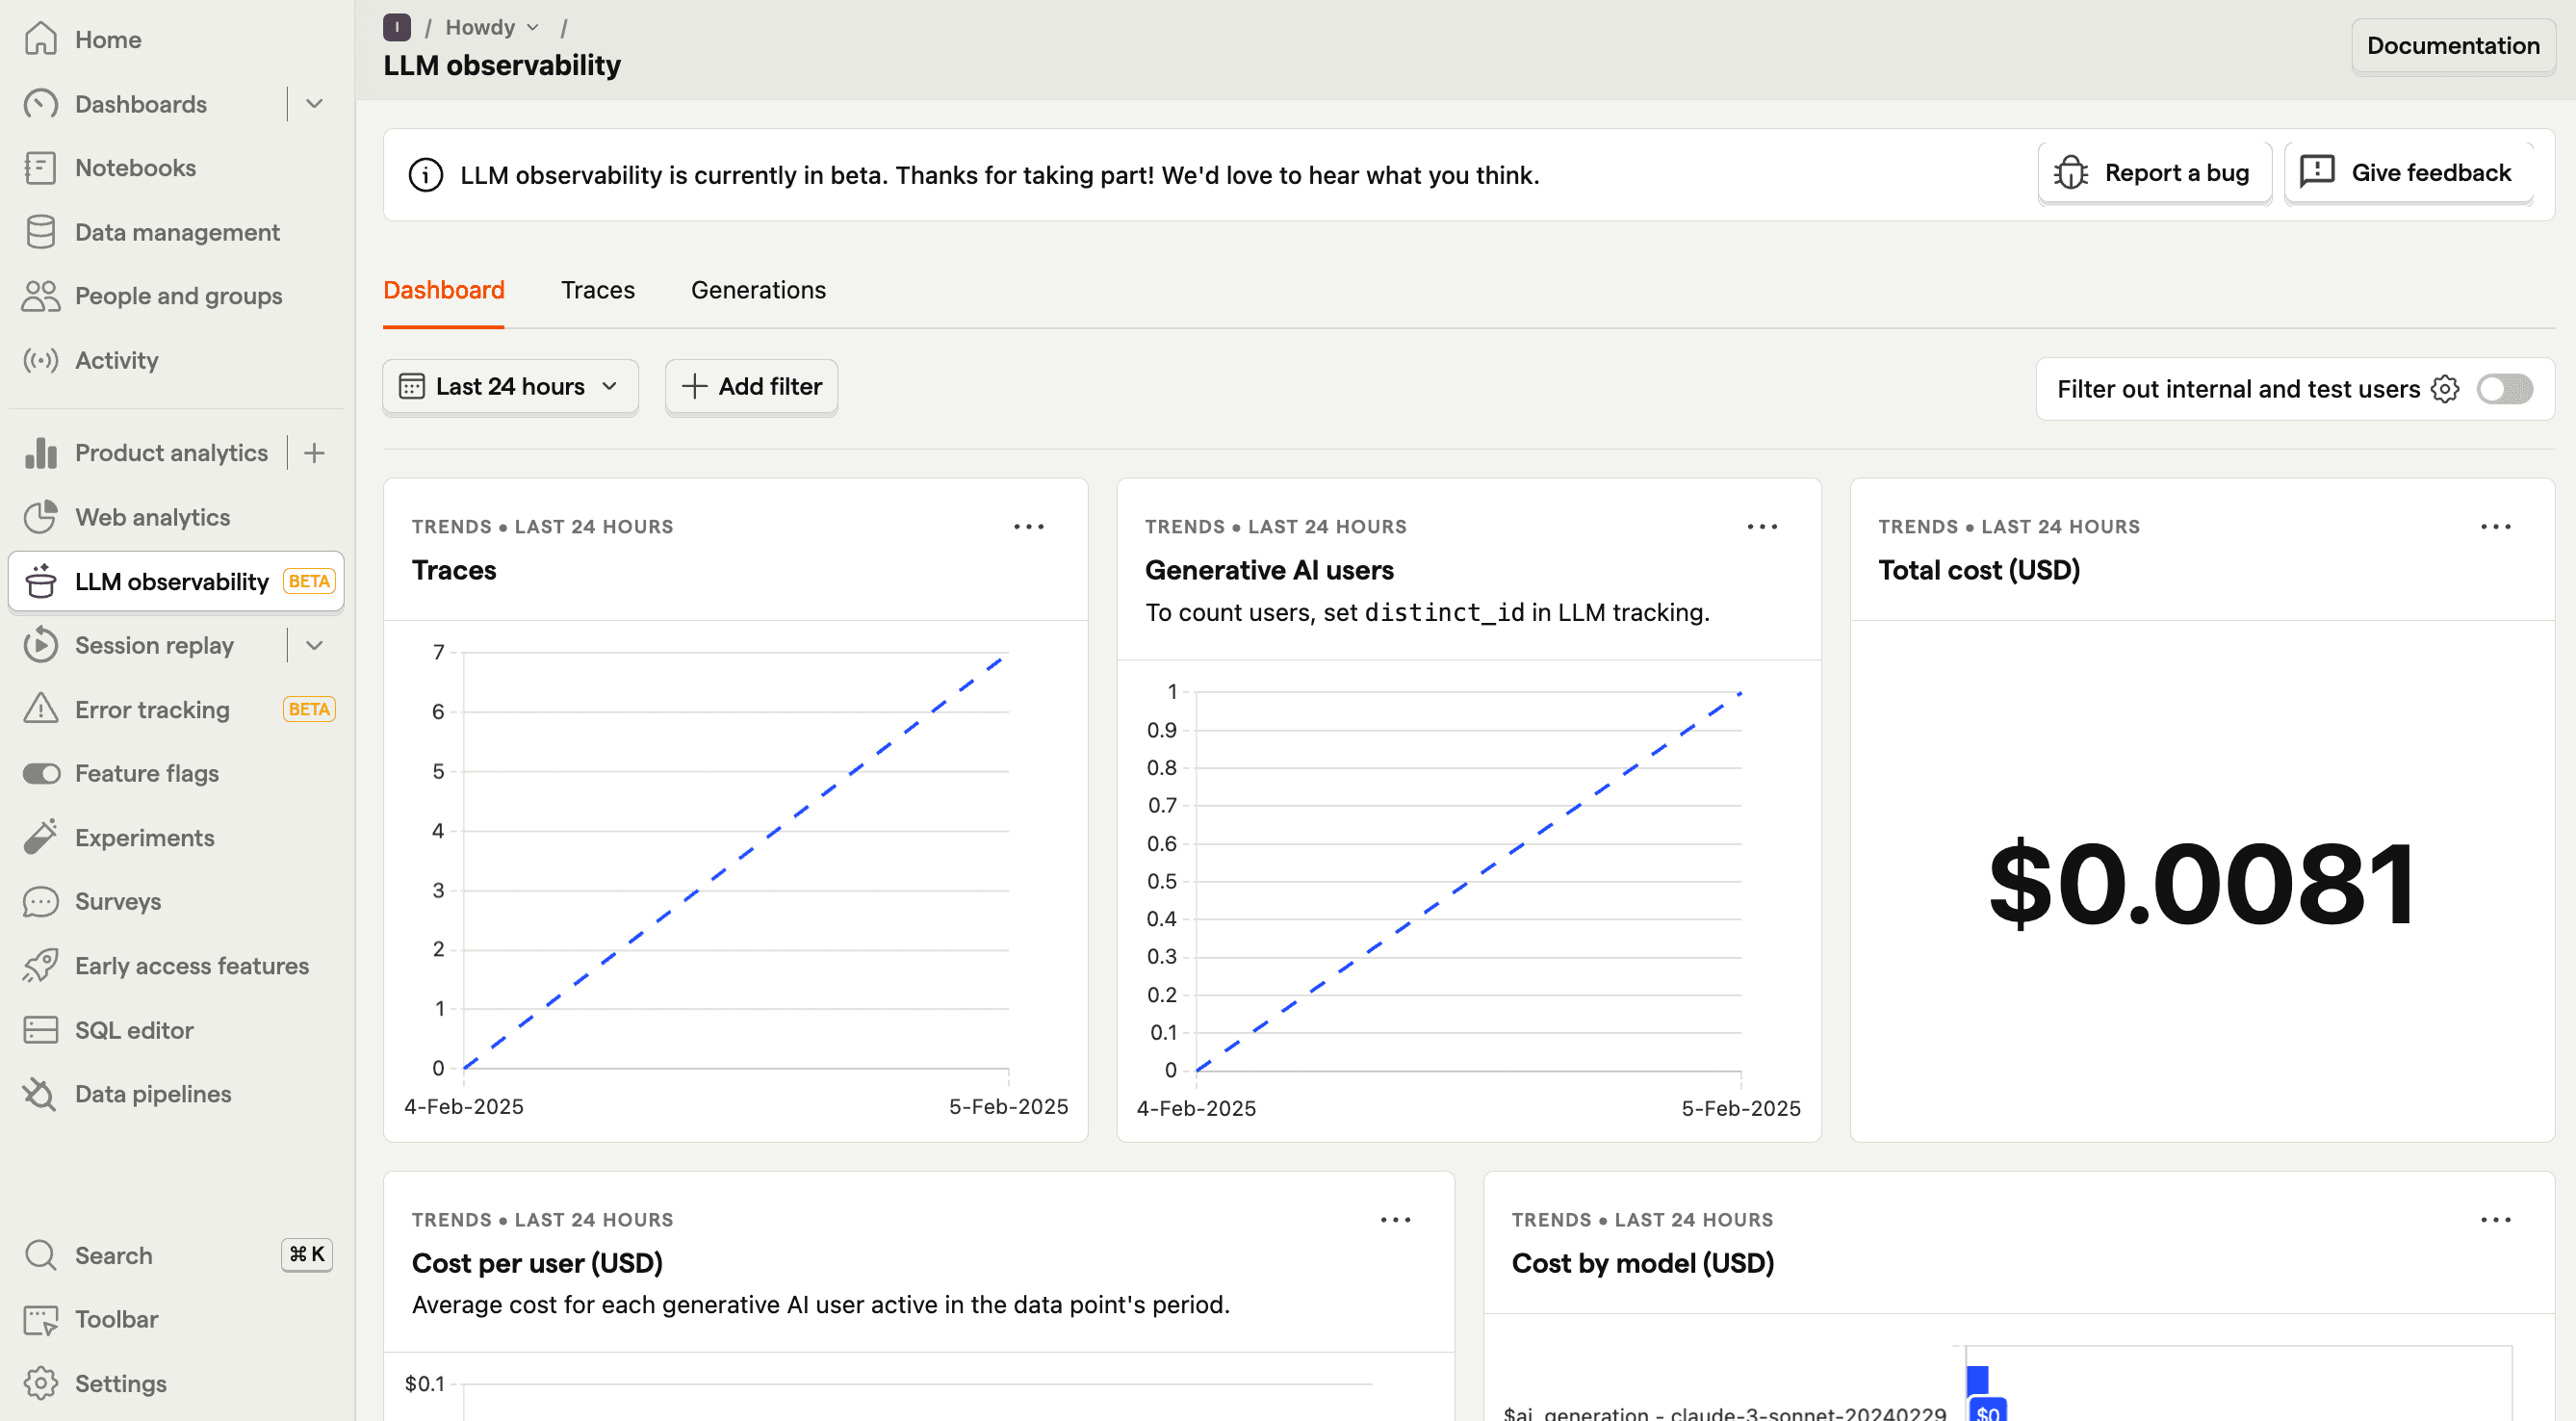
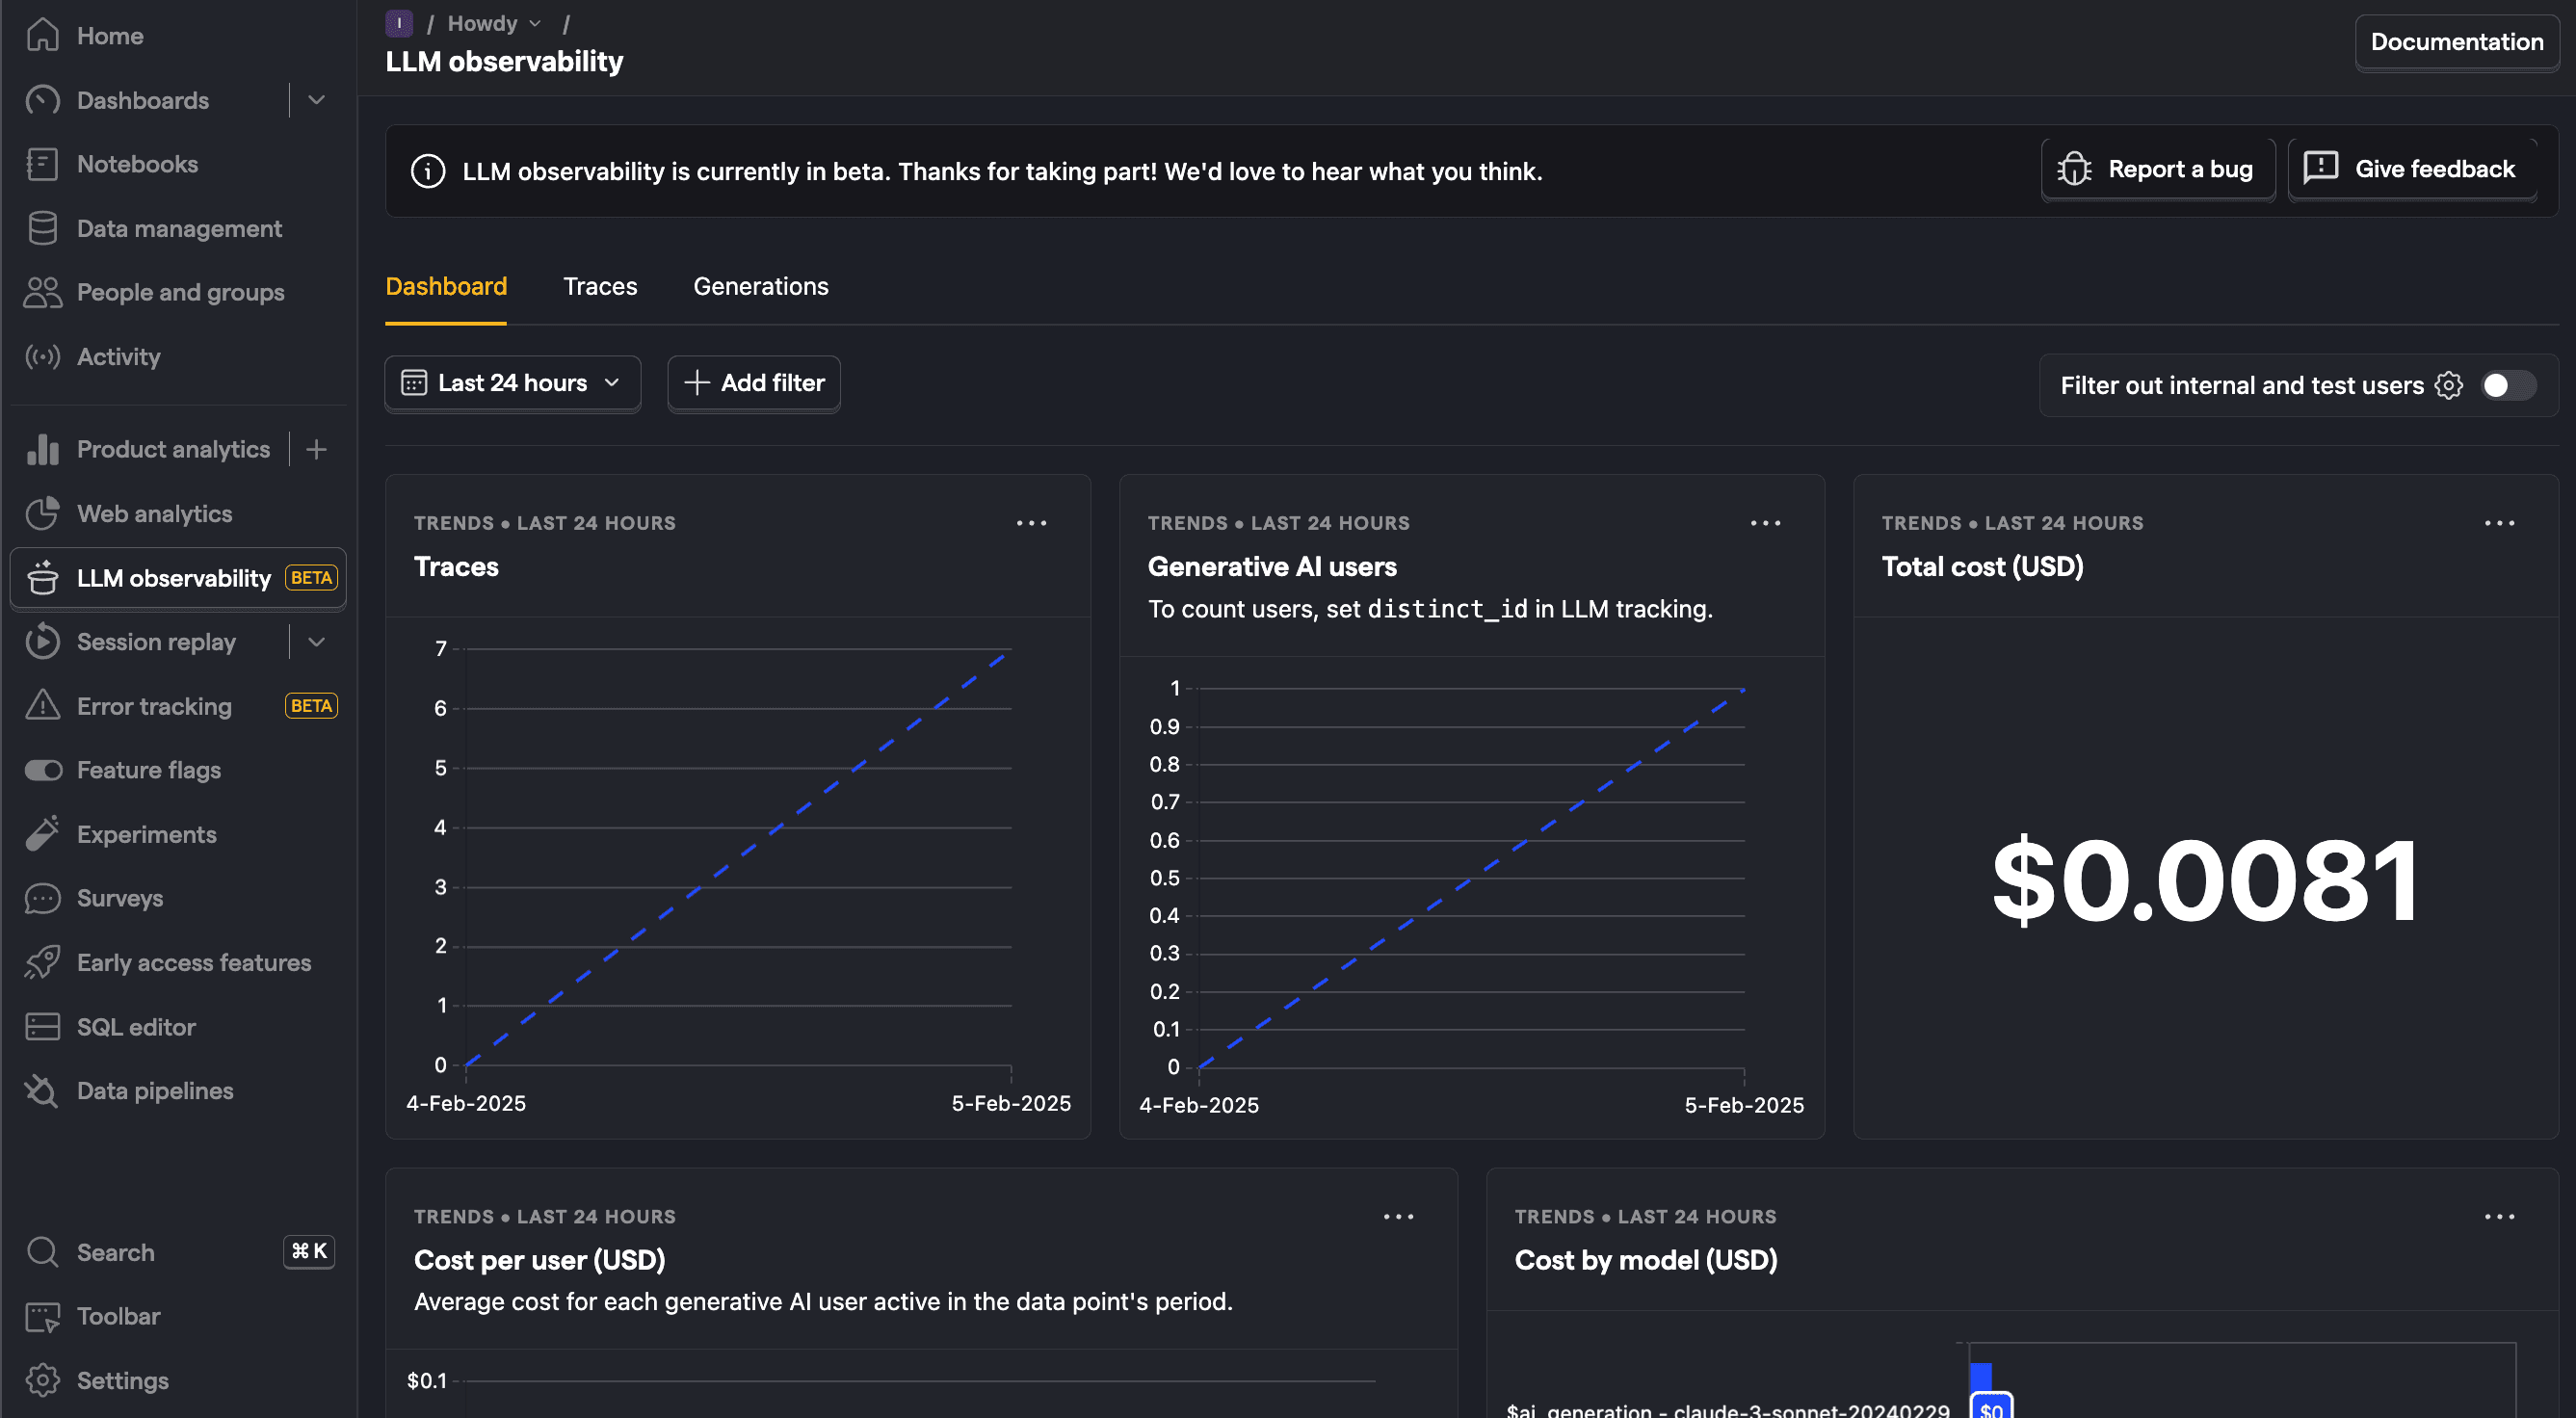
Once you generate a few responses, go to PostHog's AI Observability tab to get an overview of traces, users, costs, and more.
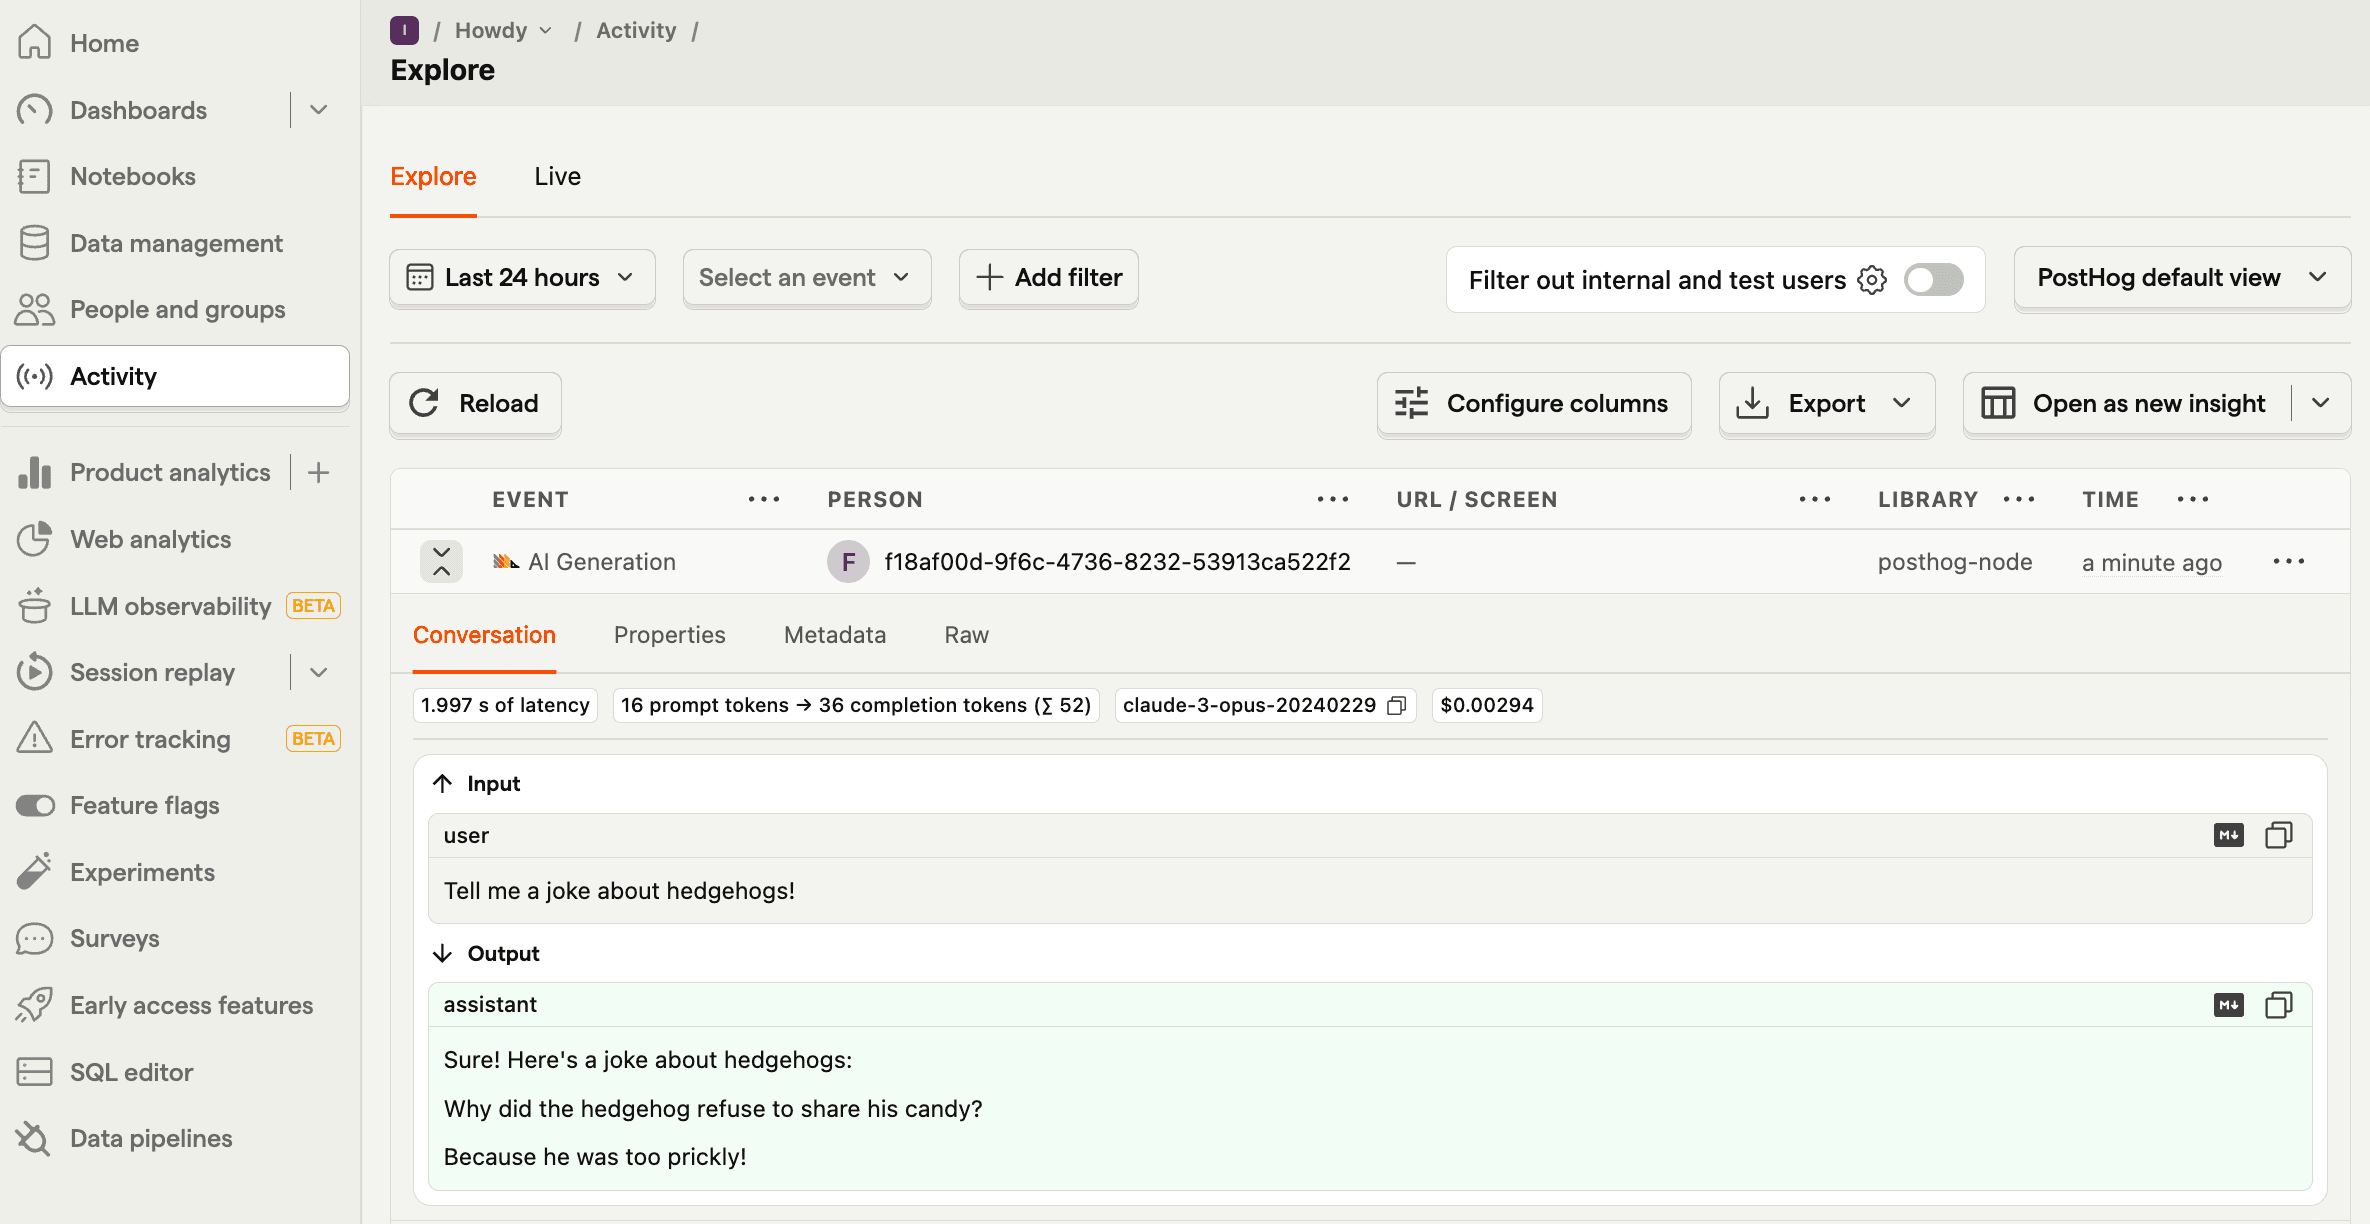
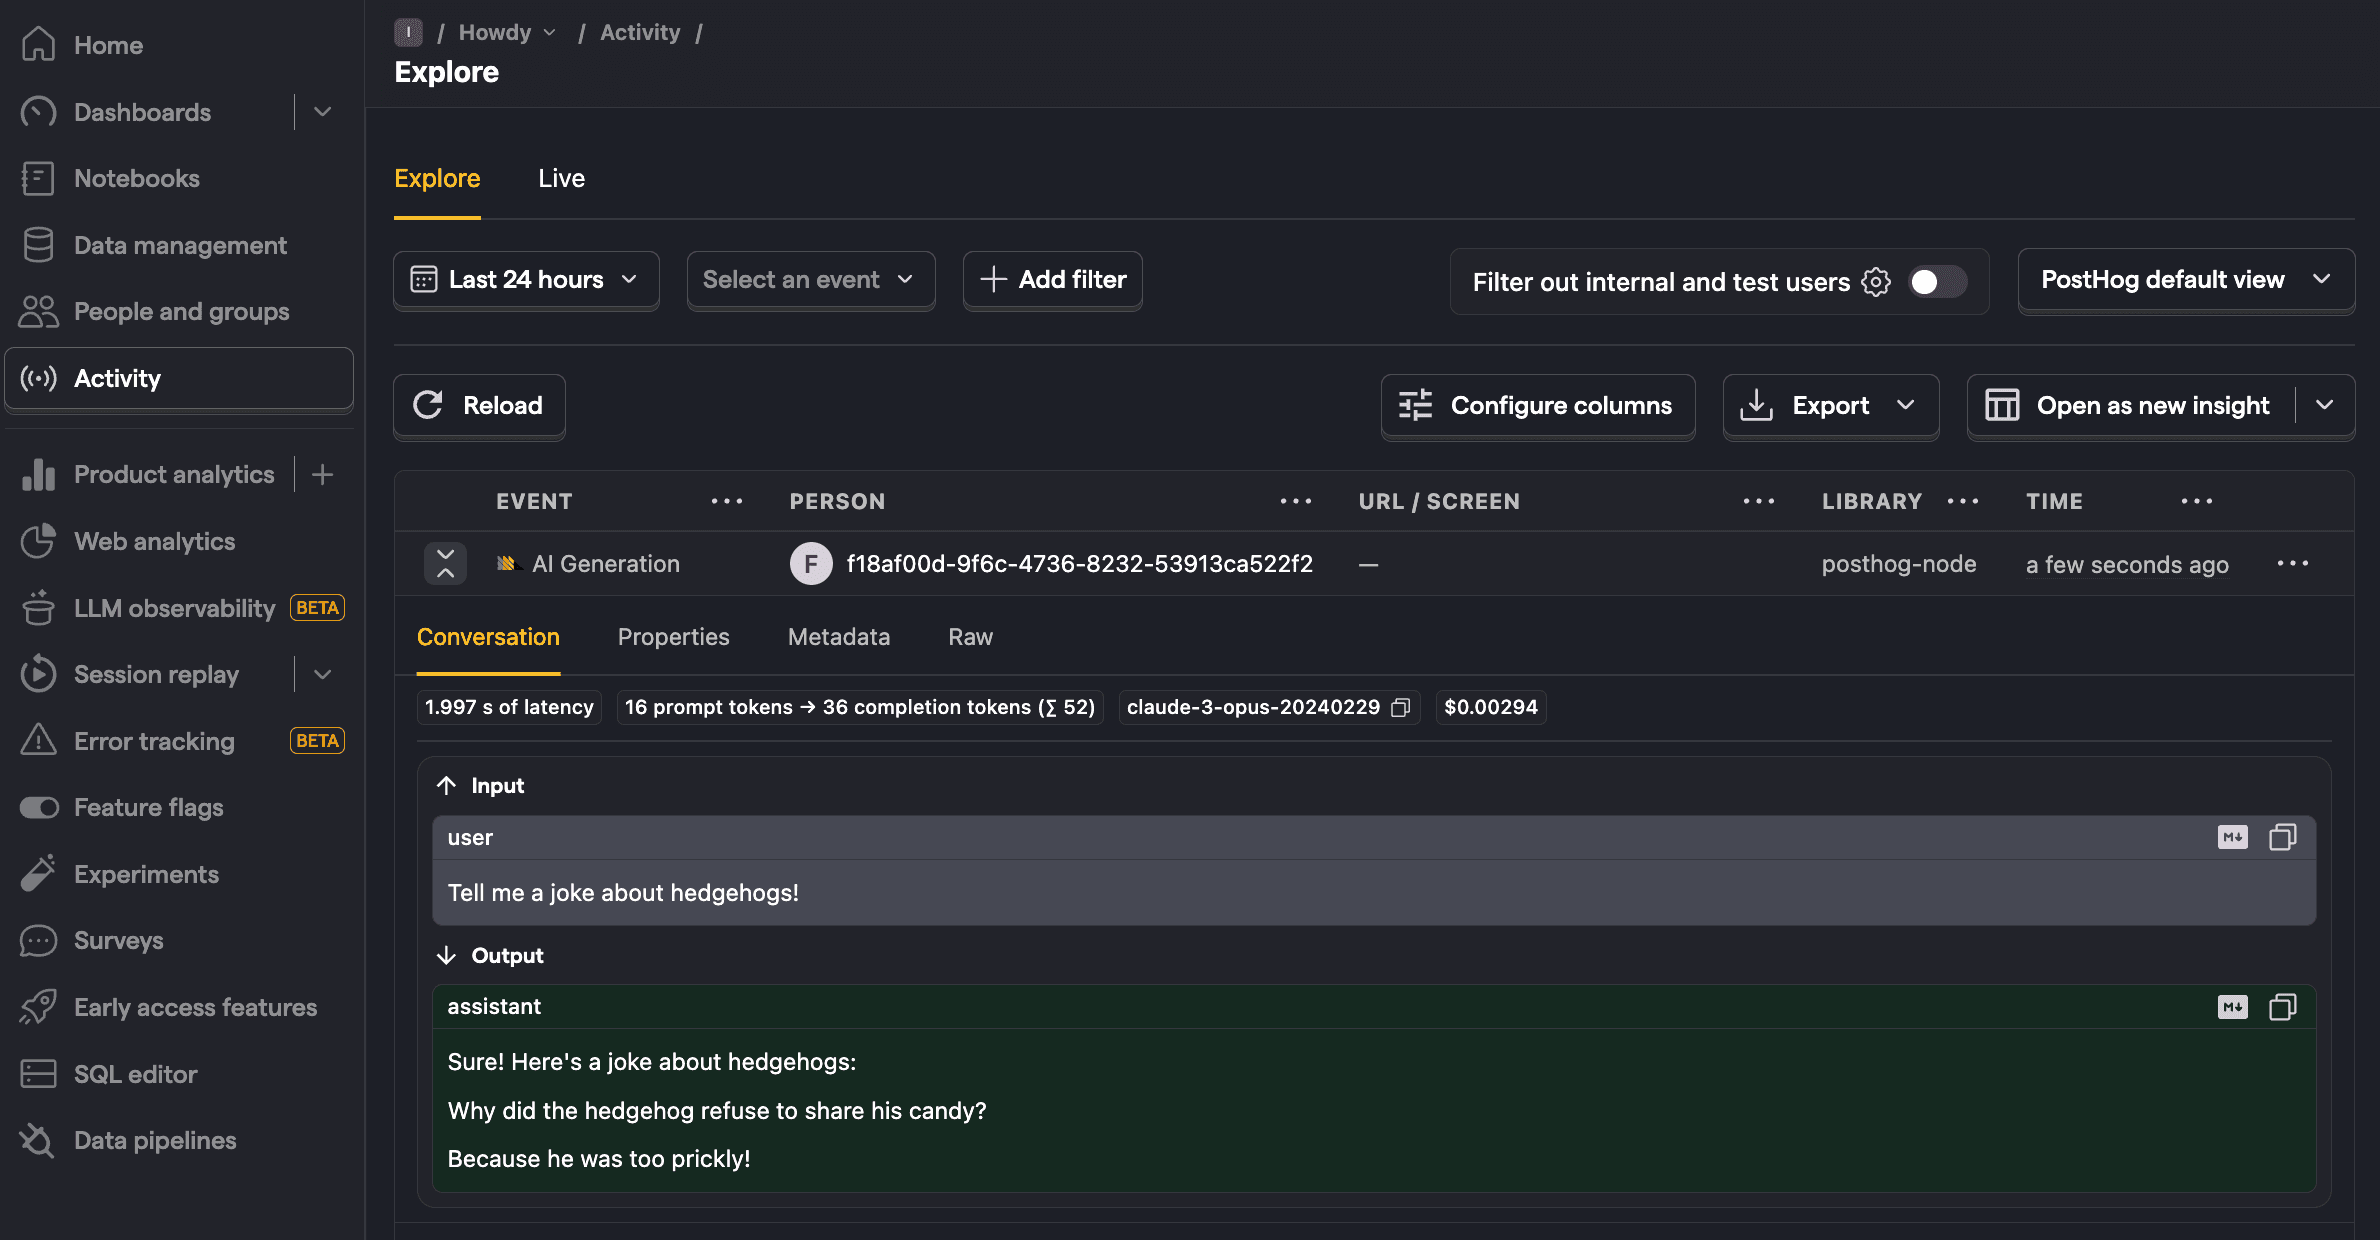
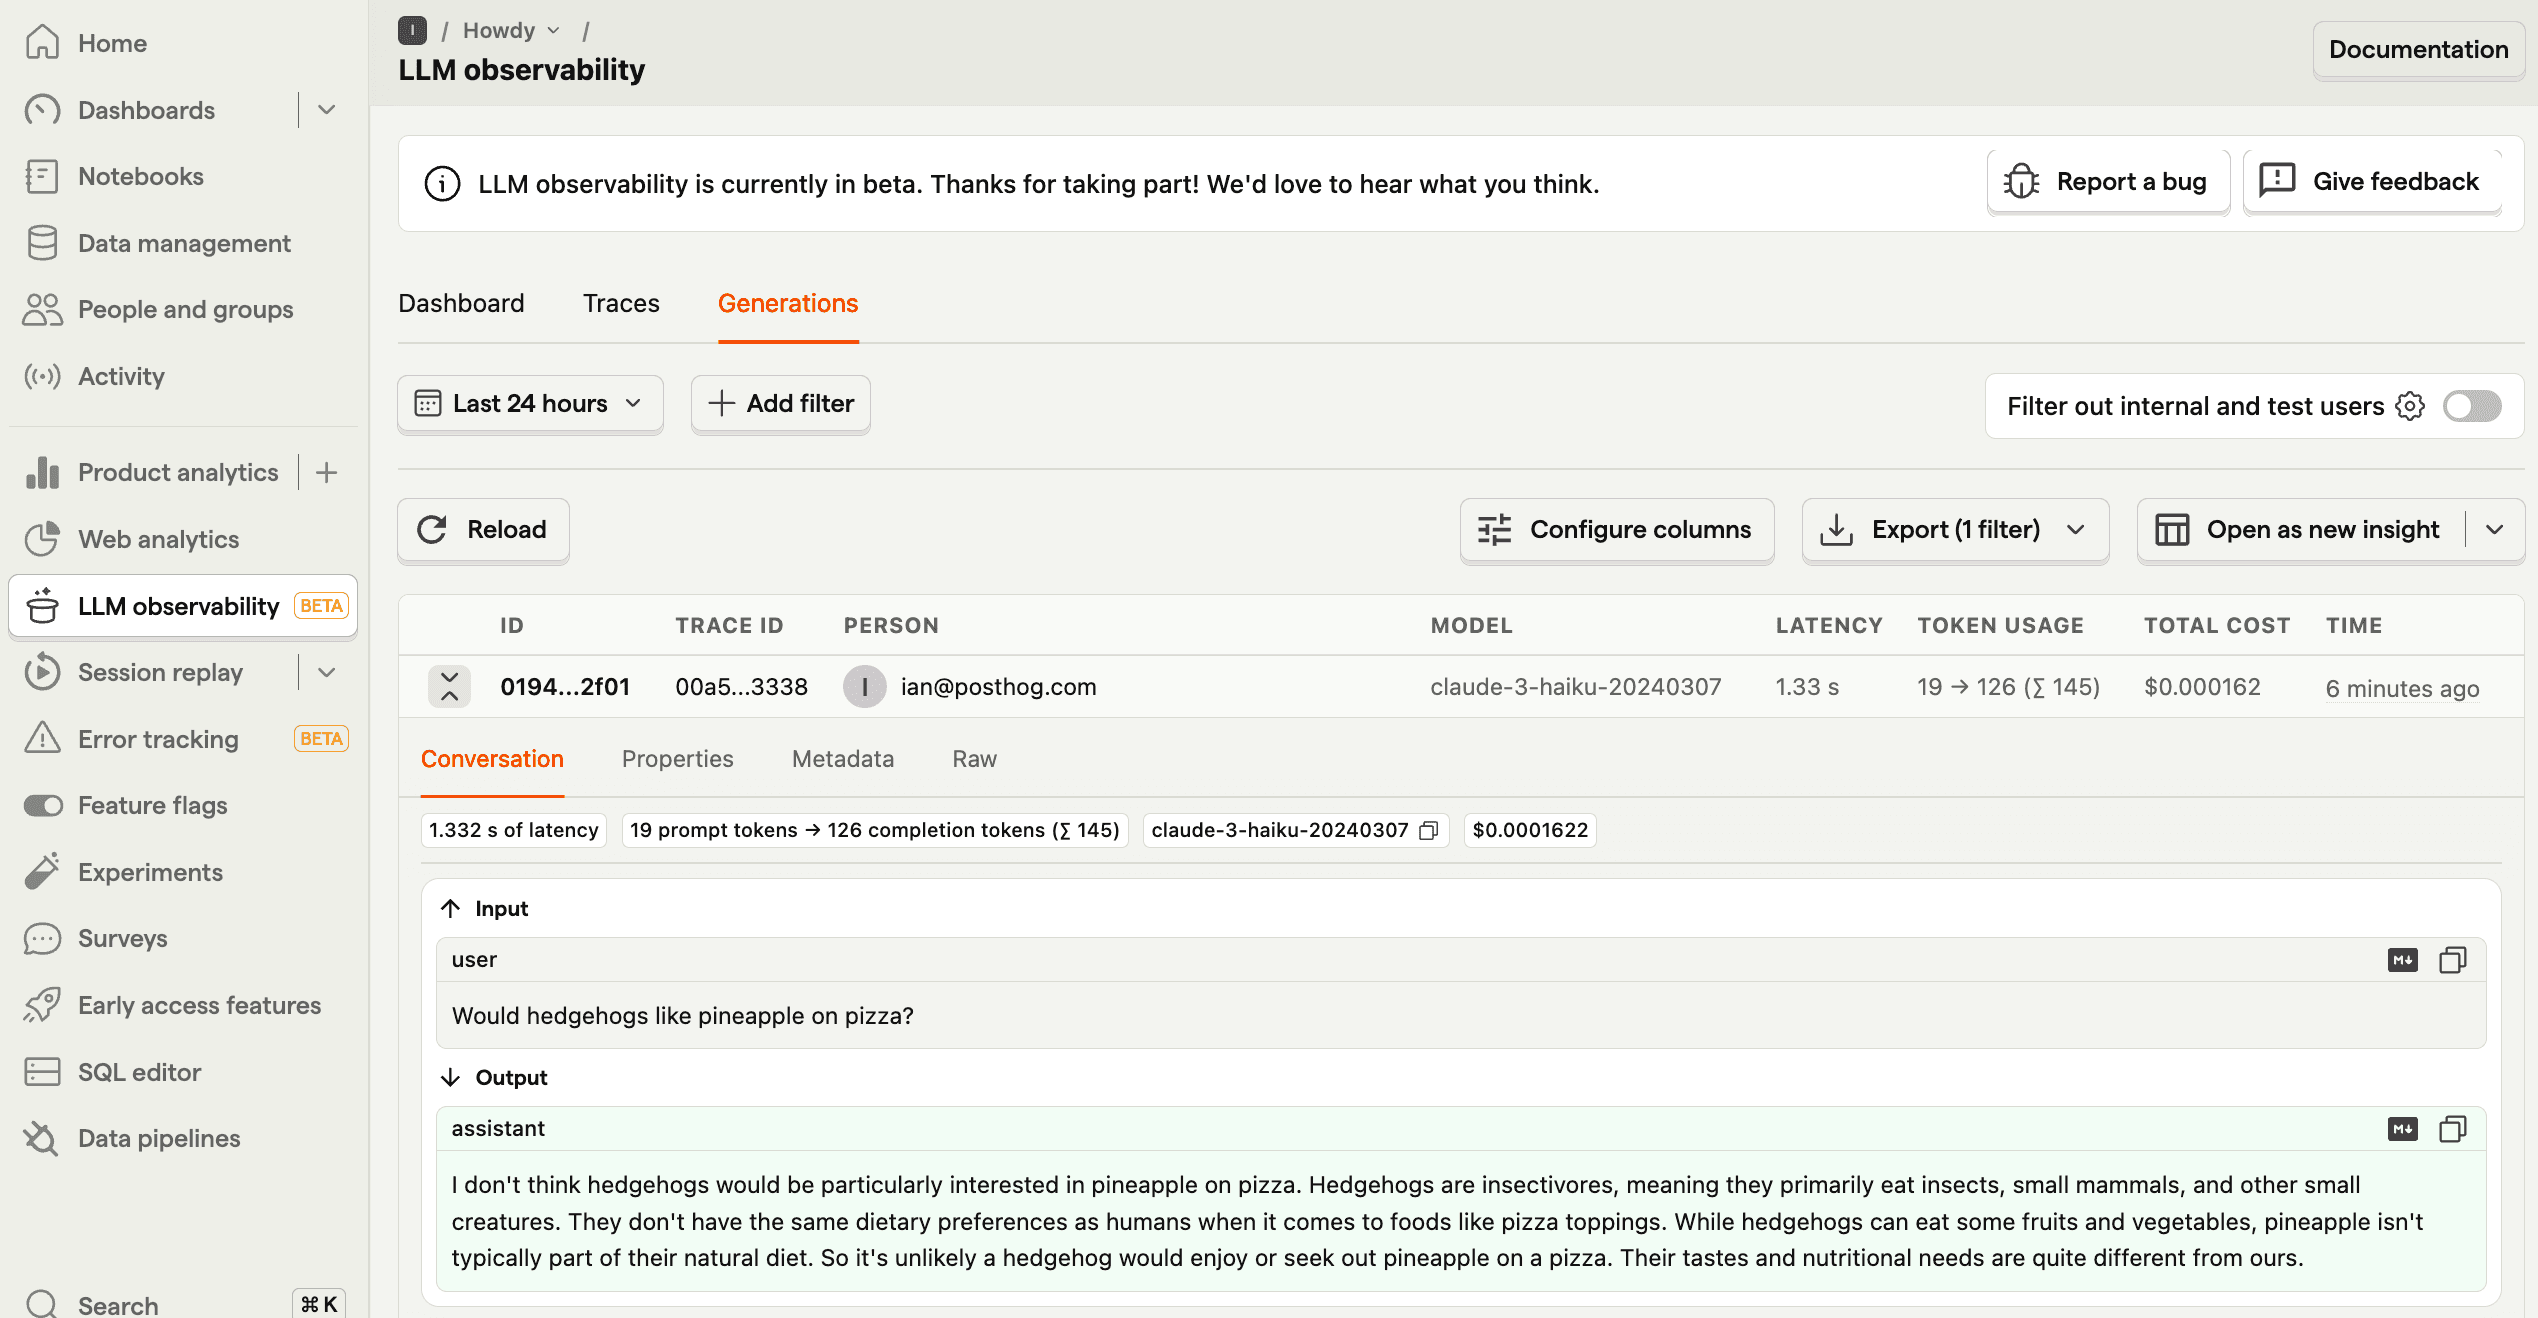
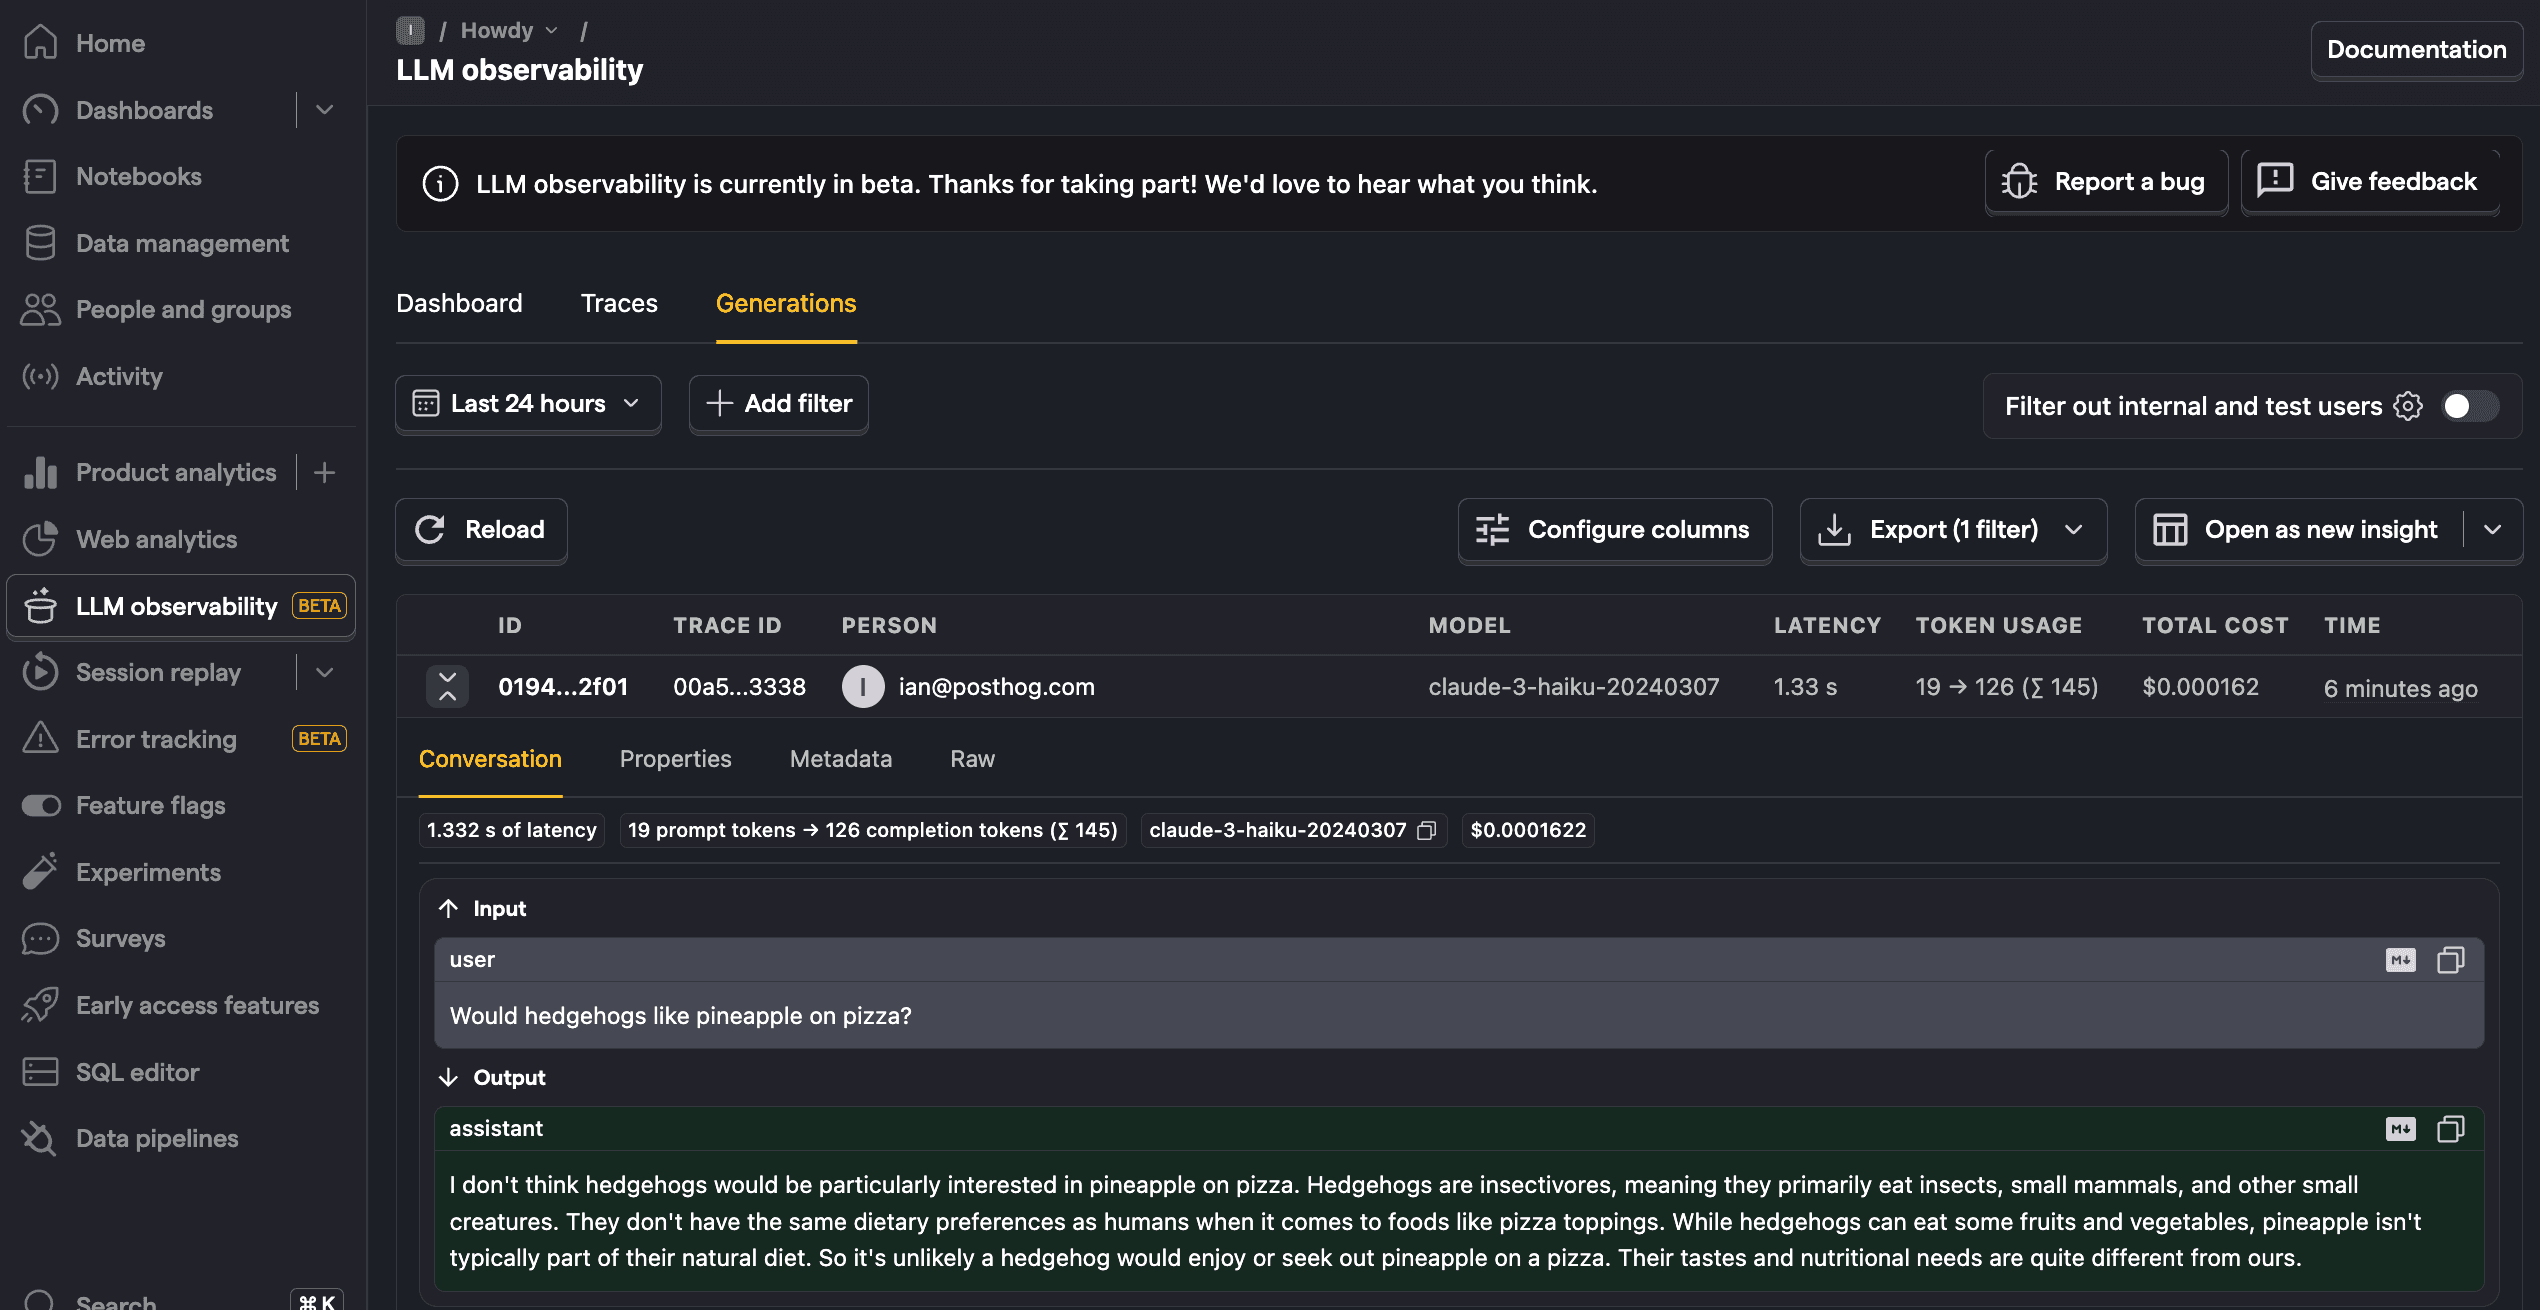
You can also go into more detail by clicking on the generations tab. This shows each generation as well as model, cost, token usage, latency, and more. You can even see the conversation input and output.
From here, you can go further by filtering your AI Observability dashboard, use the $ai_generation event to create insights, A/B test models, and more.
Further reading
PostHog is the leading platform for building self-driving products. With a full suite of developer tools – AI observability, product analytics, session replay, feature flags, experiments, error tracking, logs, and more – PostHog captures all the context agents need to diagnose problems, uncover opportunities, and ship fixes. A data warehouse and CDP tie it all together, unifying that context into one source agents can read across. You can steer it all from Slack, the web app, the desktop (PostHog Desktop), or your own editor via the MCP.