

A non-technical guide to understanding data in PostHog

Contents
Non-technical users have many tools in PostHog for gaining insights from their product data. You don’t need to be a software engineer, but you do need some knowledge of your data. Knowing the formatting and structure of your data, for example, is key to getting the most out of PostHog as a non-technical user.
In this tutorial, we’ll go through how you can understand your product’s data in PostHog. This allows you to find the data you want, format it in the right way, and generate insights to improve your product.
This tutorial assumes your technical team set up PostHog in your app or site, and you have data to work with. Read our event tracking guide for details on setting this up if not.
1. Explore other’s creations
In school, using someone else’s work is cheating; in real life, it's “collaboration.” Exploring teammates’ work in PostHog is a great way to get started understanding the data there.
The best place to do this is through the dashboards and insights other people in your organization created. To find them, click “Dashboards” on the sidebar. If you’re looking for the most important ones, they might be under “Pinned.”
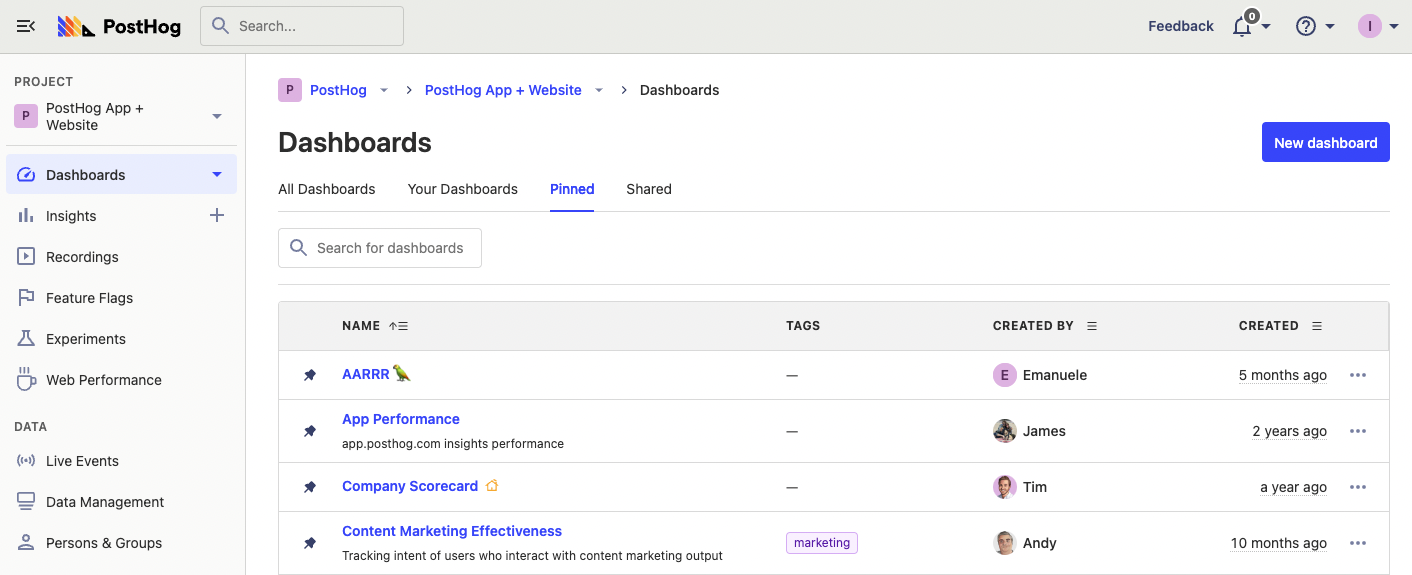
When you click into a dashboard, don’t only look at the visualizations, but click “show details” to show the queries and filters behind them. Even better, click on the title of the visualizations, go to the insight detail view, and click Edit (don’t worry, we won’t save the changes).
Editing a visualization gives you an idea of what is used for:
- visualization type (look at tabs near the top under last modified, tags, and description)
- data (look under “Series”)
- filters (look next to and below data)
- chart type and settings (look below the data and filters section)
When finished, head back to the dashboards and check out another insight. Repeating this will start to build familiarity with the types of visualizations PostHog has, and how your data fits into them.
2. See all the types of data
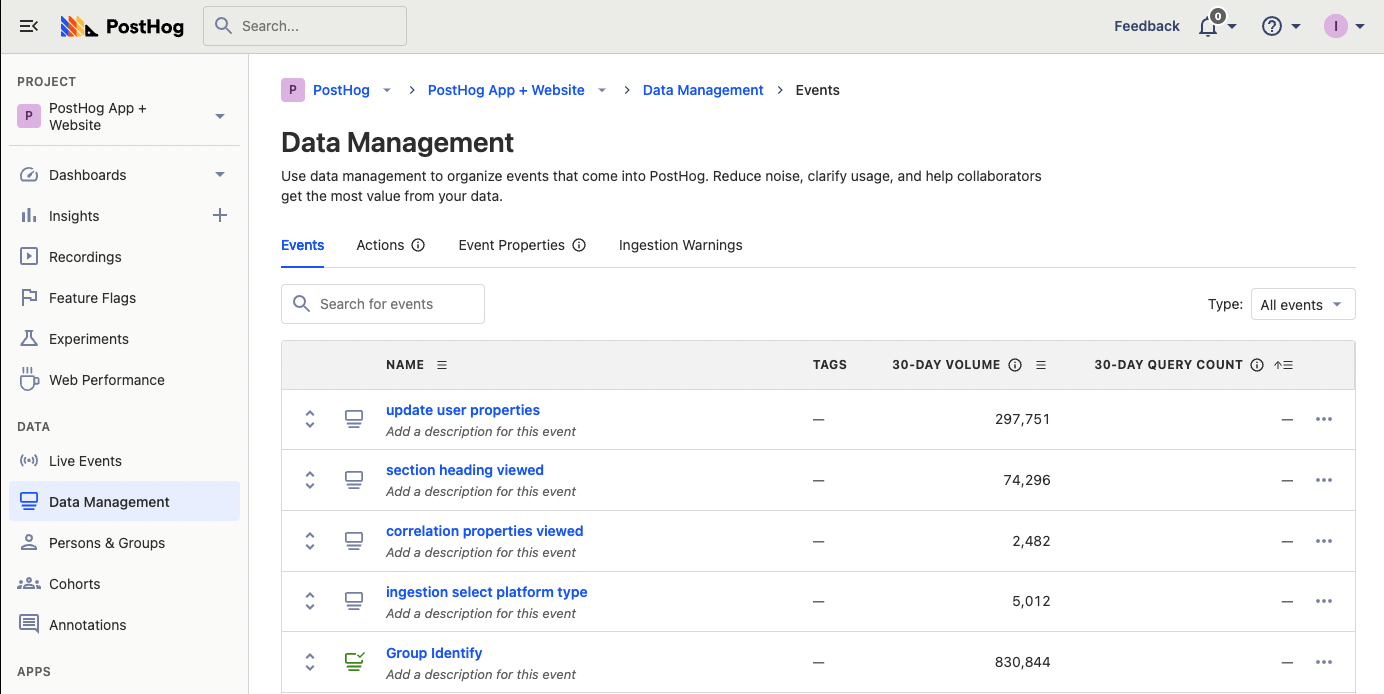
Once you’ve explored dashboards and understood how data is used, it is time to dive deeper into the different types. You can see all of your organization’s data types under the “Data management” tab. In this section, you can see all the captured event types, created actions, and event properties.
You can sort all of these types of data to learn how often your team is using it. For example, by sorting by “30-day volume,” you can see the number of those events your product captures each month. By sorting by “30-day query count,” you can see how often your team uses events or properties to calculate visualizations (insights) in PostHog.
Understanding the events, actions, and properties in PostHog, and what your team is actually using, should give you some ideas of what data is available, and what is important. This is useful when you go to create insights.
3. See your captured events
Another way to understand the data in PostHog is to see the captured events from your usage. This helps you connect data in PostHog with product usage in the real world. You’ll be able to relive your usage of the product through the data inside PostHog
To do this, click the “Activity” tab, then click “Add filter.” Search “Person properties” for an identifier for your company uses like username or email. Enter your email or username and you should see all the events your product has captured from you (if identifying users is set up).
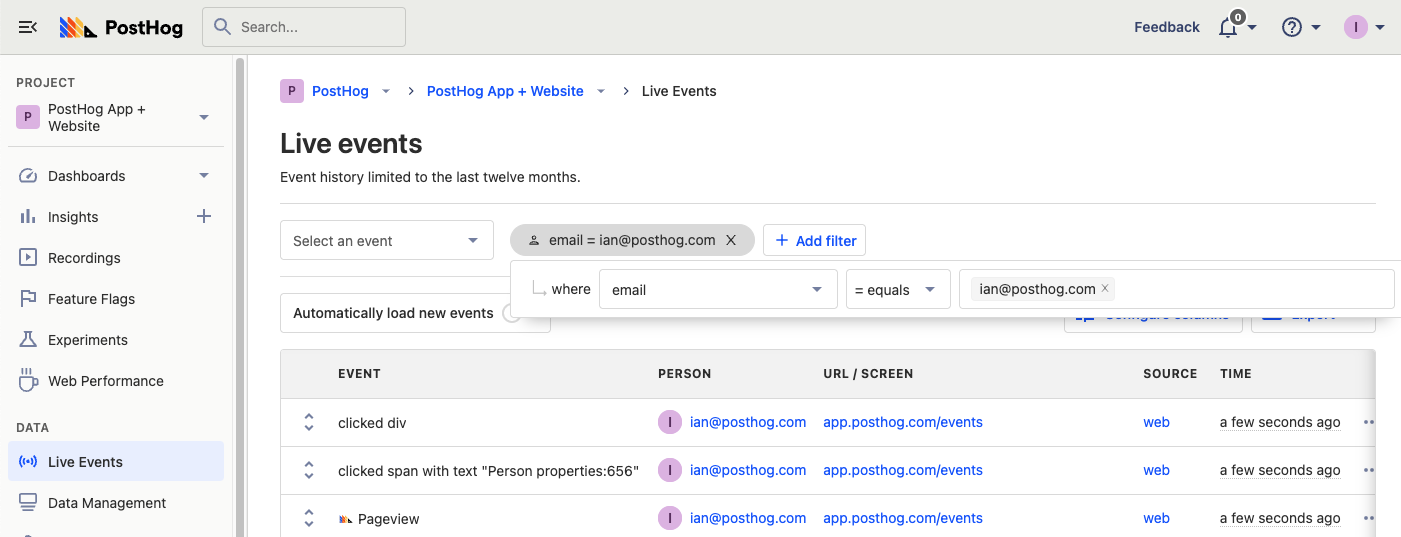
Once you’ve set these filters, go to another tab, and click around your product more. This generates new data that loads into the event list. It gives you a better idea of how usage connects to data in PostHog.
4. Watch session recordings
The final recommendation for building knowledge of your data in PostHog is watching session recordings. Although not available for everyone, if your product has session recordings enabled, they are a powerful tool for learning how usage connects to data in PostHog.
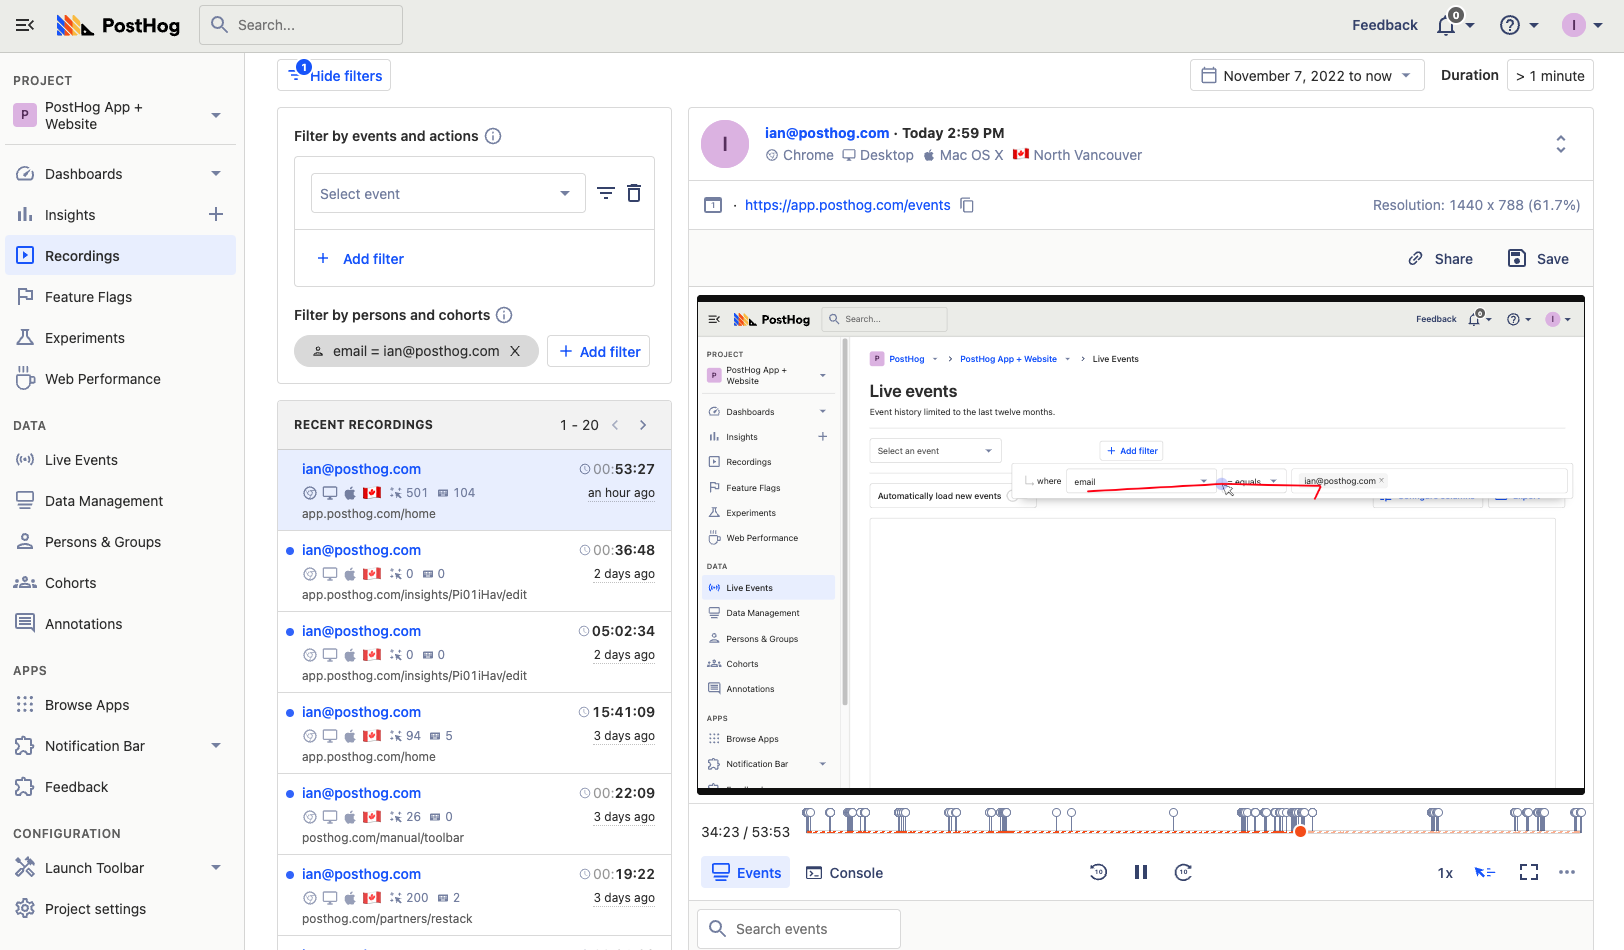
Watching a session recording is similar to watching live events of a specific person with better visuals. You can see the site, mouse movement, page changes, and basic events and person data all on one page
Similar to watching live events to generate, you can watch session recordings you generate. To do this, go to “Recordings,” click “Add filter” under “Filter by persons and cohorts,” search for email or username (or identifier) again, then enter yours. You should get a list of session recordings to help you induce déjà vu.
A “real” useful case is watching session recordings of parts of the site you care about. To do this, use your knowledge of the data in PostHog to filter for events that include the areas you care about. This could be specific events like a button click or specific event properties like a current_url. You can then filter for events within a session recording to find the exact moments you want.
Once you’ve done this, you’ve proved you can use the data, structures, and filters PostHog provides to gain insights about the usage of your product. You’ve accomplished the goals we set out at the beginning, and can expand your usage of PostHog to make full use of our tools.
Further reading
One of the first actions you’ll want to take after building knowledge of data in PostHog is building visualizations (we call them insights). Luckily, we have many tutorials to help you with this. Here are some recommendations:
- Building an AARRR pirate funnel (how and why)
- How to calculate and lower churn rate
- Calculating average session duration, time on site, and other session-based metrics

Subscribe to our newsletter
build mode
Read by 75,000+ founders and builders
We'll share your email with Substack
PostHog is an all-in-one developer platform for building successful products. We provide product analytics, web analytics, session replay, error tracking, feature flags, experiments, surveys, AI Observability, logs, workflows, endpoints, data warehouse, CDP, and an AI product assistant to help debug your code, ship features faster, and keep all your usage and customer data in one stack.