


Retention rate vs churn rate: An intro to churn analysis

Contents
Here's what you need to know about churn rate and retention rate:
Churn rate is the percentage of customers who stop using your product during a given period of time.
Retention rate is the percentage of existing customers who continue using your product.
So, if you have 1,000 customers and 100 of them cancel their subscription, your monthly churn rate would be 10% and your retention rate would be 90%.
In this guide, I'll cover:
- How and when to use each metric
- How to measure churn rate and retention
- Industry benchmarks for churn and retention rates
And... how to reduce customer churn.
Churn rate formula explained 📉
Here's the simplest formula for churn rate:
Customer churn rate = (Churned customers during a specific period / Total customers at the start of that period) x 100
Where:
Churned customers = (Customers at the start of the period - Customers at the end of the period) + New customers acquired in that period
The majority of companies should track churn monthly and/or annually. Those interested in tracking churn daily or weekly are better off using a cohort retention table. More on those later.
🚨 Important: Do not confuse monthly and annual churn rates. Monthly churn compounds into annual churn – i.e. a monthly churn rate of 5% equals a massive 46% annual churn rate. You can't just multiply your monthly churn rate by 12 to get your annual number, either. See how to convert monthly churn to annual in the appendix.
Why should you care about your churn rate?
Reducing churn makes intuitive sense, but it's worth considering the practical impact of high churn and reducing it. You can boil it down to three points:
- High churn is a likely sign you don't have product-market fit.
- High churn leads to increased sales and/or marketing spend to compensate.
- Reducing churn compounds – i.e. revenue and marketing ROI increase.
All are compelling reasons to reduce churn, but you need some context before you do.
Is your current churn rate actually bad, or does it just feel bad? Let's dig into that next.
What is a good churn rate?
For research, I read several dozen data analyses and finger-in-the-air takes on what "good churn" looks like. Suffice it to say there are contrasting views on the topic.
I've collated the better sources in the appendix. What follows is my own, not-quite-scientific meta-analysis:
B2C SaaS: Subscription services like Netflix or Tidal typically have higher churn than those targeting businesses, so a 3 to 5% monthly churn rate is pretty good. Anything less than 3% is very good, though B2C services are more price sensitive – churn trends much lower among services that charge less than $10 per month, for example. A monthly churn rate of 5% is equivalent to annual churn of 46% – i.e. a company with 1,000 customers would lose 460 over 12 months.
Mid-Market B2B SaaS: Anything up to 5% monthly churn is OK for a B2B SaaS that doesn't sell to big enterprises, but something around 3% is preferable if your average revenue per customer (ARPC) is above $250 per month. Anything below 2% is excellent. A monthly churn rate of 3% is equivalent to 30.6% annually – i.e. a company with 1,000 customers would lose 306 over 12 months.
Early-stage B2B SaaS: A monthly churn rate above 5% is to be expected for any early-stage company B2B SaaS, so don't worry too much if you're growing fast, and you're above that benchmark. Just monitor your trend and dig deeper if you don't see it decline as you mature. A monthly churn of 5.65% is equivalent to 50.24% annually – i.e. a company with 1,000 companies would lose 502 over 12 months, more than half.
Enterprise B2B SaaS: Products selling to large enterprises (think more than 1,000 employees) have lower churn, mainly because large companies change slowly and are billed annually. A monthly churn rate up to 2% is good. Anything less than 1% is excellent. A monthly churn rate of 1% is equivalent to 11.3% annually – i.e. a company with 1,000 customers will lose 114 over 12 months.
Good retention rates are the same, but inverted – 5% churn equals 95% retention, and so on.
Retention rate formula explained 📈
So that's churn rate, but what about retention rate? The basic formula is very similar:
Retention rate = (Customers at the end of a period - Total new customers during that period) / Customers at the start of the period x 100
So, if you have 100 customers at the start of a year, gain 35 new customers during the year, and end the year with a total of 80 customers then your retention rate would be:
((80-35)/100)*100 = 45% retention
Needless to say, ending the year with fewer customers than you started isn't great news, but this is just an example, so there's no need to panic yet.
Now, the cool thing about retention rate is it's easy to visualize in a cohort retention table like this:
Retention tables allow you to answer questions like:
- Which features do users come back to over and over?
- Which features do users try and never use again?
- What actions contribute to users retaining or churning?
- What properties do retaining users have that or churning users lack?
If you can answer these questions, you're on the way the improving retention and reducing churn.
How to read cohort retention tables
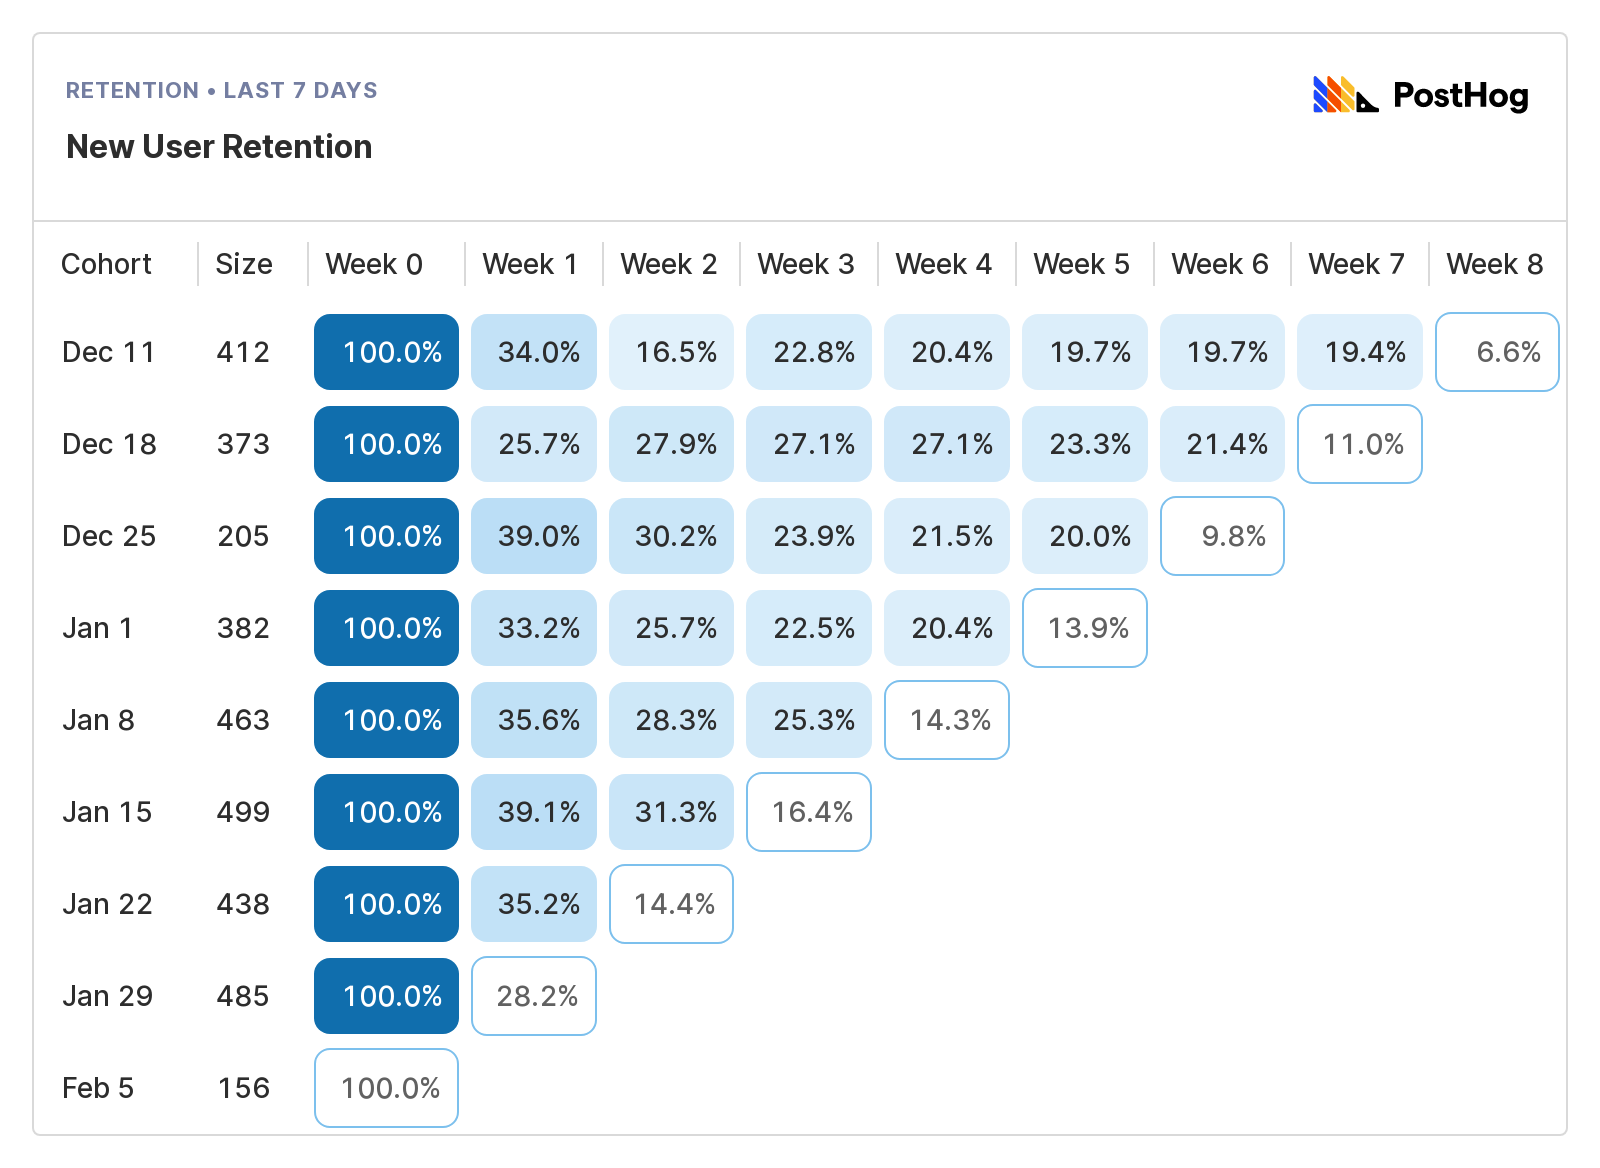
Below is a PostHog retention table for an imaginary Dropbox clone called Hedgebox. In this retention table we're looking at weekly repeat usage, configured as:
Unique userswhosigned up for the first timein the last 8 weeks who then came back and triggered theinteracted with fileevent in PostHog.
To read it, just start on the left and work your way across:
Cohort Denotes the week these users signed up – i.e. the cohort these users belong to.
Size: Shows the size of that cohort – a useful reference to avoid comparing a very small cohort to a much larger one.
Week 0: Gives you the percentage of users in the cohort who used Hedgebox in that week. As it's week 0, this number will always be 100%.
Week 1-8: Shows the percentage of users from that cohort who returned each subsequent week, relative to week 0. Blue boxes denote completed periods; white boxes periods still in progress.
In this example, we can see retention settles at ~20% from week 4 onwards in most cohorts.
That's a useful baseline, but what happens if we filter by just people who use Windows?
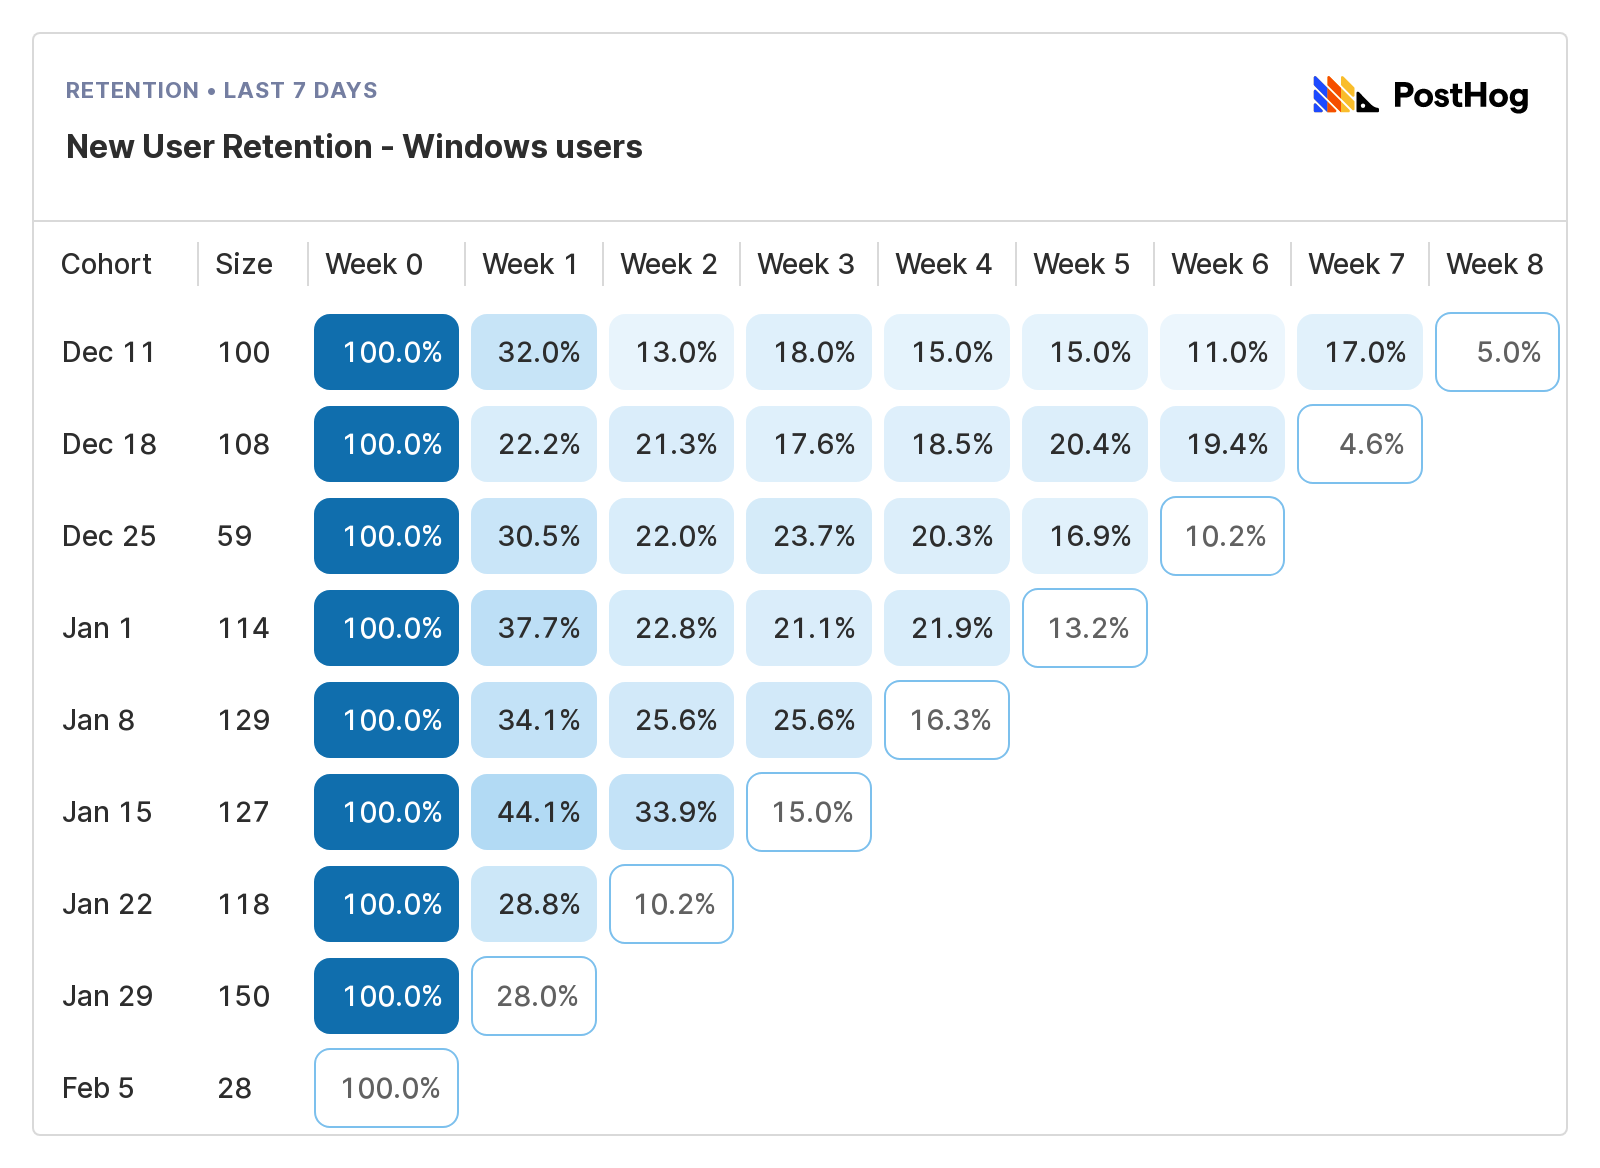
It's obvious Windows users retain worse than the baseline, dipping as low as 15% in week 4 onwards in the 'Dec 11' cohort.
Do macOS users retain better than Windows users? Let's check...
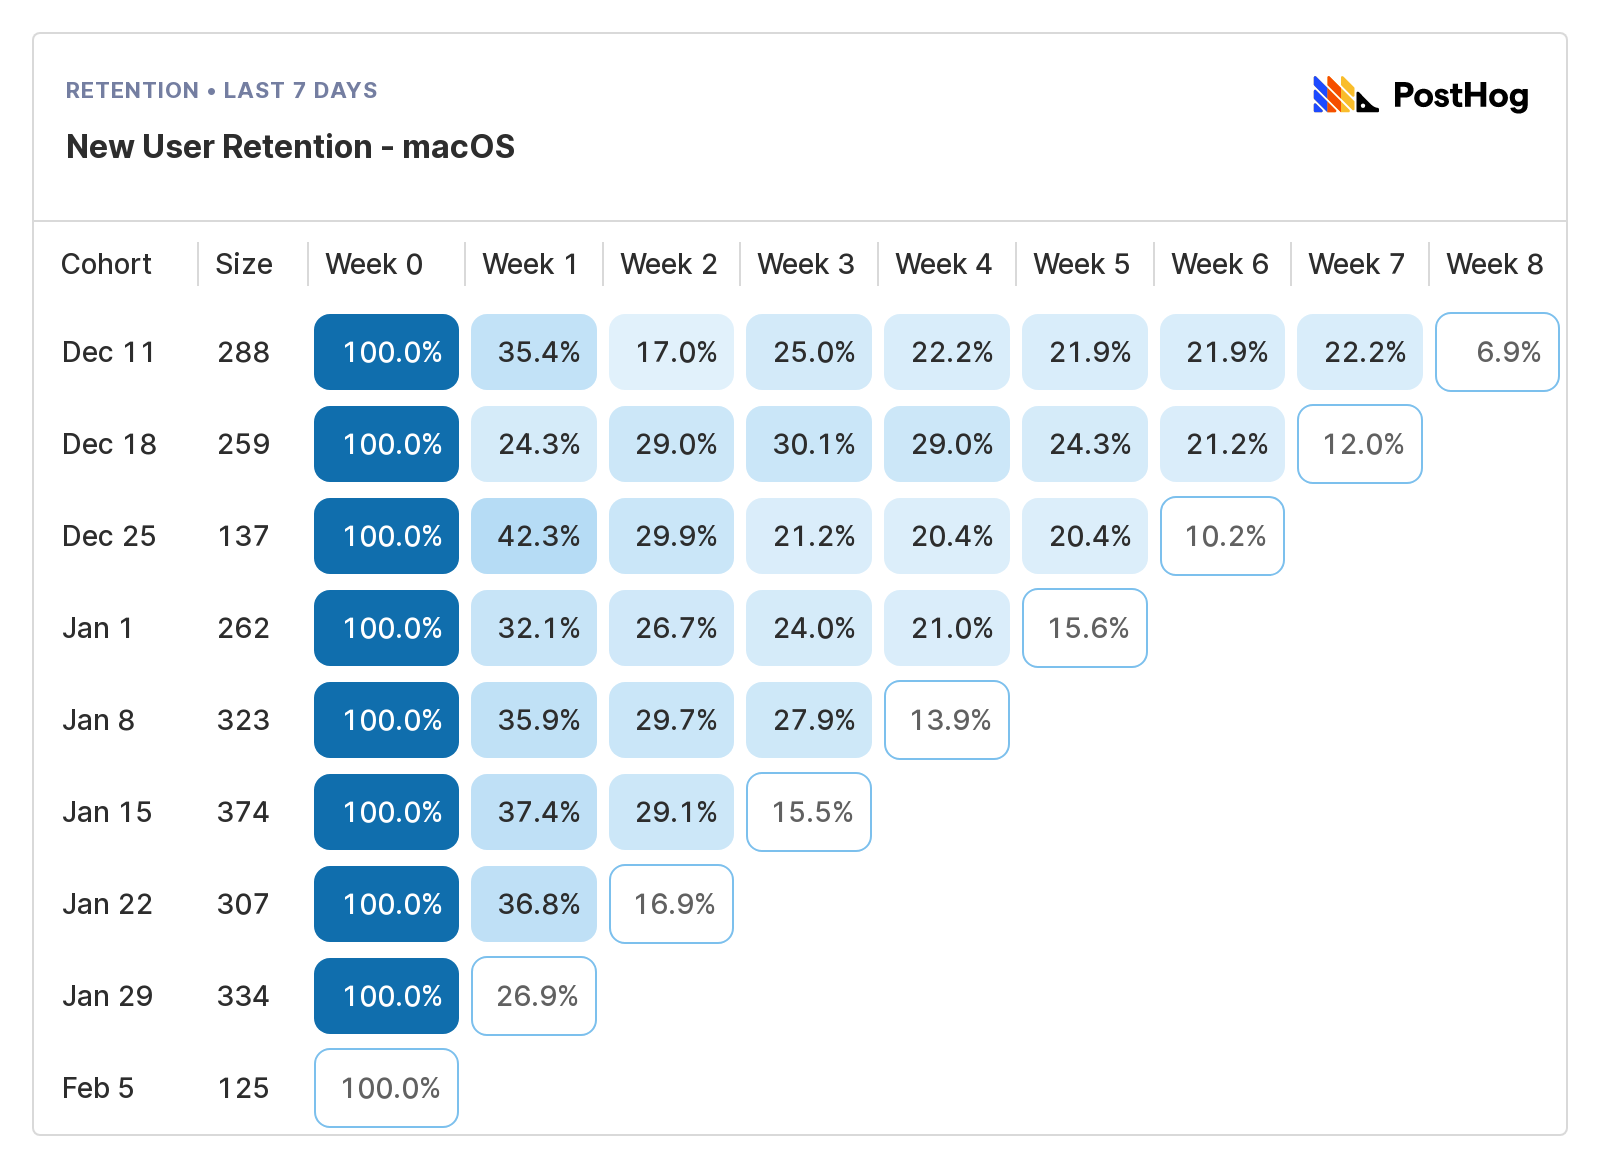
They do! While the exact values vary, macOS users consistently retain better than Windows users.
This prompts several avenues of investigation, such as:
- Is the Windows Hedgebox experience worse and, if so why?
- Are Windows users demographically different to macOS users?
- Does Hedgebox solve some fundamental problem for macOS users that makes them retain better?
This is just one example using demo data in PostHog. You could also filter users by:
- Their age
- The browser they use
- The country or city they live in
- The number of files they upload
- The types of files they upload
- User job titles, company type, or myriad other properties
Cohort retention tables are also useful for tracking revenue retention, especially if you charge based on usage.
Positive revenue retention (i.e. more than 100%) indicates users increase their spend over time. Needless to say, this is a good thing.
9 ways improve retention and reduce churn 🚀
So, how do you improve retention and reduce churn? Talking to users is a vital component – we're constantly talking to users – but here are some other tactics to consider.
🚨 **Important: Each lever you pull to reduce churn compounds, so pull more than one if you can. It doesn't matter which one works the best, just that one or more them do.
1. Check for involuntary churn
Involuntary churn typically means billing problems – e.g. expired cards, out-of-date info etc. In e-commerce, abandoned baskets are a form involuntary churn.
2. Target different users
Sometimes poor retention comes from acquiring the wrong users. This could be a marketing problem, or you might have the wrong ideal customer profile for your product.
3. Learn about your power users
It's great to have power users, but they're also more sensitive to product changes. It's important to identify who they are, what they do, and what they value. They're your biggest advocates, so keep them happy. See: How to identify and analyze power users in PostHog.
4. Ship useful new features
If you're talking to your users, and learning about your power users, then you should be well-placed to build awesome new features your existing (and potential) customers will love. If you solve more problems for your customers, they're more likely to retain.
5. Improve speed/reliability/ease of use
Users may love your product, but find it slow, buggy or hard to use. Again, talking to users will make it obvious if you have a problem here.
6. Move customers to annual contracts
Remember how companies selling to enterprises have lower churn? It's not an accident. Consider offering discounts or incentives to existing customers to move onto annual contracts. Once they do, they're less likely to churn.
7. Improve your onboarding process
Users who don't get full value out of your product are more likely the churn, and the best time to educate them is at the start. The better your new users understand your product (and its value), the better they'll retain.
8. Focus on customer success
Customer success > outbound sales a lot of the time. Our customer-success owns all inbound contact requests, assisting new users and introducing them to the right PostHog people at the right time. If you can't afford a dedicated team, give the job to someone until you do. PostHog CEO, James Hawkins, owned this area in our early days.
9. Re-engage your users
Users who like your product can sometimes be distracted by other things. Well-timed outreach messages, such as showcasing an underused featured, can be extremely powerful. Path analysis is a useful tool for understanding where users get distracted.
The things you need to improve retention
You're gonna need a few things to track, analyze and reduce customer churn, such as:
The ability to identify your new/current users (e.g. job role, location etc.)
An analytics tool to help you track user churn, and analyze use behavior.
Session recording, so you can watch real interactions with your product.
A way to test new features and improvements to validate if they work.
The ability to safely roll out new features to test groups and specific cohorts
Product-minded engineers or product managers who talk to users and ship fast
Some companies deploy a complicated data stack to get all this, but it's not necessary. We built PostHog (yes, this is a teeny bit of sales pitch, now) so you can get all those things in one, tightly integrated tool.
And, while we can't help you with #6, we do have strong opinions on why product engineers are awesome for startups, and how product engineers and product managers can work together.
Check out our product page if this sounds interesting to you.
/pitch over
Takeaways 👍
Phew, ok, that was lot. Hopefully you know a little more about how churn and retention rate work, interact, and impact your product now.
To conclude, here are five takeaways:
Higher churn in an early-stage startup is fine, so long as you're growing fast and finding impactful ways to improve your product. Declining churn is a good sign you either have, or are approaching, product-market fit.
Don't benchmark your churn rate against the wrong industry, or product type. Average revenue per customer (ARPC) is a huge factor here. A B2B SaaS with an ARPC of $200 per month should have very different expectations than an enterprise SaaS with an ARPC of $10,000 per month.
Use cohort retention tables to understand what types of users, or features, positively or negatively impact churn. This will help guide product development and marketing.
Deploy multiple tactics to reduce churn at the same time. It's faster and the combined impact will (hopefully) be greater.
PostHog is awesome and you should totally adopt it at your startup. "Nobody got fired for buying PostHog" said someone, probably me.
Further reading 📖
If you're interested in early-stage startups and product-led growth, you may find these articles useful:
PostHog CEO, James Hawkins, on how we found our Ideal Customer Profile
My guide to building an AARRR pirate funnel for tracking your most important metrics
Another piece from James on how we made something people want
You can also sign up to our newsletter. We send it every two weeks. It's full of articles like this.
Appendix
Converting monthly churn into annual churn
Use this formula to convert monthly churn into annual churn:
- Annual churn = 1-(1-[your monthly churn])^12
Using this formula, a monthly churn rate of 1% equals an annual churn of 11.6%. So, if you started the year with 1,000 customers and had 1% churn per month, you'd have 114 churned customers you need to replace through acquisition.
Use this formula to do the opposite:
- Monthly churn = 1-(1-[your annual churn])^(1/12)
Using this formula, an annual churn rate of 11.6% equals an average monthly churn of 1%.
More on churn rate benchmarks
There's a lot of conflicting information and advice about what "good" churn looks like.
Studies tend to focus on specific verticals (e.g. enterprise SaaS), which aren't relevant to mid-market companies, or advice is based on anecdotal experience rather than data.
These are the best sources on the topic and the basis for my guidelines:
This 2020 meta-analysis of six different studies neatly explains how methodology and data sources can distort results.
Subscription analytics company, Baremetrics, maintains an open benchmarks page based on data from its customers – mostly mid-size SaaS products like todoist, Product Hunt and npm.
Recurly's 19-month study of 1,900 subscription products that use its platform. It breaks down churn for B2B and B2C products across multiple cohorts, including average revenue per customer (ARPC).
Lenny Rachitksy's Q&A on monthly churn, in which he polls several experts, including the CEO of subscriptions platform ProfitWell.

Subscribe to our newsletter
Product for Engineers
Read by 100,000+ founders and builders
We'll share your email with Substack
PostHog is the leading platform for building self-driving products. With a full suite of developer tools – AI observability, product analytics, session replay, feature flags, experiments, error tracking, logs, and more – PostHog captures all the context agents need to diagnose problems, uncover opportunities, and ship fixes. A data warehouse and CDP tie it all together, unifying that context into one source agents can read across. You can steer it all from Slack, the web app, the desktop (PostHog Code), or your own editor via the MCP.