


How to set up Stripe reports

Contents
Creating and analyzing reports for your Stripe data helps you understand how you are making money and how you can improve.
This tutorial shows you how to sync your Stripe data to PostHog and then create a report of insights like customer count, gross revenue, recurring revenue, revenue churn, and more.
Linking Stripe data to PostHog
To start, you need both a Stripe and PostHog account. Once you have those, head to PostHog's Data pipeline page and:
- Under the sources tab, click New source
- Choose the Stripe option by clicking Link
- Enter your account ID and a restricted API key that can read the resources you want to query
- Press Next, keep all tables selected and click Import
For Stripe tables, incremental syncs will only sync new records and not update existing records. This is a limitation of the Stripe API in which it's not possible to query for updated data.
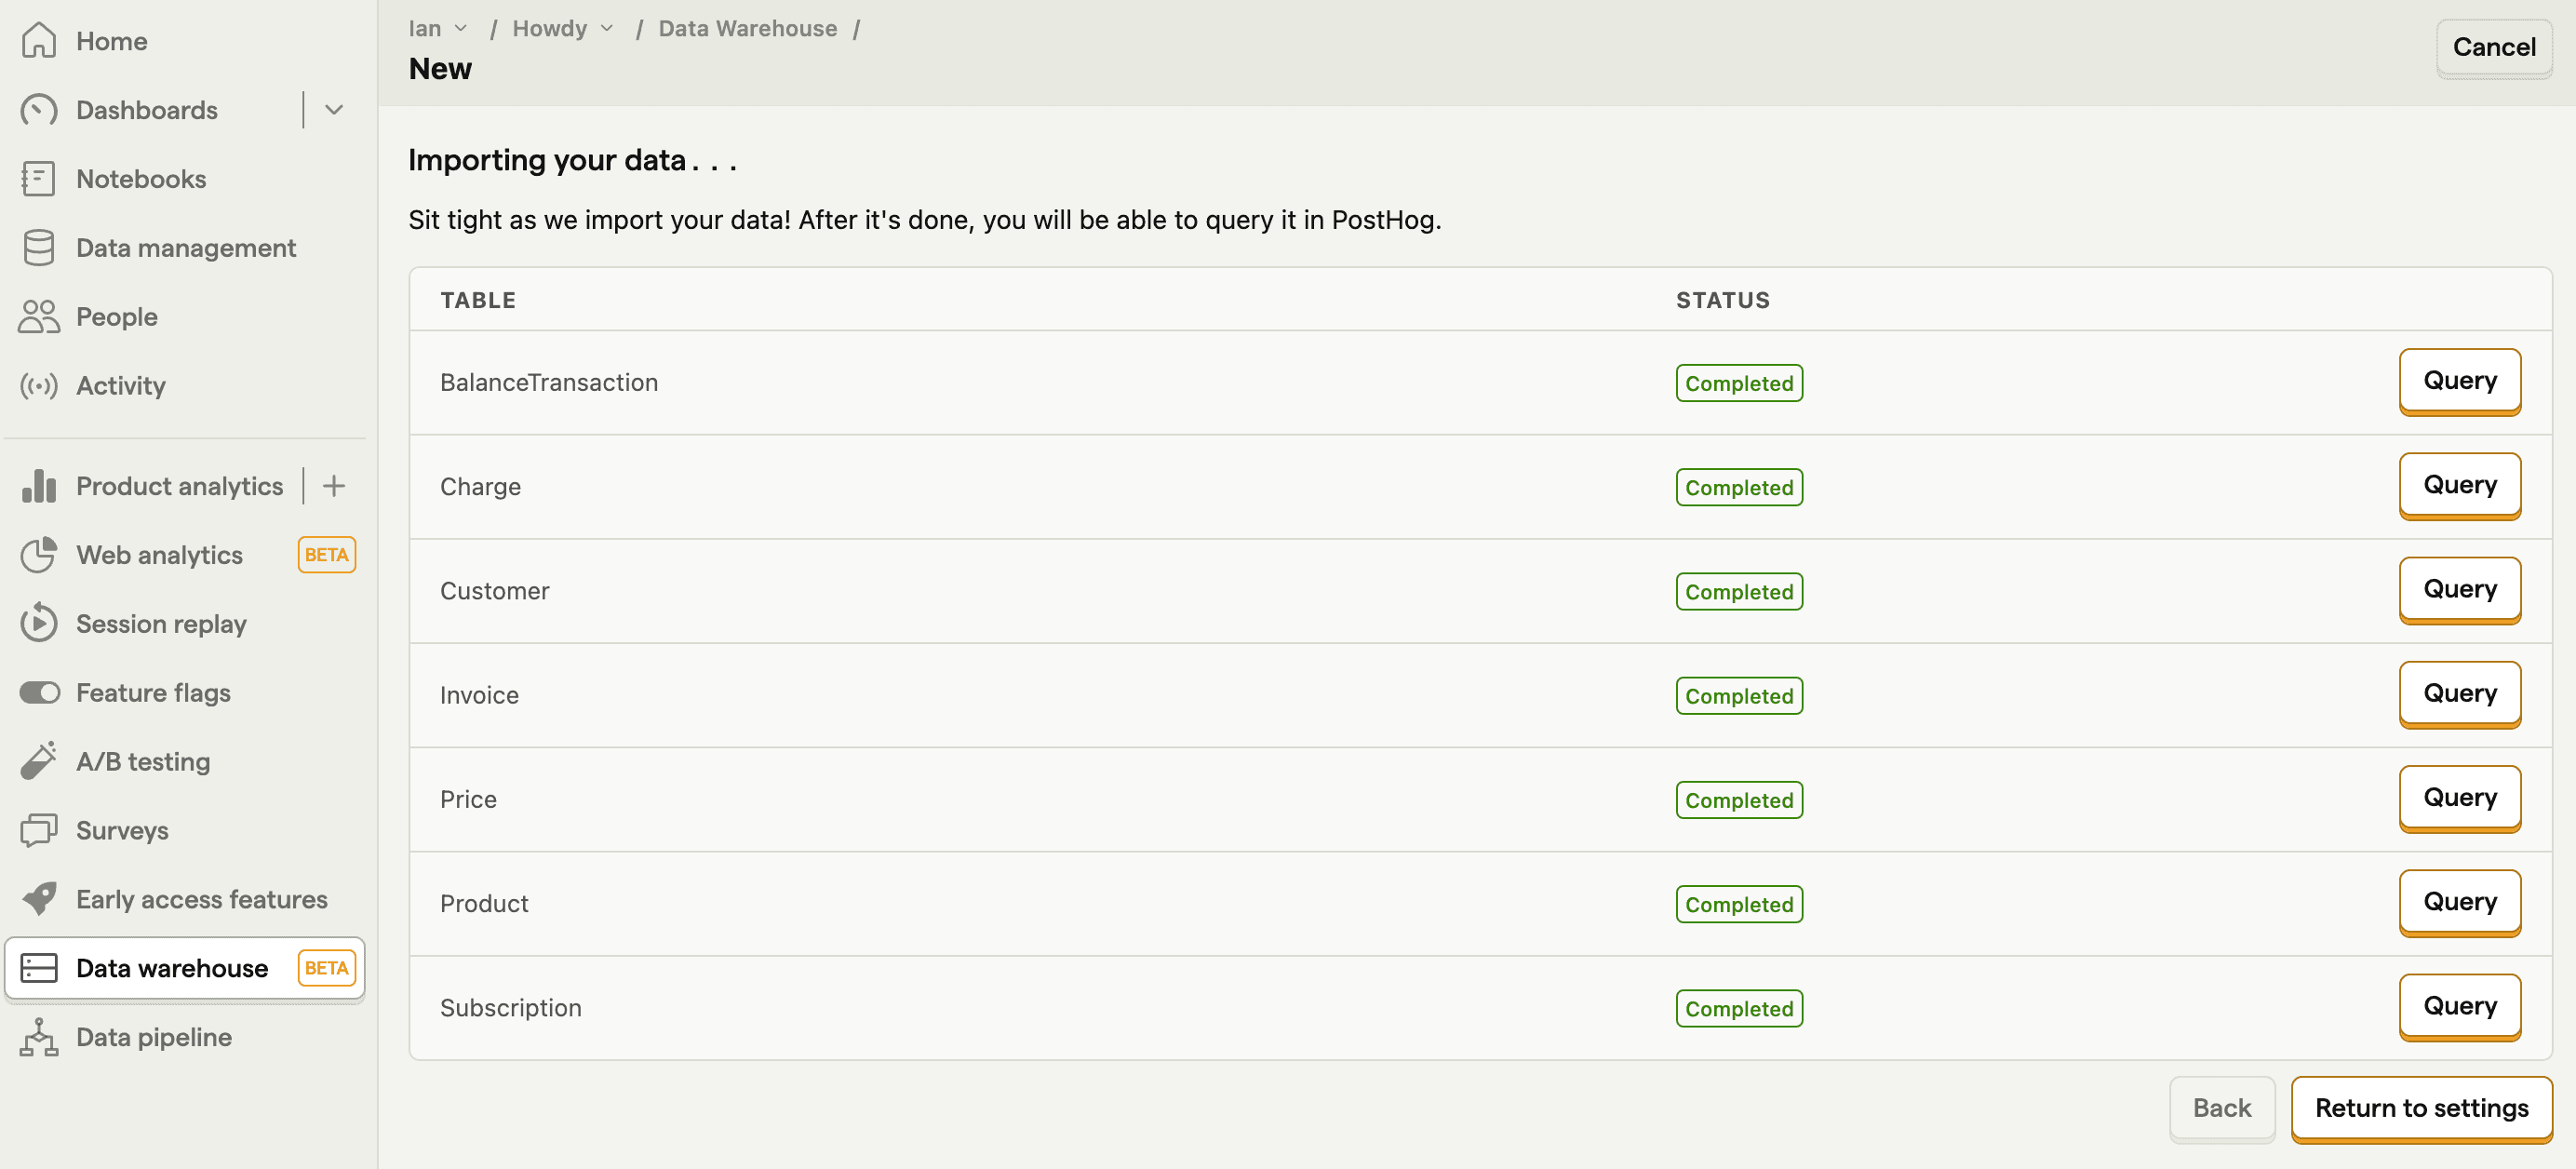
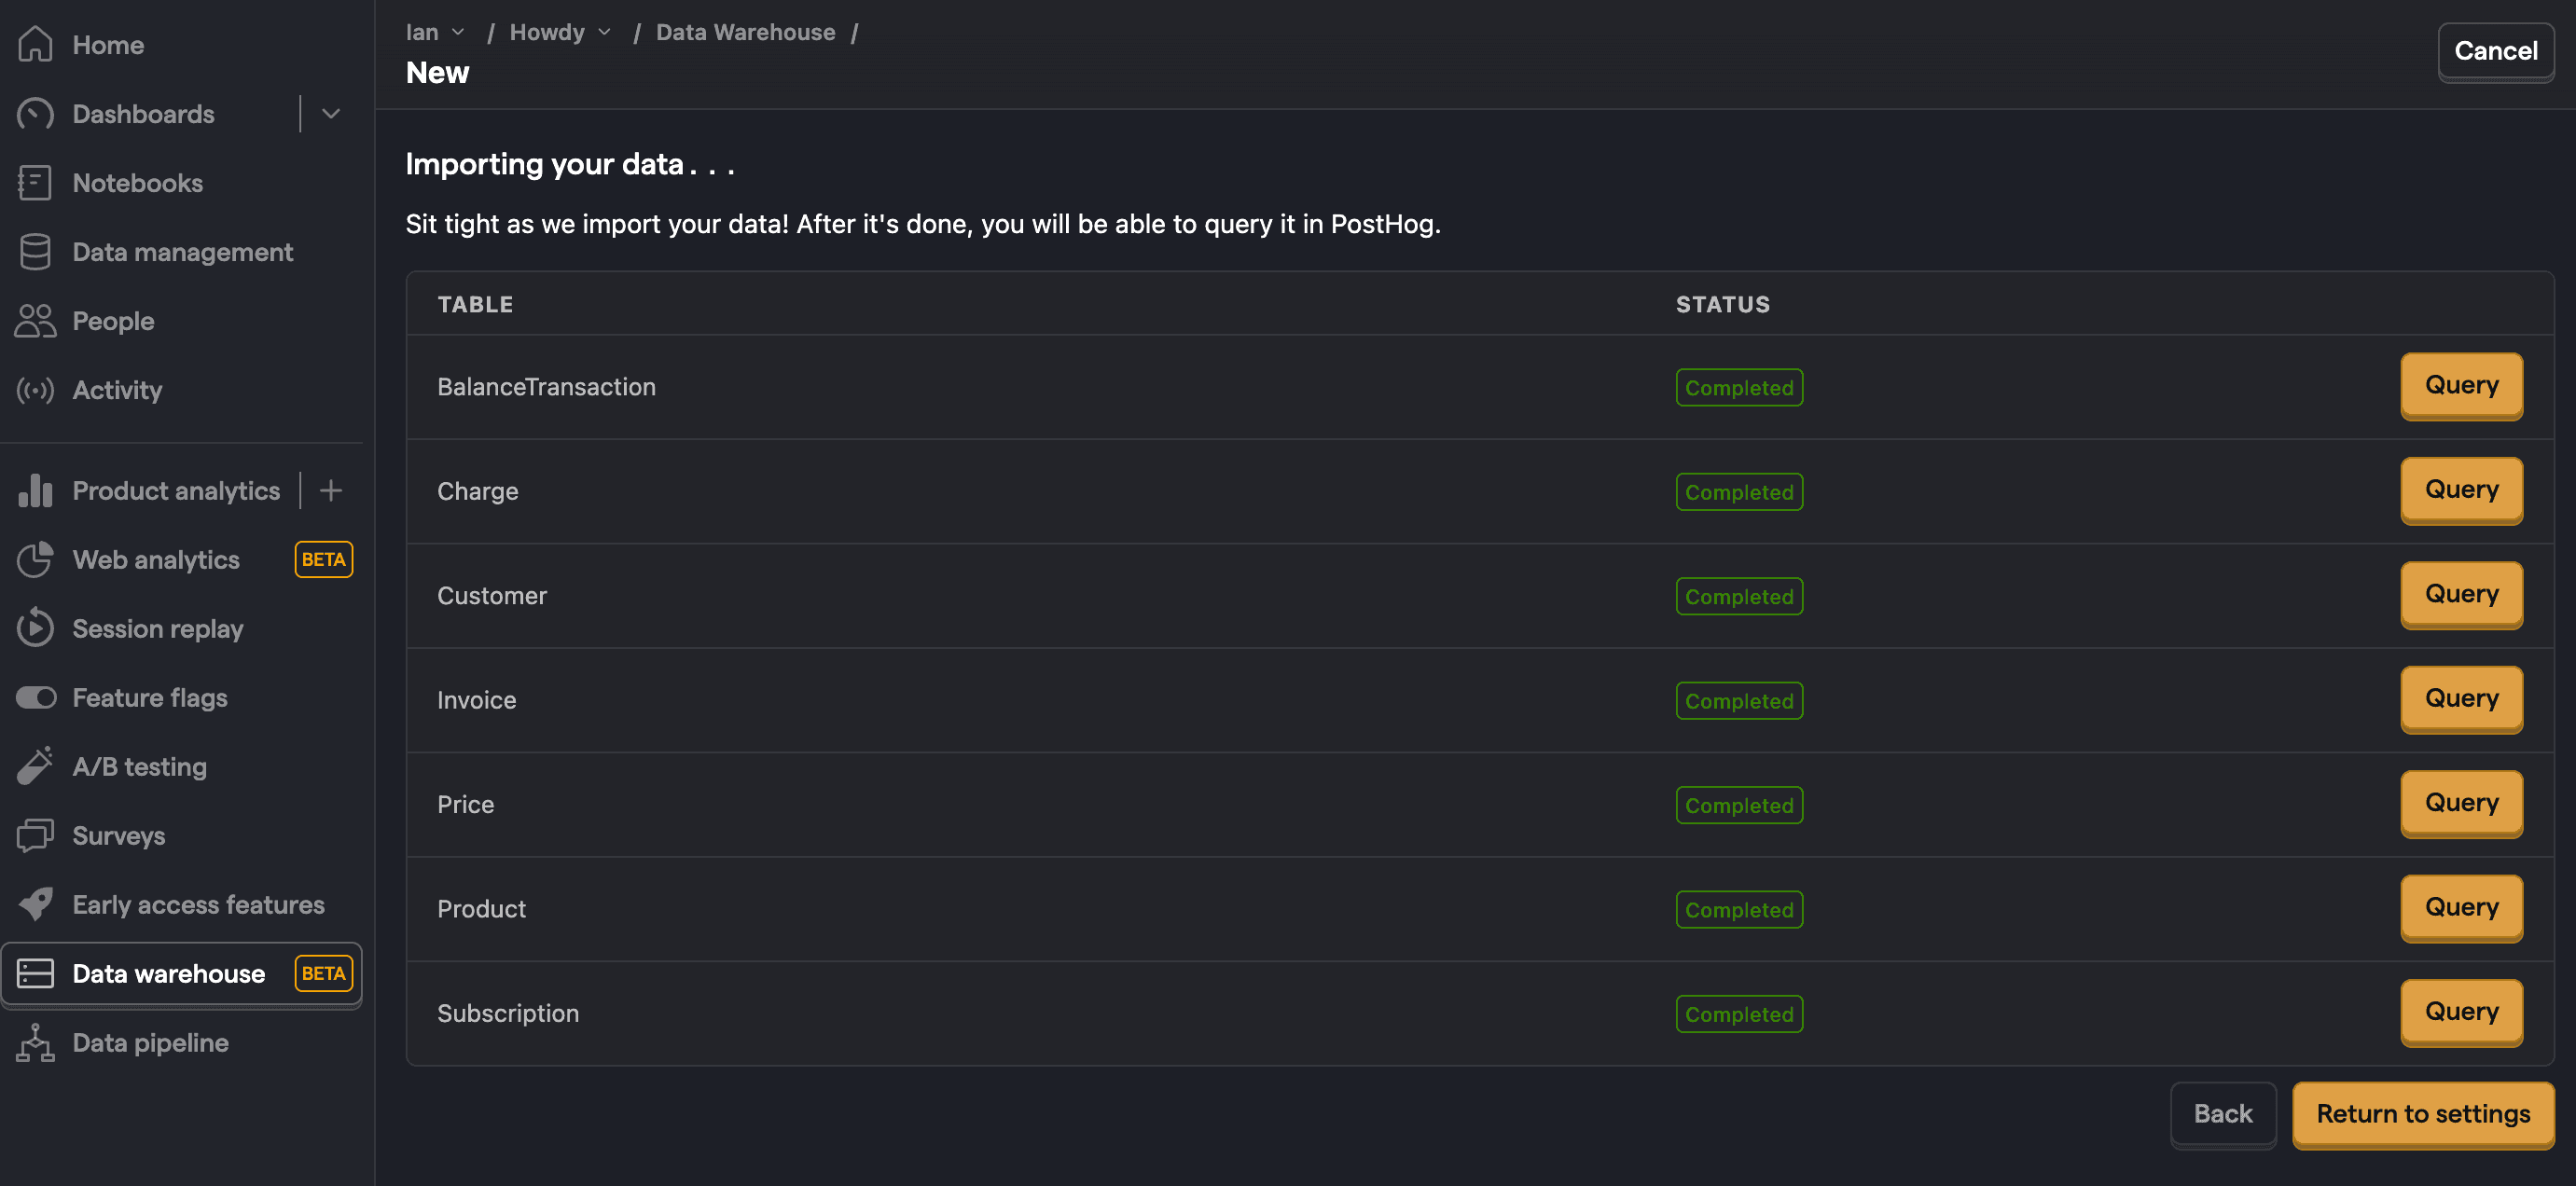
Once done, PostHog will automatically pull and format your Stripe data for querying. You can adjust the sync frequency, see the last successful run, and more in data pipeline sources tab.
Note: If you are missing a table, check your data pipeline sources tab to make sure it synced correctly.
Creating insights for your Stripe report
Now that your Stripe data is synced into PostHog, you can use it to create insights for your report. Each of these requires you to create a new insight in the product analytics tab.
Want to get started fast? Check out our Stripe starter report template, or ask PostHog AI to help you create the reports you need and write SQL for you.
Customer count
To start, we create a trend of customer count over time.
On the trends tab, change the aggregation to Unique users, and then click the data series, go to the Data Warehouse tab, hover over the stripe_customer table, and click Select. You might want to change the Distinct ID field from id to email as Stripe can give multiple id values to the same user email.
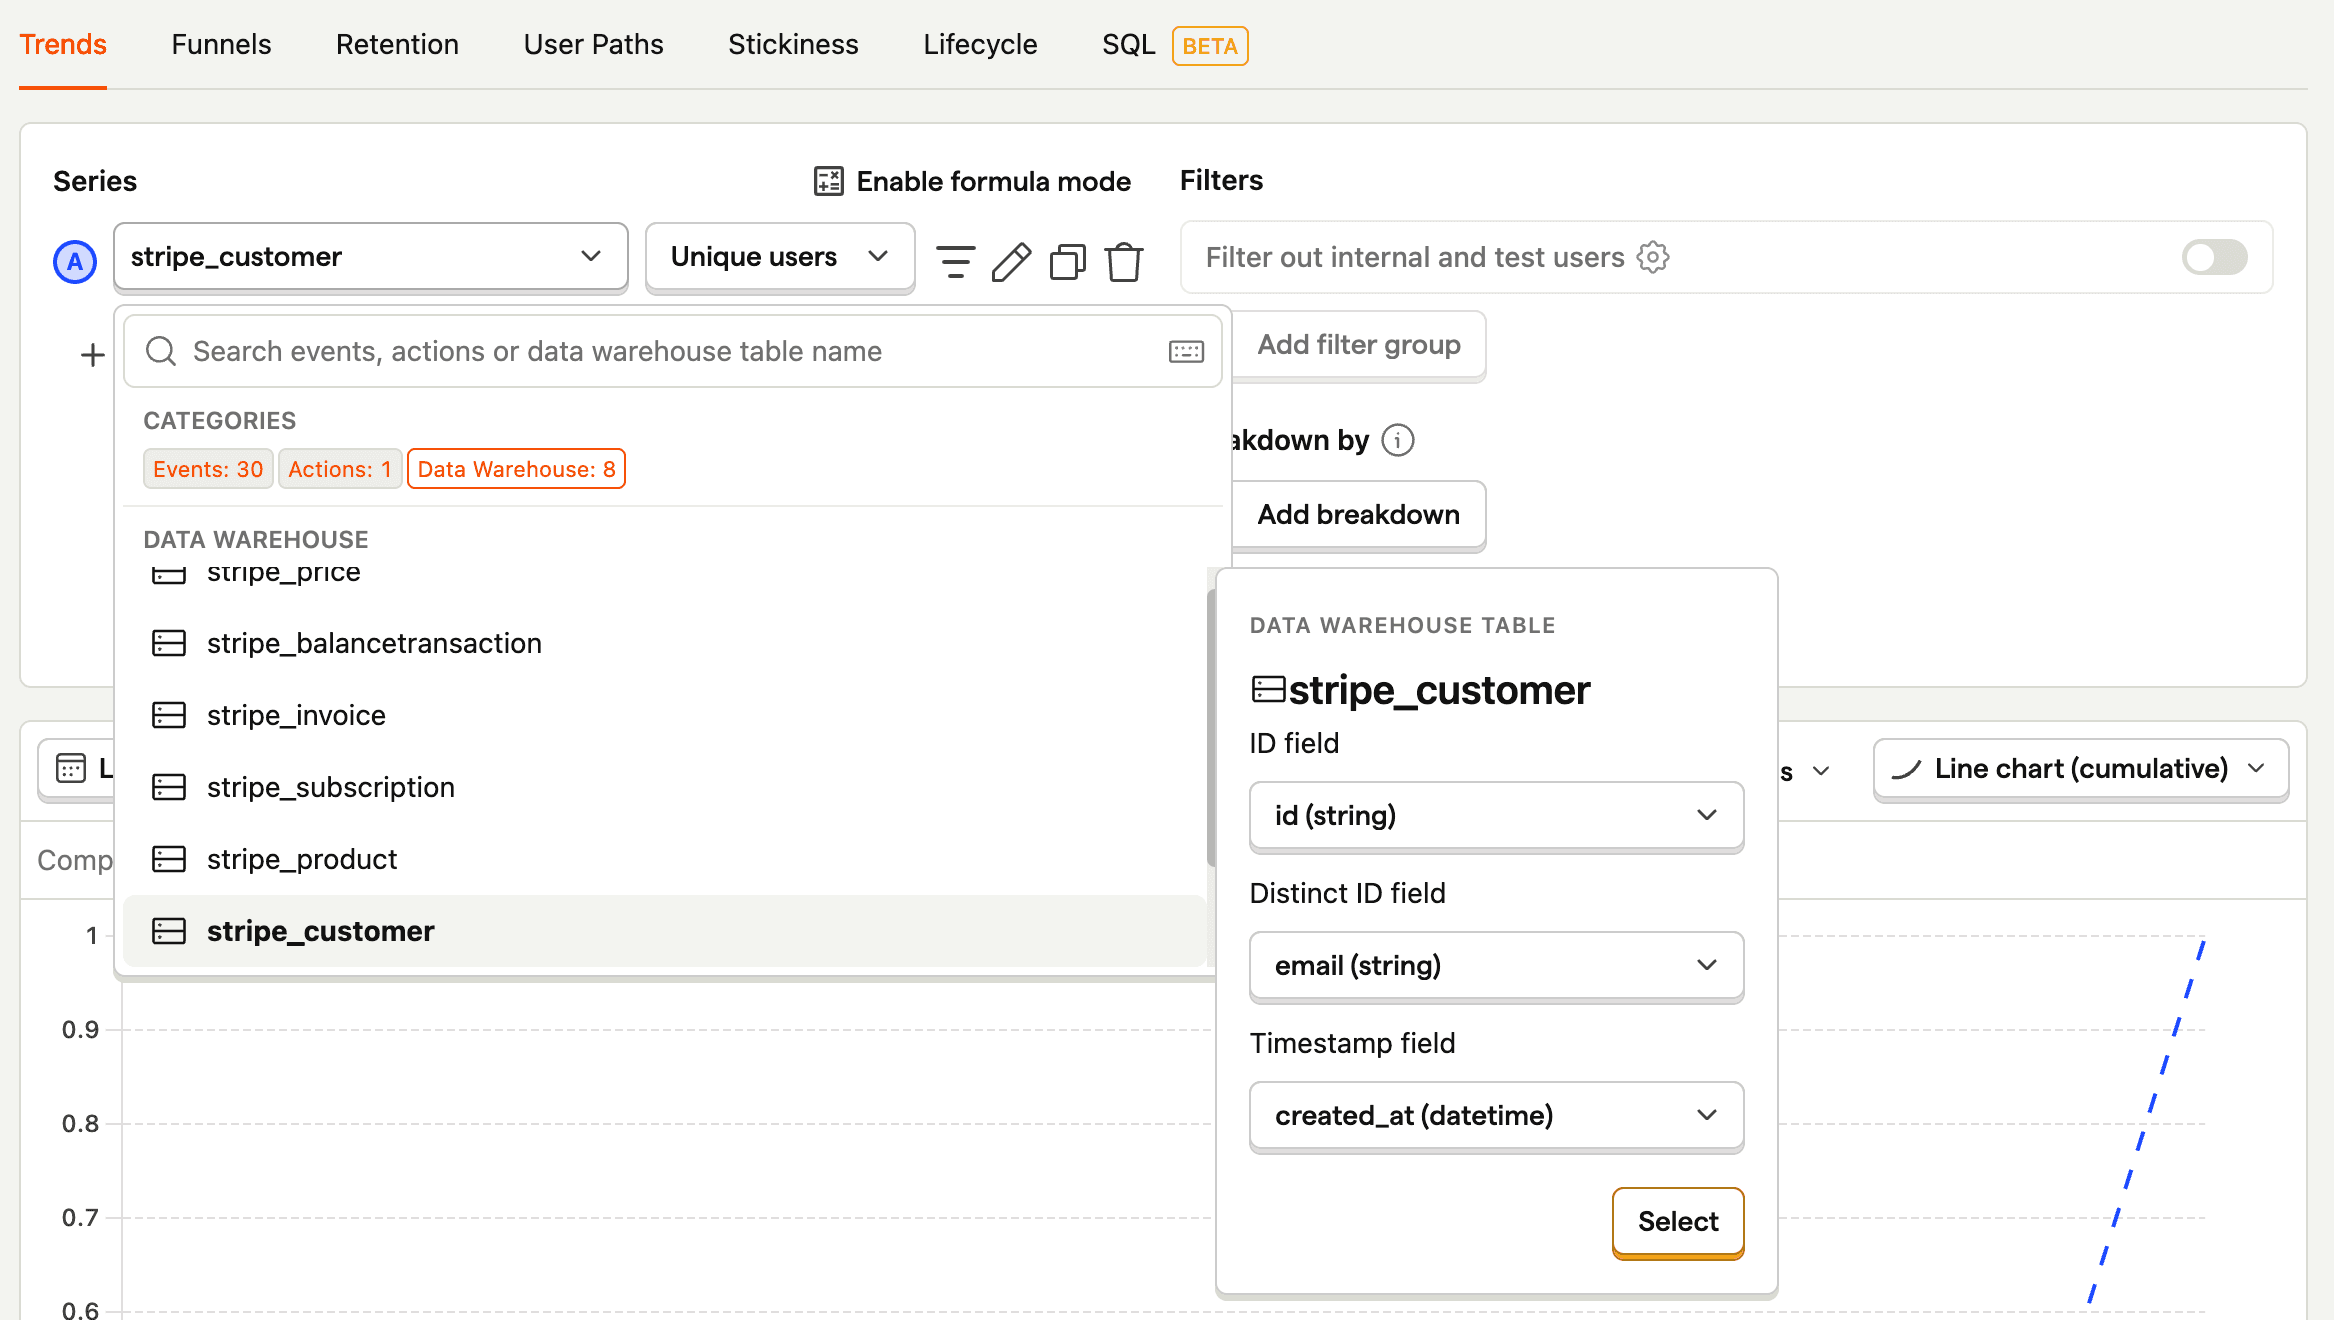
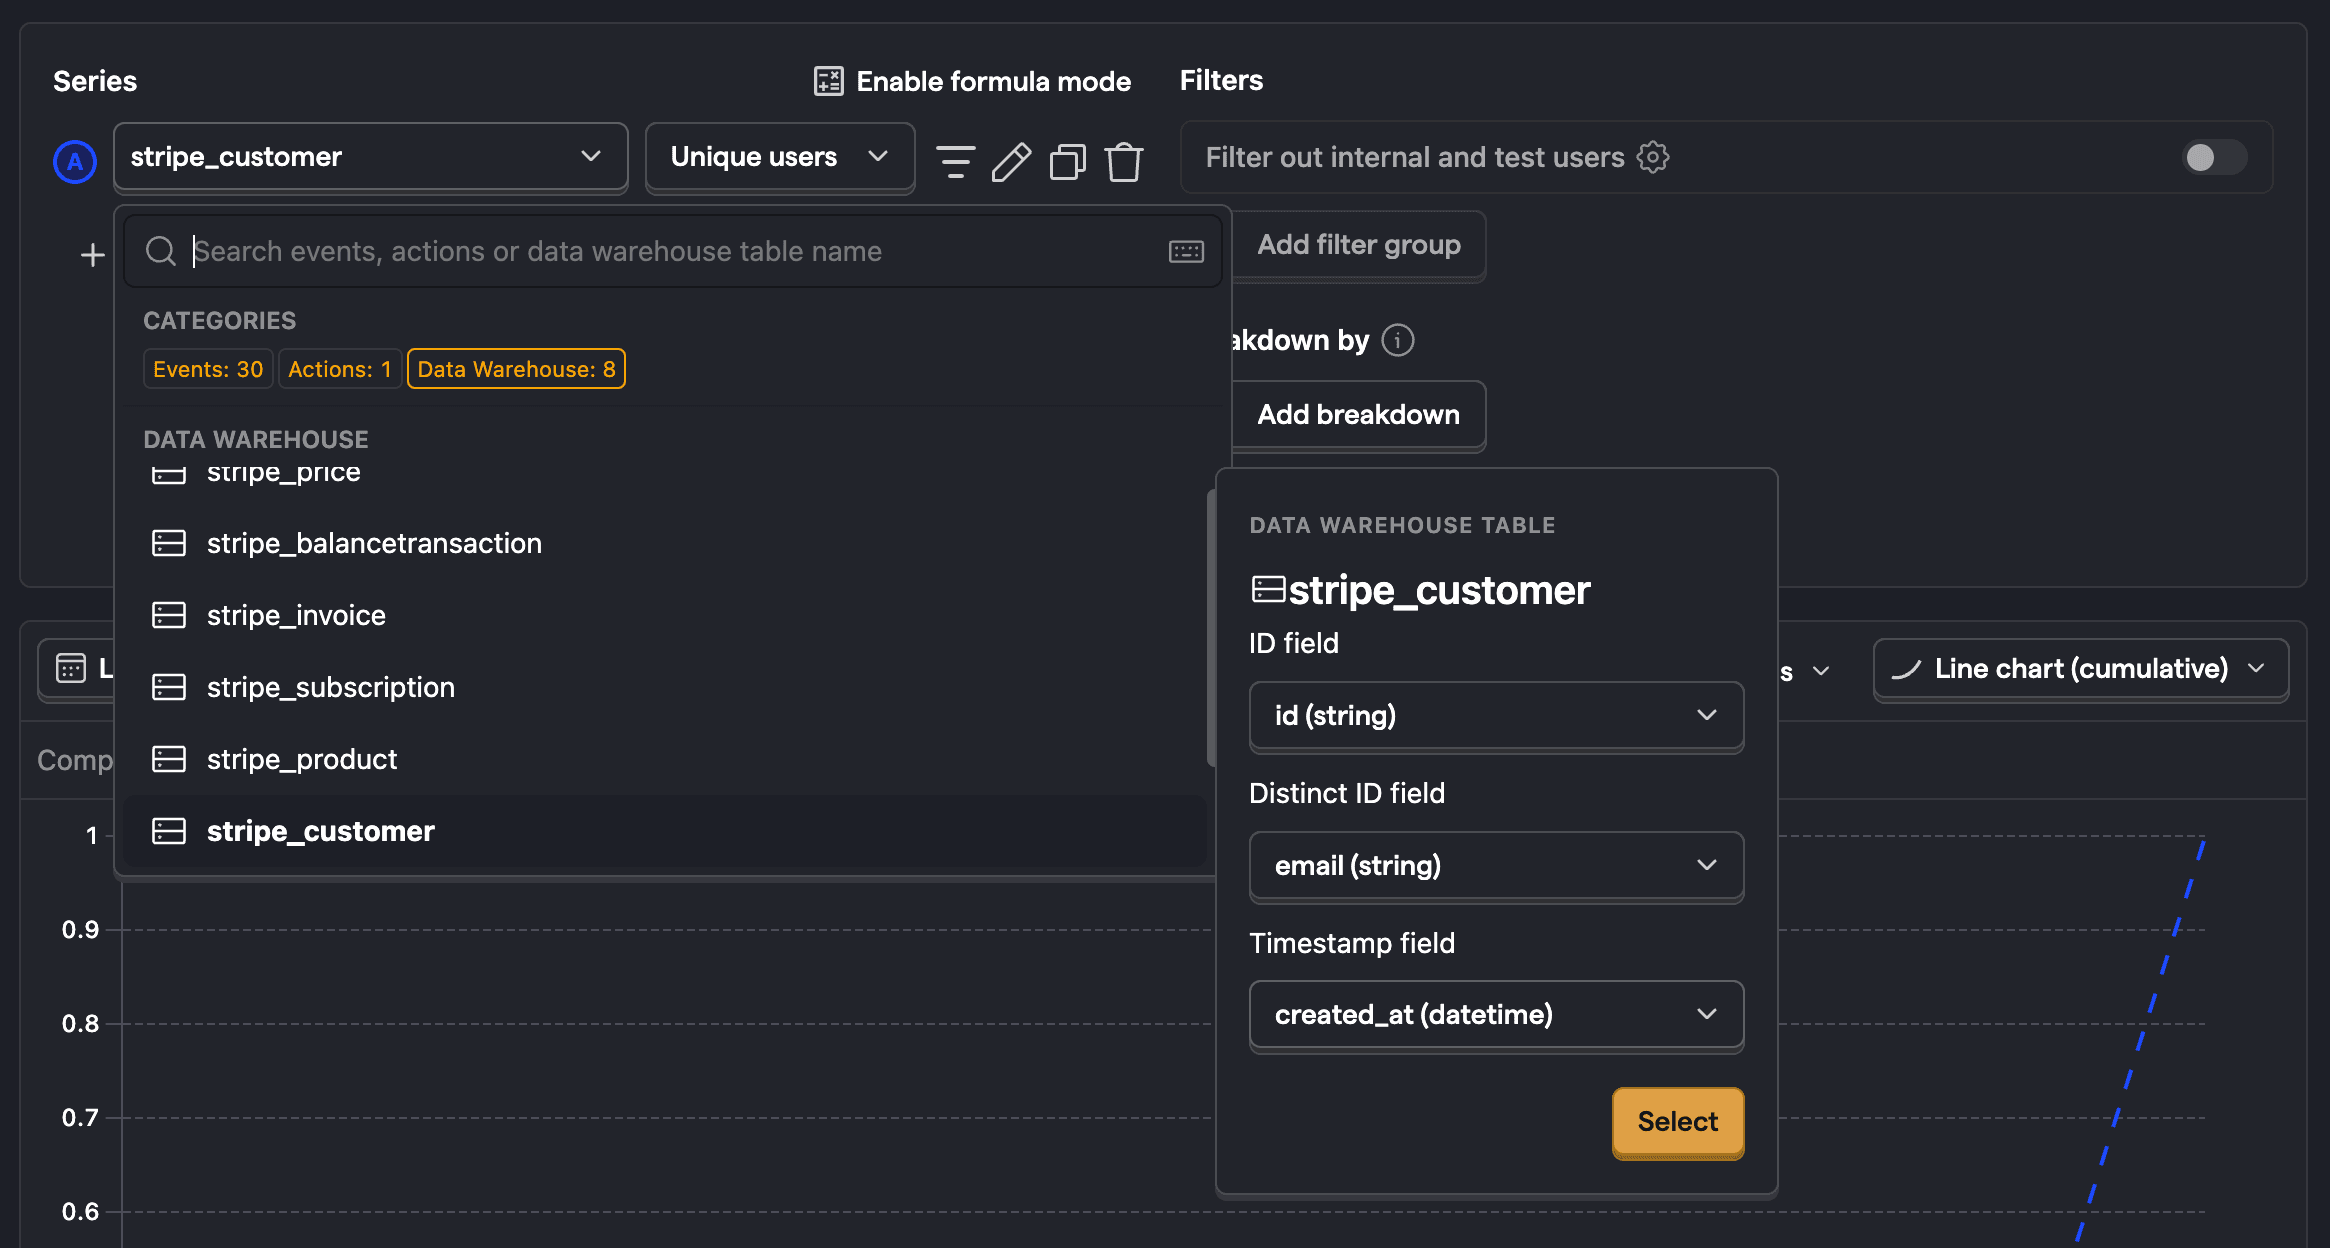
This can also be done for any of the other Stripe data like charges, subscriptions, and invoices. You can also add filters based on property values like created_at, email, status, and more.
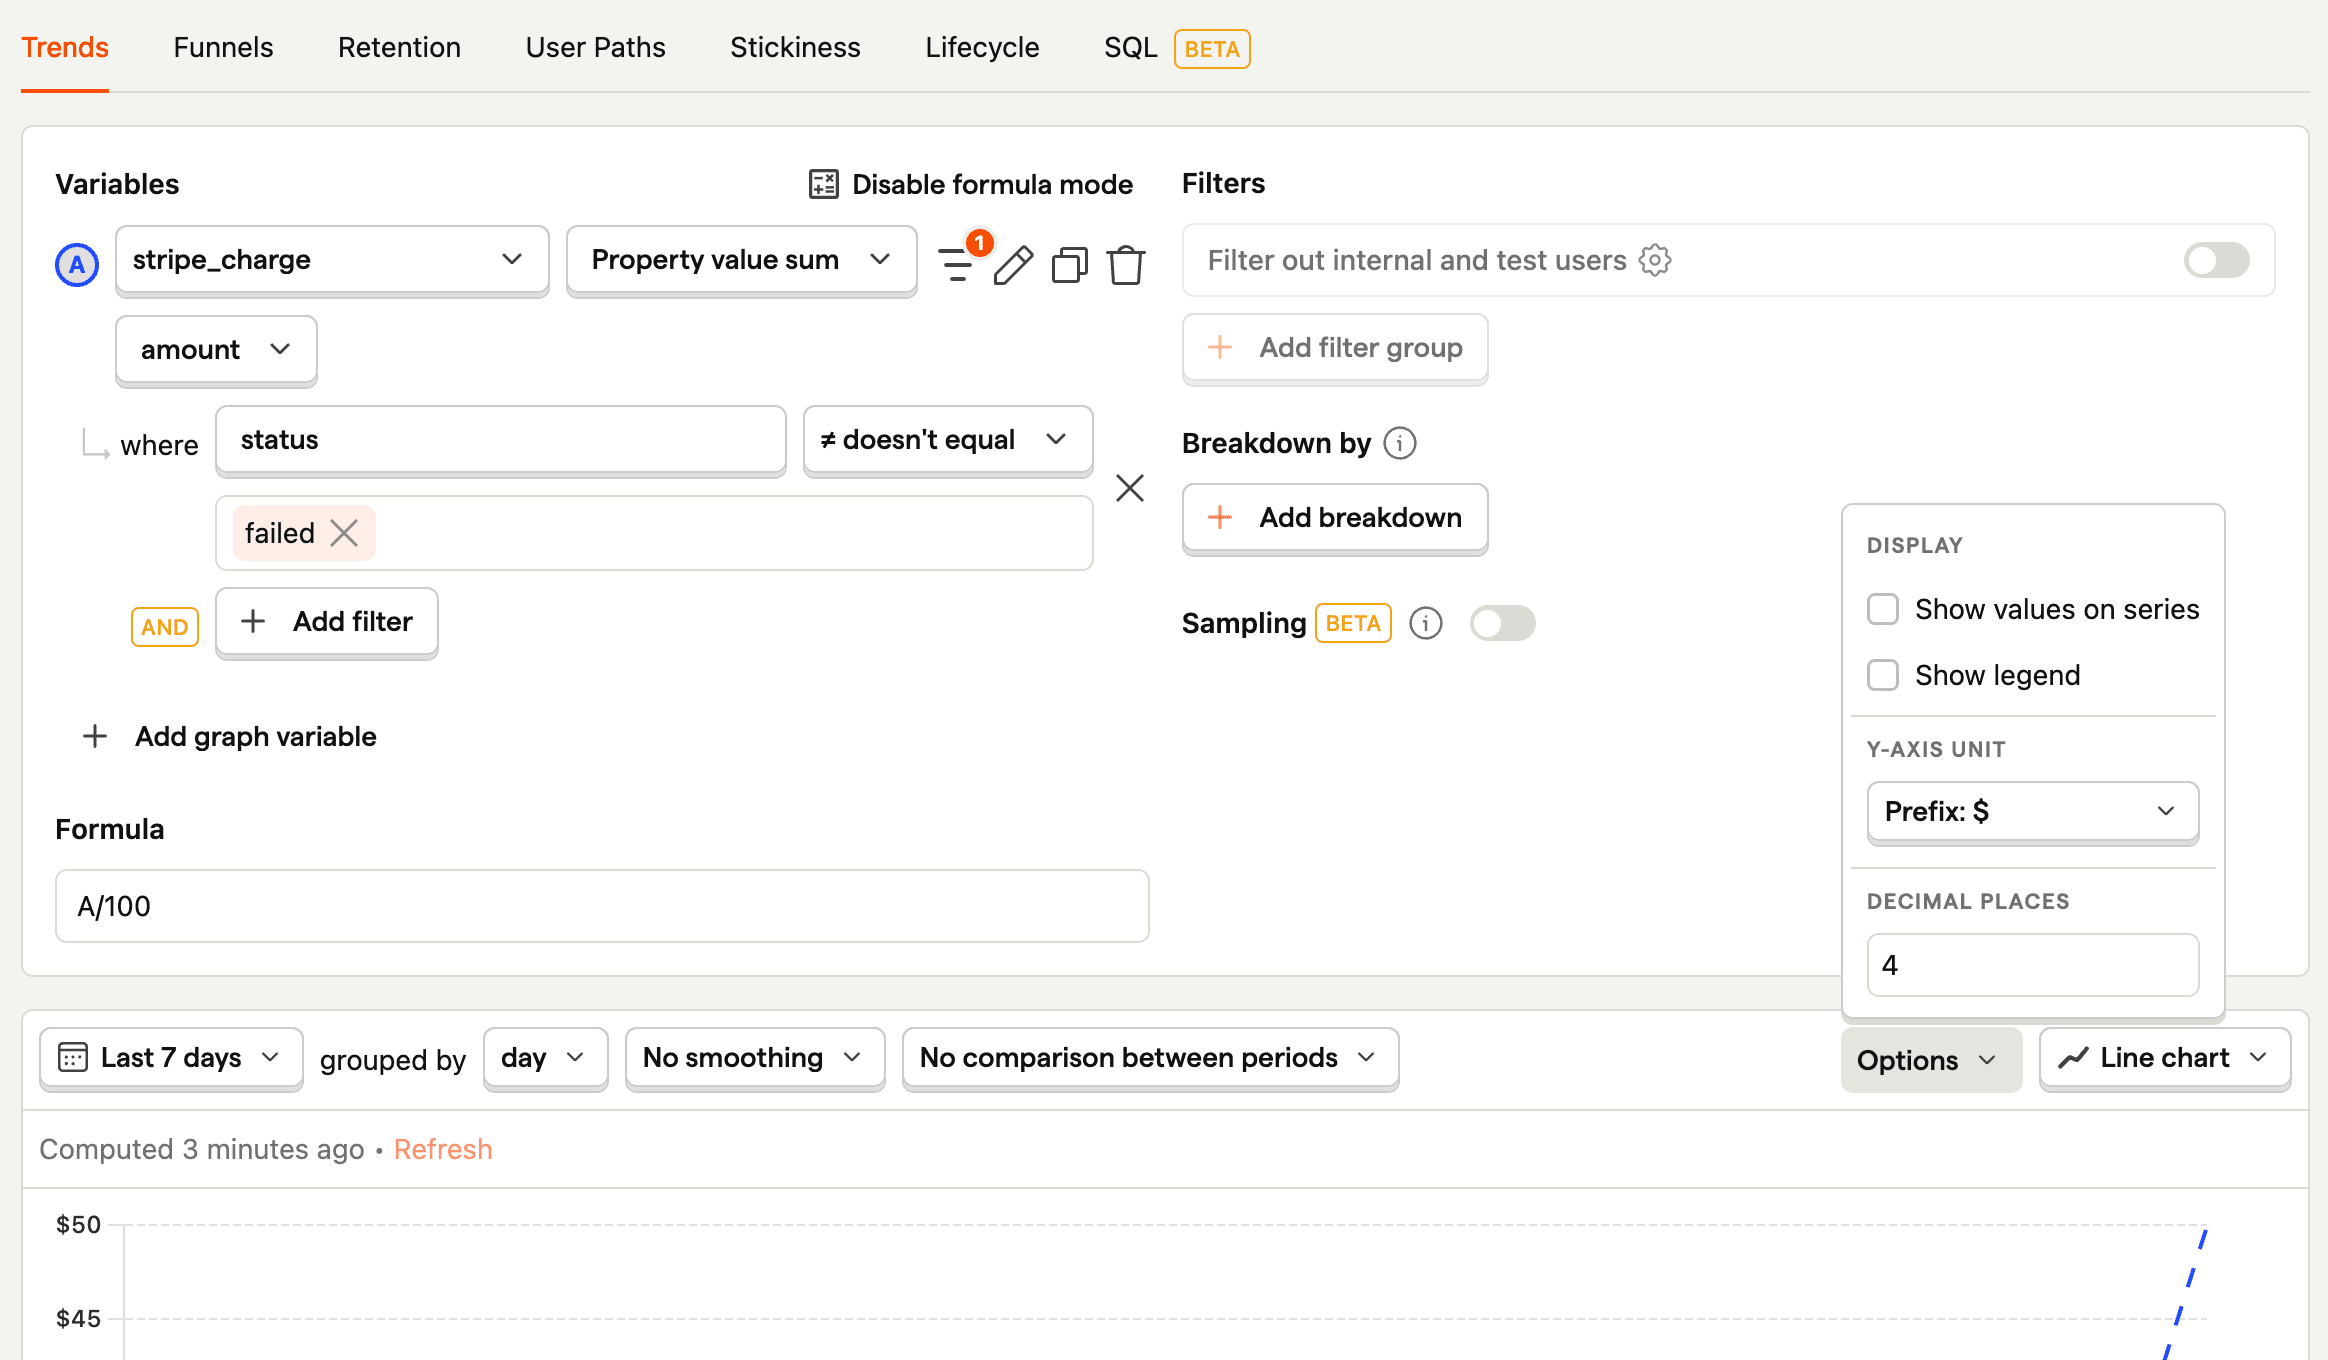
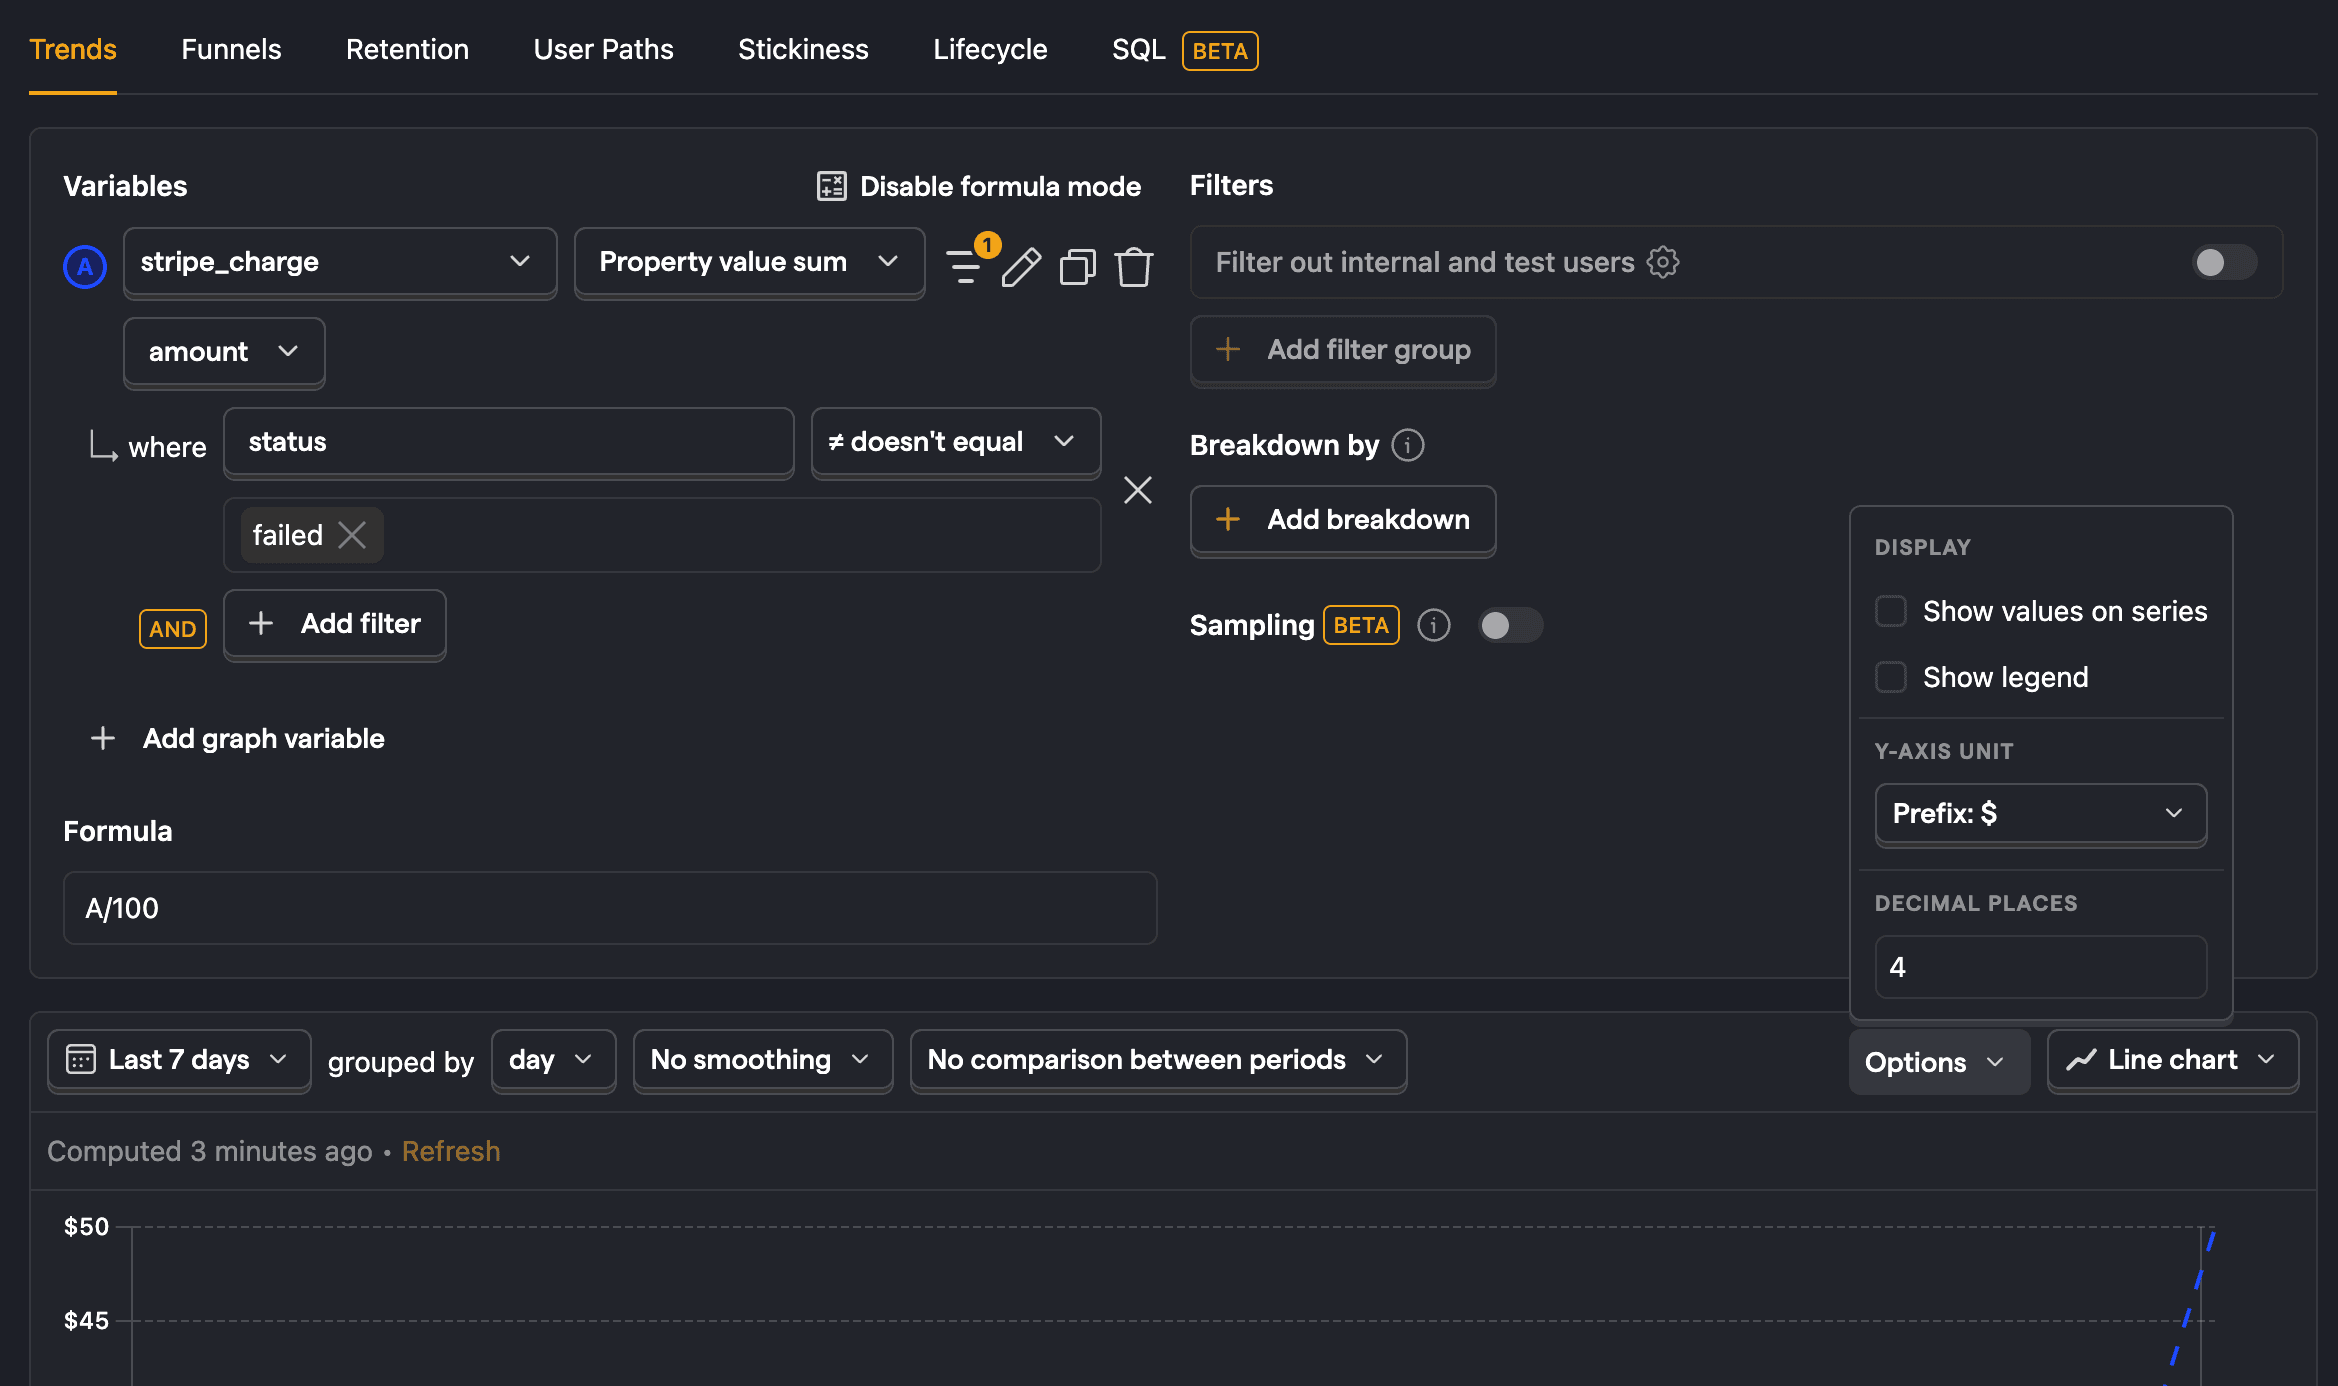
Gross revenue
Next, we can get our gross revenue by doing a similar process and selecting stripe_charge. For aggregation, we want Property value sum and then choose amount. We also want to filter out failed charges by clicking the filter button, selecting the status property, and making sure it doesn't equal failed.
Finally, to clean up the visualization, click enable formula mode to divide by 100 (the amount value is in cents) and click Options on the chart to add $ as a prefix.
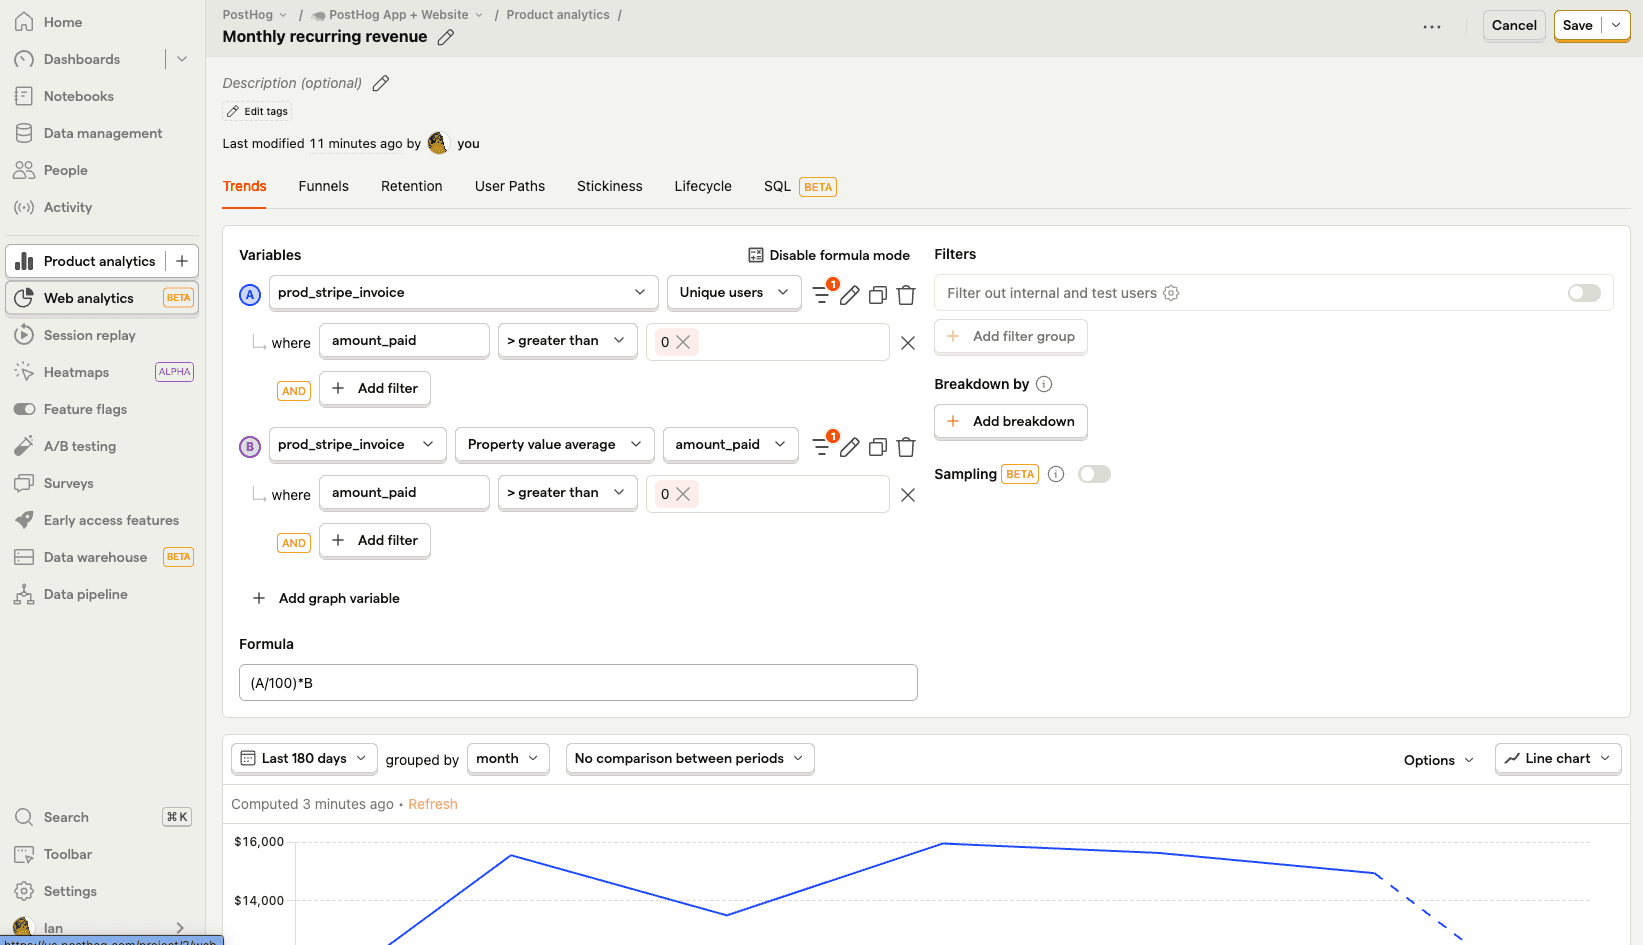
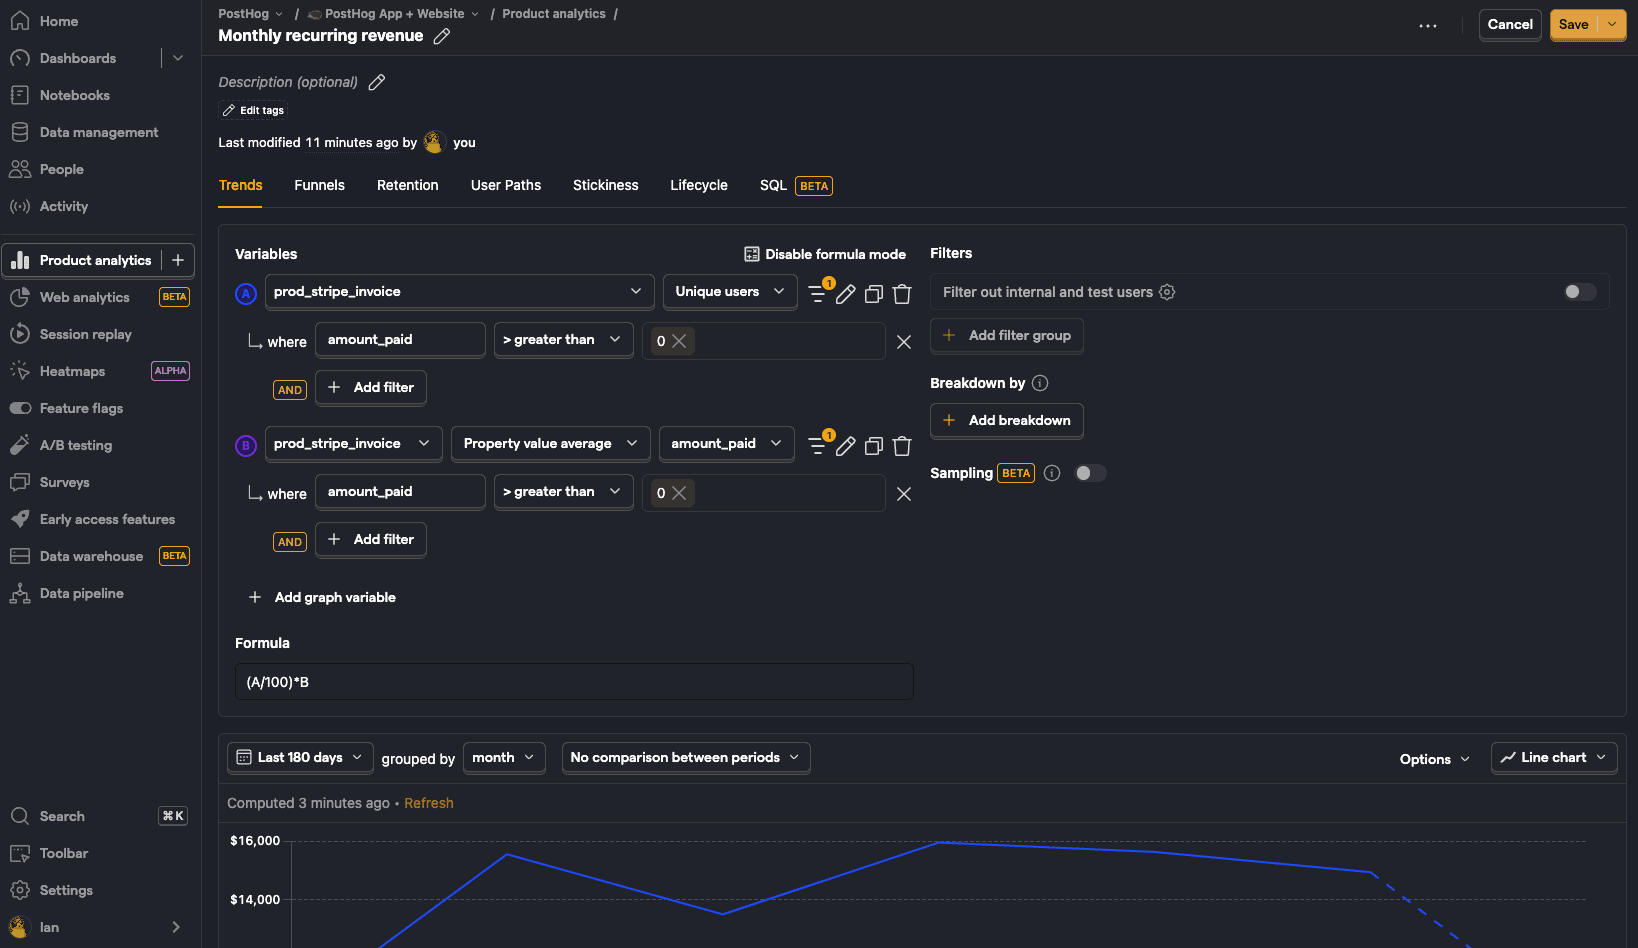
Monthly recurring revenue (average revenue per customer)
There are many ways to calculate monthly recurring revenue, but the easiest and most common is multiplying the number of customers by the average revenue per customer per month.
To do this, we'll rely on the stripe_invoice series. Make sure to set customer_id as the distinct ID field before you select it, and then change the aggregation type to unique users. We also want to filter out invoices with nothing paid, so add a filter where amount_paid is greater than 0.
Next, we can copy that series to create another but modify it to aggregate by property value average of amount_paid.
Finally, we use formula mode to divide the amount by 100 and then multiply by the number of users with (B/100)*A. You can add the prefix and likely want to change the graph to the last 180 days grouped by month.
Monthly recurring revenue (the Stripe way)
Stripe calculates MRR by "summing the monthly-normalized amounts of all active subscriptions at that time."
To mimic this calculation in PostHog, we need to write an SQL query that gets all the subscription items, normalizes the subscription amount, and then sums them up. Because a lot of this data is in JSON, we need to extract the values.
Why can't we get a rolling MRR? Due to a Stripe API limitation, we only sync new records, not update existing ones. This means when a subscription was created in July but is still active in November, we can't see that it was active for all those months, we only see its current state. For an accurate rolling MRR calculation, we need to know the active state of each subscription for every month in history, but this data isn't available with our current setup.
Revenue churn
For many companies, the amount of money they lose is just as important as the amount they retain. To measure this, we can track revenue churn.
To do this, we write SQL to query both the stripe_invoice and stripe_subscription for users with an invoice but without a subscription. This requires joining the tables together on the customer_id value, and looks like this for the last 30 days:
Revenue growth rate
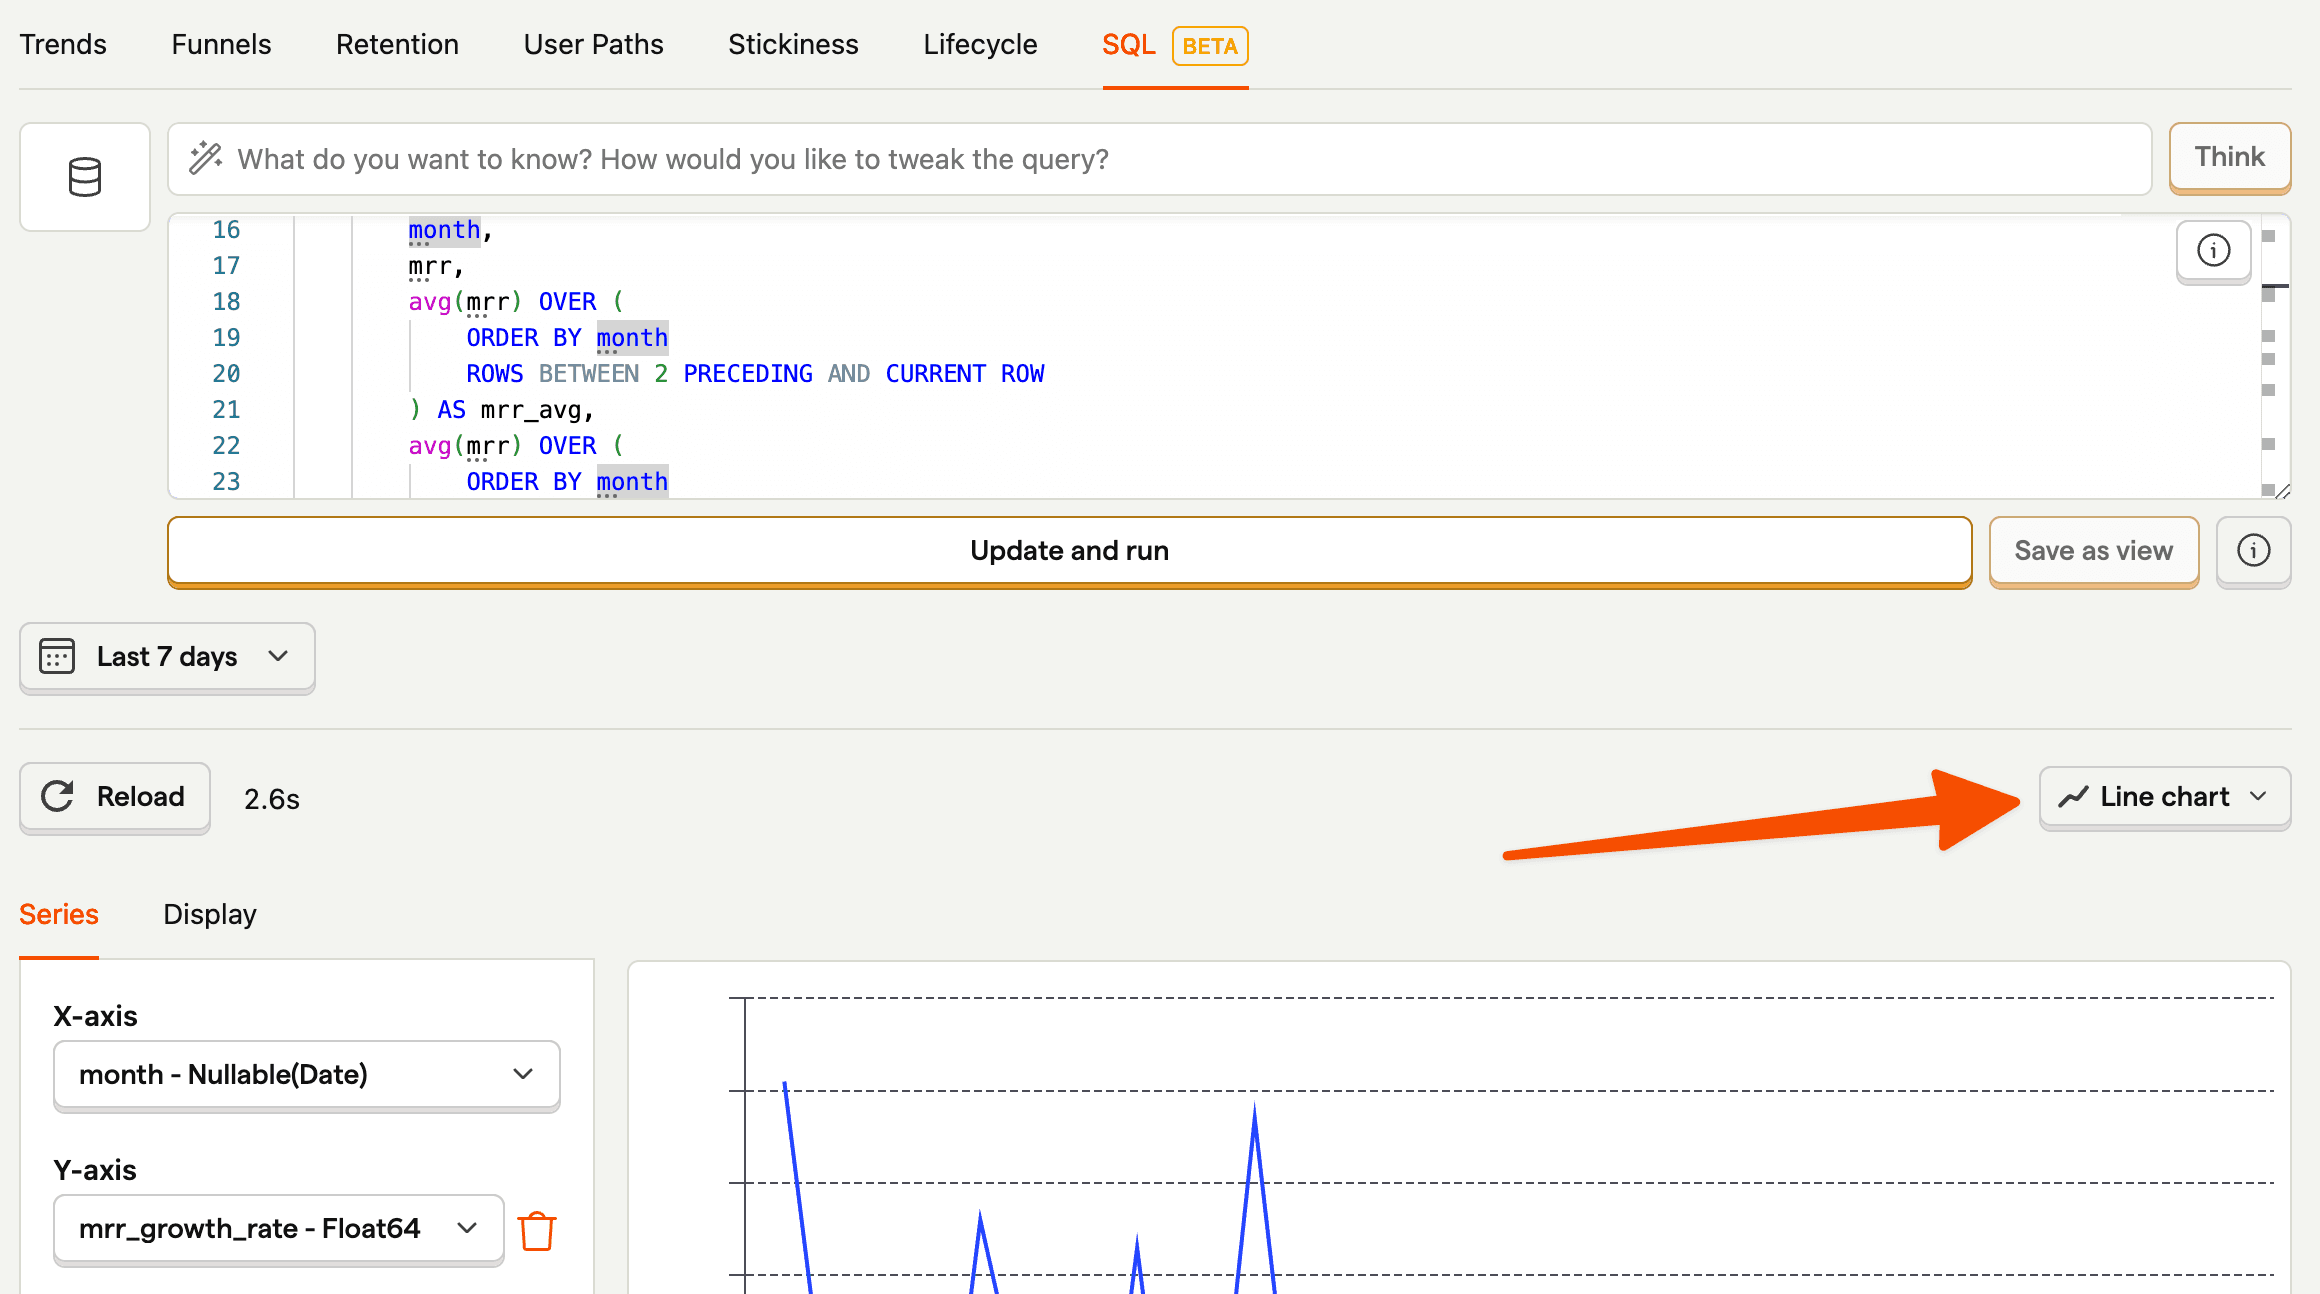
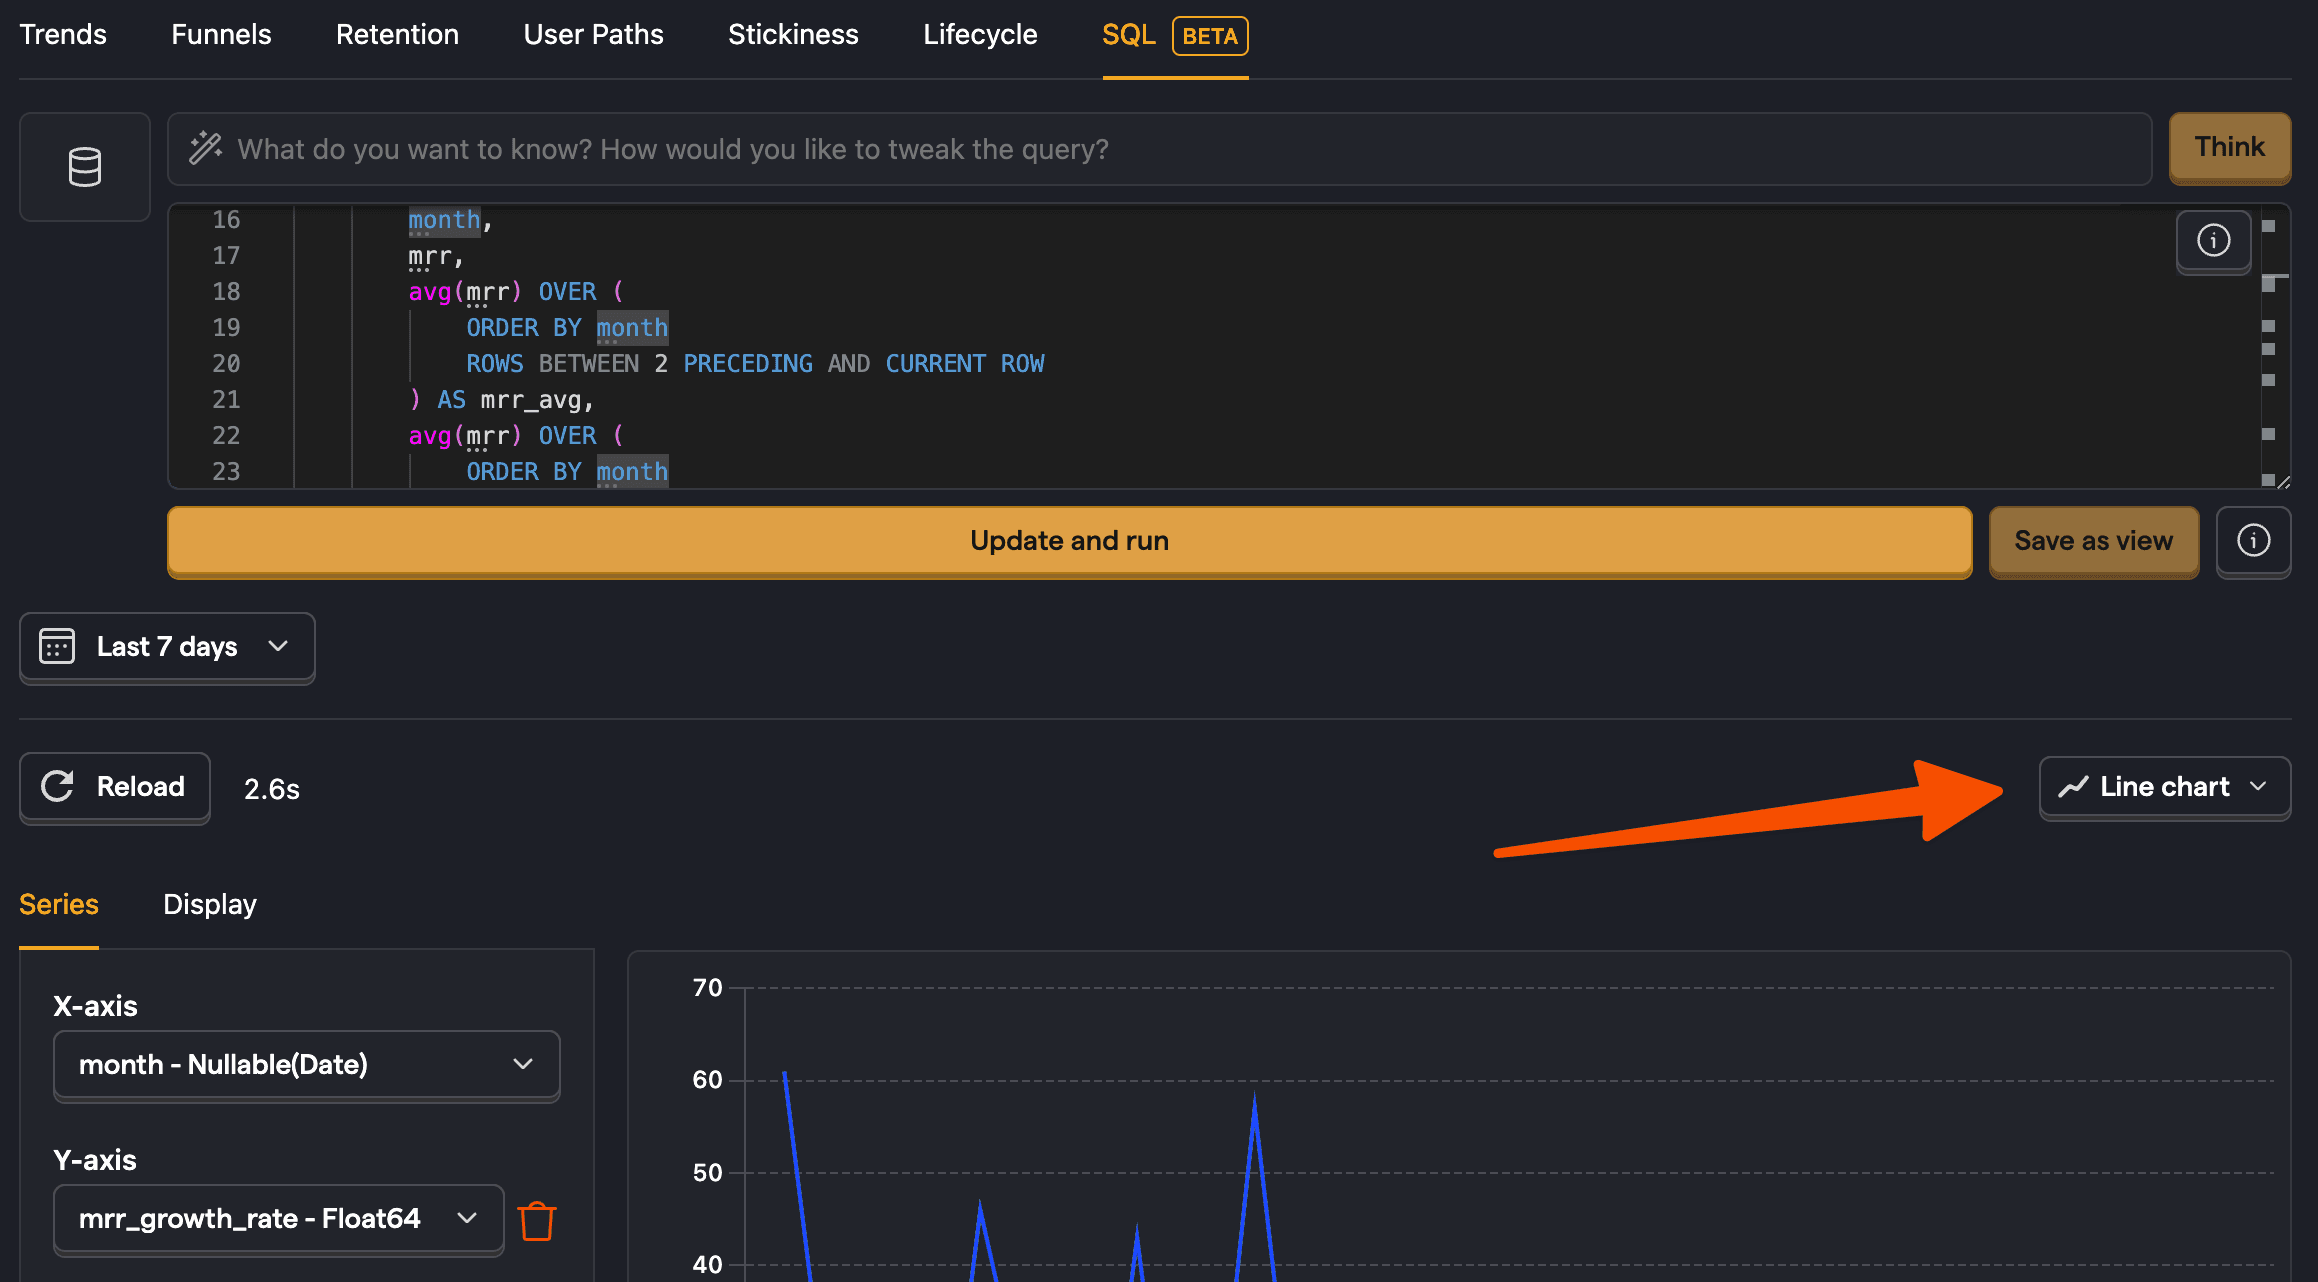
To get revenue growth rate, query stripe_invoice to get the monthly amount paid sum, but then we use window functions to calculate growth. These smooth out the month-over-month changes to give us a 3-month average to use in our growth rate calculation.
The nice part about this is that we can still visualize the query data as a graph by choosing the line chart option below the query and then choosing month as the X-axis and MRR growth as the Y-axis.
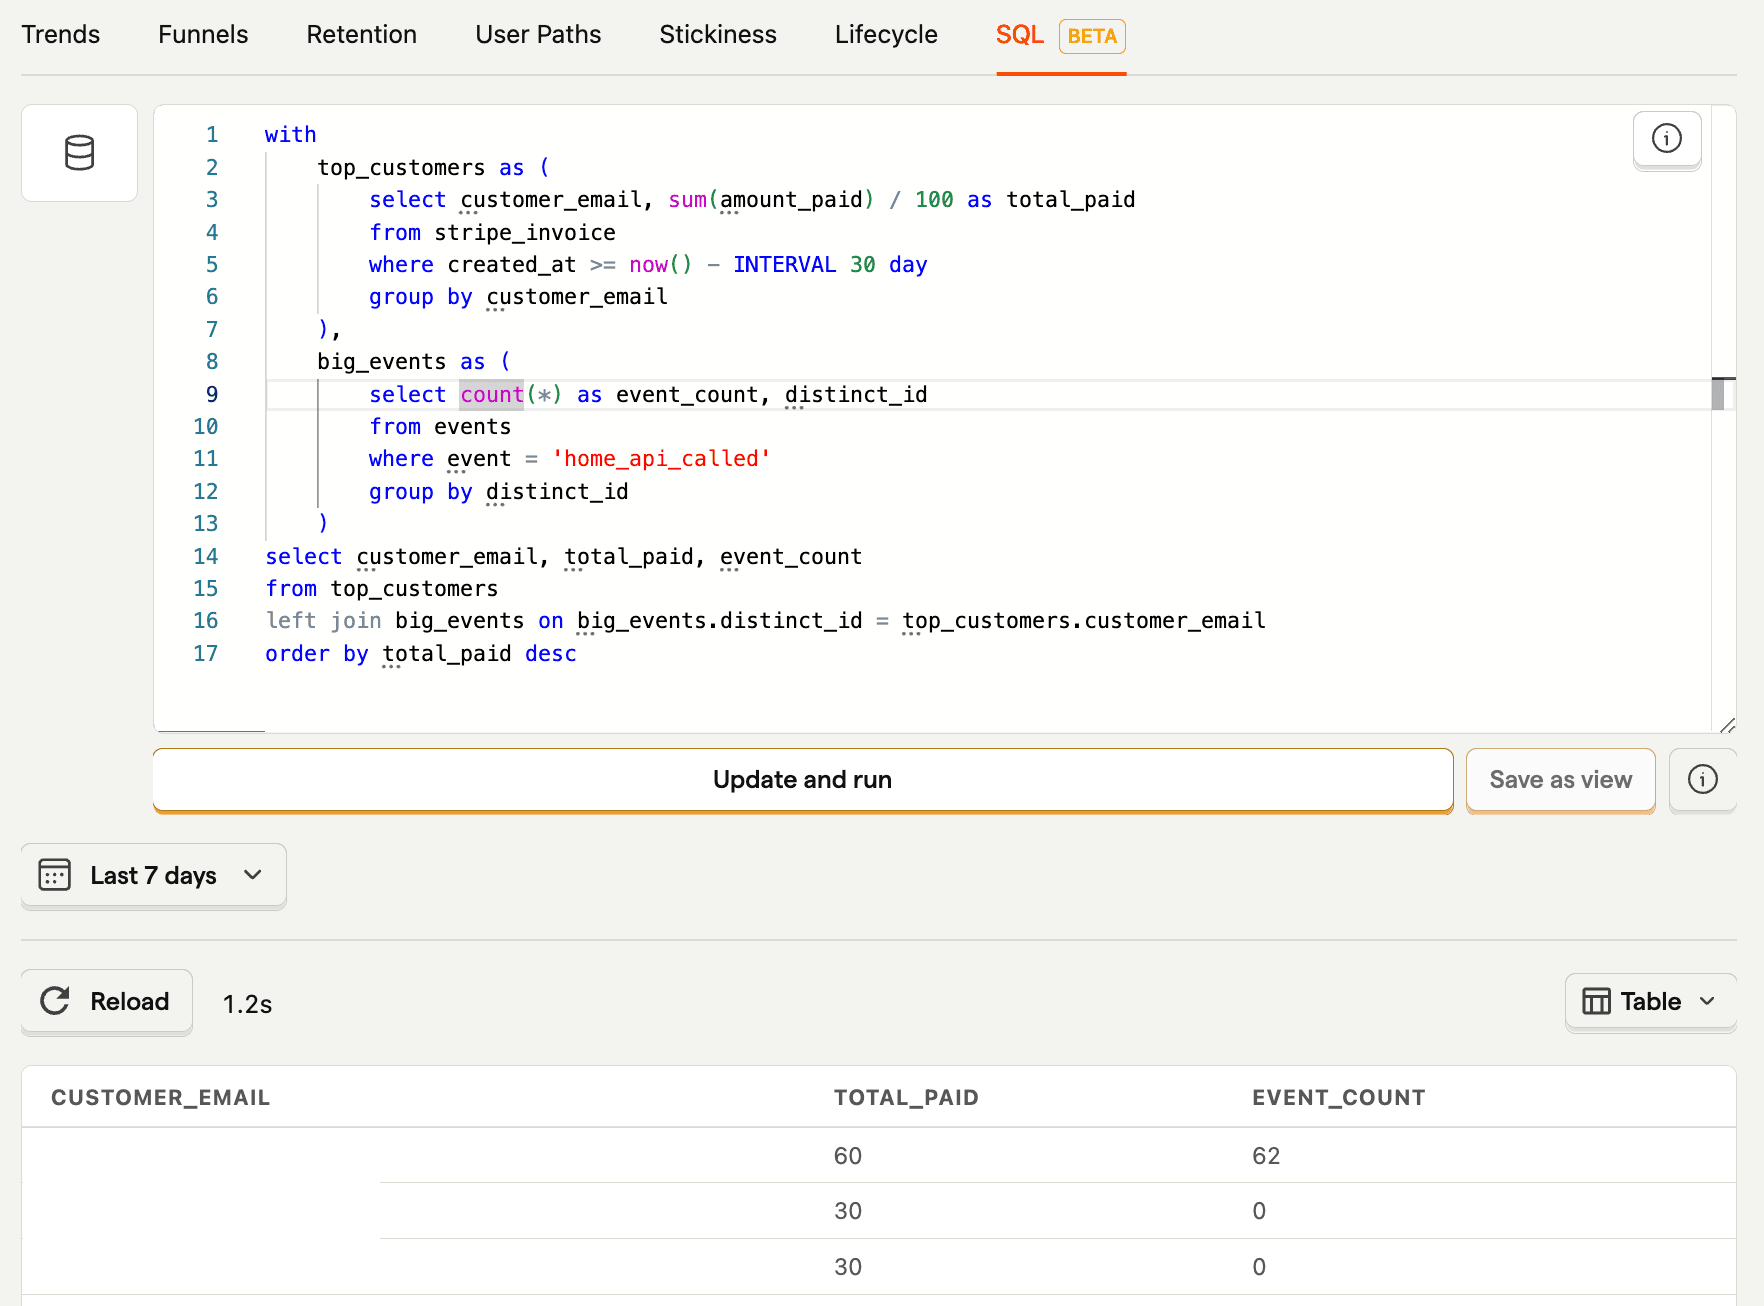
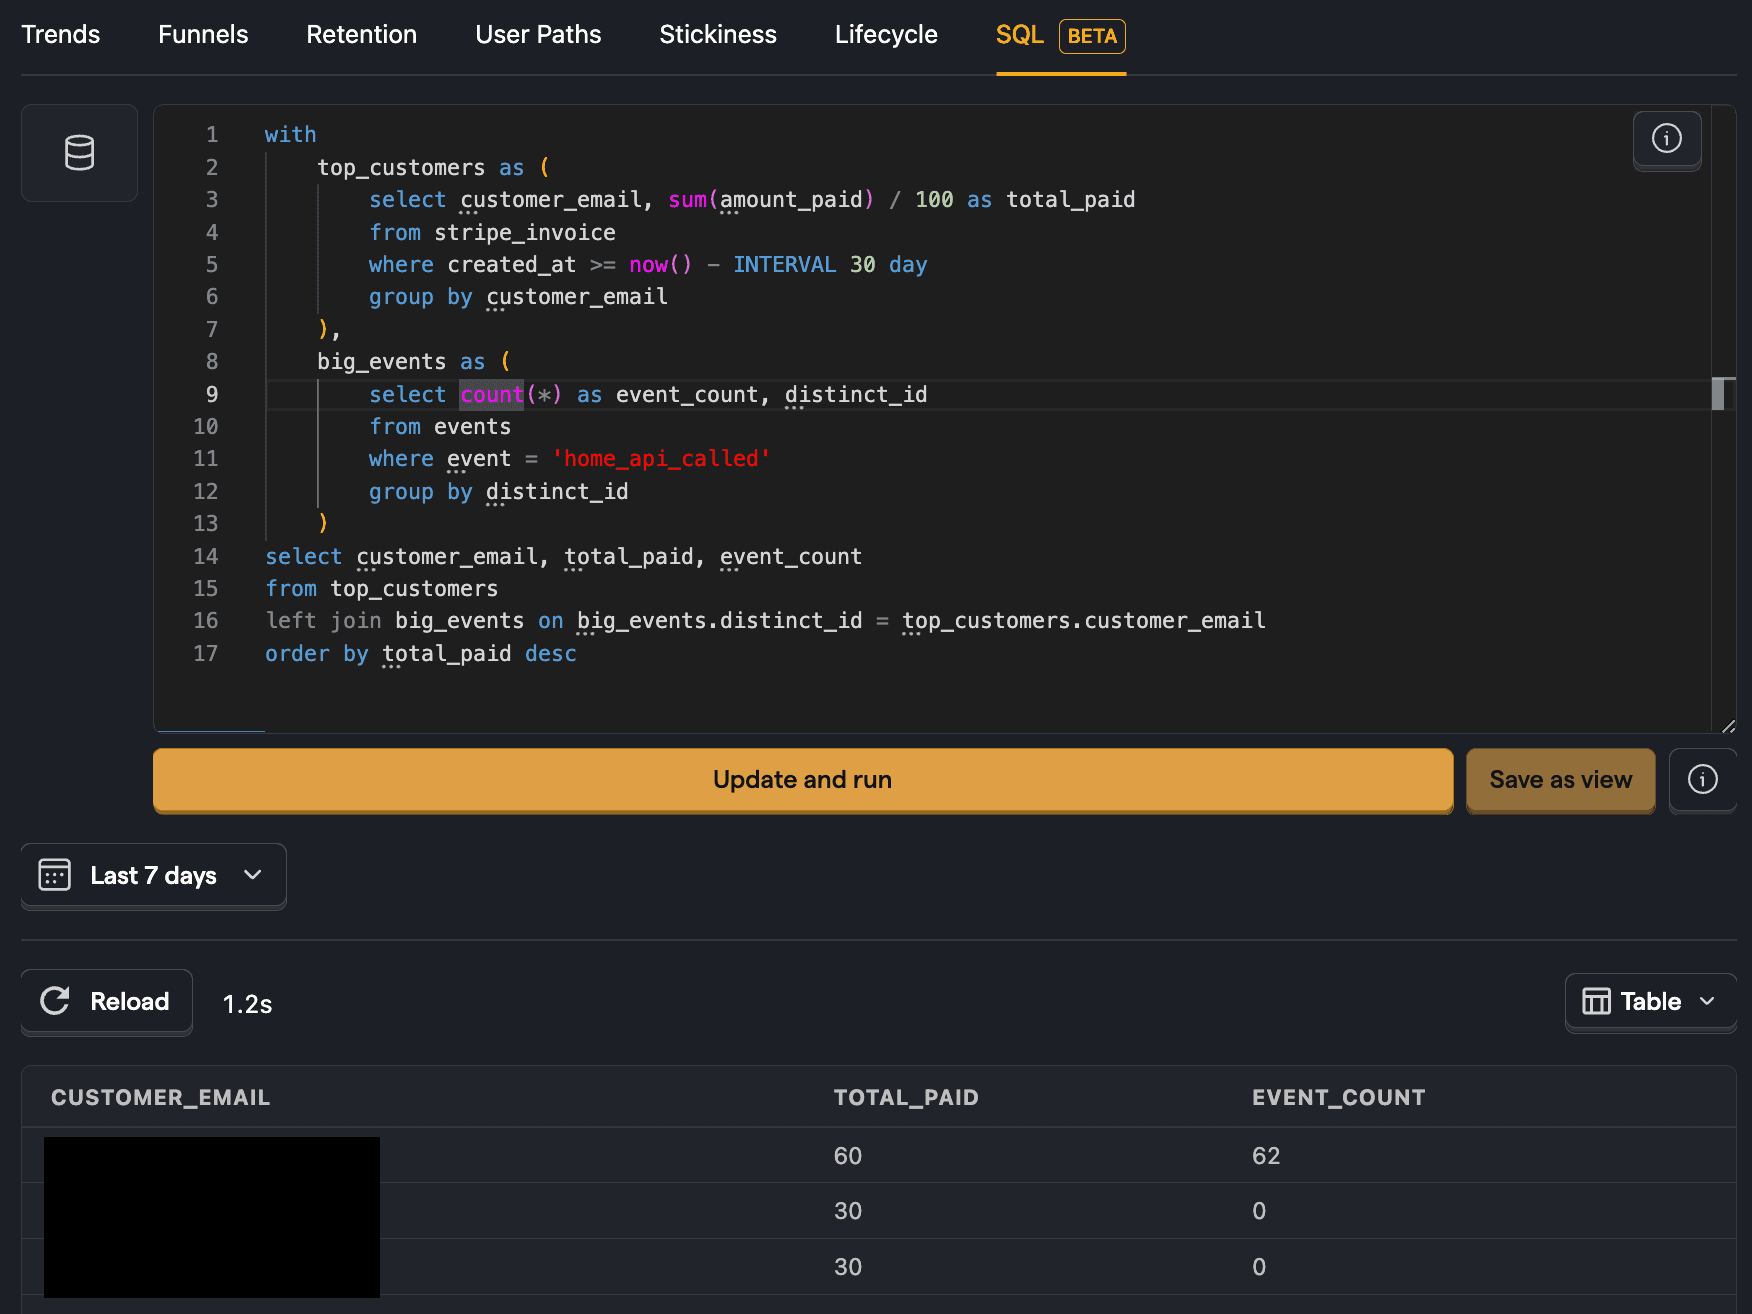
Usage by top customers
The great part of syncing your Stripe data in PostHog is using it alongside your product data. An example of doing this is querying the usage of top customers.
To do this, we get the top customers from the stripe_invoice and join their emails with their PostHog distinct_id to get a count of their events.
You can further break this down by filtering for specific events like home_api_called.
Further reading
- The basics of SQL for analytics
- Using SQL for advanced breakdowns
- Adventures in null handling: Null money, null problems

Subscribe to our newsletter
Product for Engineers
Read by 100,000+ founders and builders
We'll share your email with Substack
PostHog is the leading platform for building self-driving products. With a full suite of developer tools – AI observability, product analytics, session replay, feature flags, experiments, error tracking, logs, and more – PostHog captures all the context agents need to diagnose problems, uncover opportunities, and ship fixes. A data warehouse and CDP tie it all together, unifying that context into one source agents can read across. You can steer it all from Slack, the web app, the desktop (PostHog Code), or your own editor via the MCP.