


How to use session replays to get a deeper understanding of user behavior

Contents
One of the biggest benefits of PostHog is the connections from all your product data and tools being in one place. You don’t need to link together multiple products, find ways to connect the right data, and hop between them to create insights. PostHog builds in these links. For example, going from product data to visualizations to session replays is literally three clicks.
In this tutorial, we focus on the connections session replays have with insights and visualizations. These connections enable deeper exploration and understanding of user behavior.
Session recordings require installing the JavaScript library or snippet and enabling "Record user sessions" in project settings under recordings.
Watching users through funnels
When viewing a funnel, it is easy to lose a sense of what is happening in reality. You can combine funnels and session replays to understand what caused users to succeed or drop off. Watching session replays reconnect you to the reality of what is happening in your funnel.
Once you’ve created a funnel insight, click any of the “persons” numbers in the visualization. These are either beside “completed step” or “dropped off.” Clicking them gives you a list of users and their related sessions to dive into the details.

When viewing a session, you can click the “Only show matching events” toggle to filter the session’s events by the ones connected to your funnel’s events. This makes it quick to view the relevant funnel events.
For example, you can use a signup funnel insight to both analyze the ongoing conversion from pageview to signup, as well as the details of where users get stuck via recordings. This should enable you to get an idea of the problem areas in the funnel, as well as specific ways to improve it.
Watch funnel sessions of correlated events and properties
Correlated events and properties show what event or property leads to someone completing or dropping off from your funnel. Encouraging or discouraging these events or properties can help improve your funnel. Be careful not to focus on them too much because they can also mislead you from real user behavior. Luckily, there is a list of users and recordings connected to each of the correlated events and properties.
Below your created funnel, you get a set of correlated events and another for properties. You can click the “Completed” or “Dropped off” numbers on any of them to view a list of users and the related replays.
Tip: To only see success or drop off correlated events or properties, click the selectors in the top right of the component.

Viewing a session replay for a correlated event or property gives a fuller picture of the importance of that correlation. It isn’t just an event or property, but an overall behavior leading to different results.
Watching journeys from user paths
The user path visualization gives you a collective insight into the paths users are taking throughout your product. They are an aggregate view of how users are moving through your product, but each journey is different. Session recordings enable you to explore individual journeys, and they connect to every step of the user path visualization.
At every step of the path, you can click the number next to the step, “continuing,” or “dropping off” to view users who viewed that page (or didn’t). From the list, you can go see related recordings.
In a recording, you can see the specifics of their journey, including the parts relevant to the path. Use the “Only show matching events” toggle to filter for events related to the stage of the path you clicked.

Find and analyze outliers in trend graphs
There are multiple ways to visualize outliers and extreme usage of your product in PostHog. Some of these include trends for:
- 90th, 95th, 99th percentile, max, or min count per user
- 90th, 95th, 99th percentile, max, or min property value
- extreme filters on events or person properties
After creating one of these in insights, you can click the graph to view a list of users and their related session replays. Viewing the related recordings can help you understand their extreme usage.
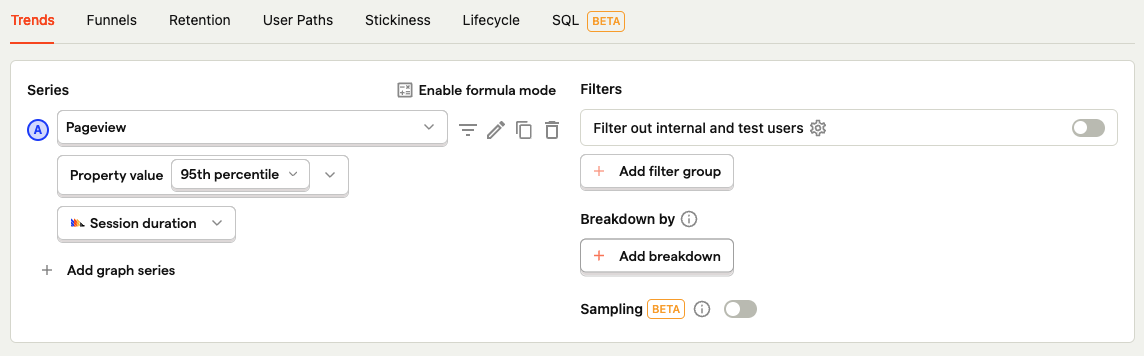
For example, you can create a trend for 95th percentile session duration by creating a series with pageview events, and property value (95th percentile), then make sure to choose “Session duration” under “Sessions” as your property.
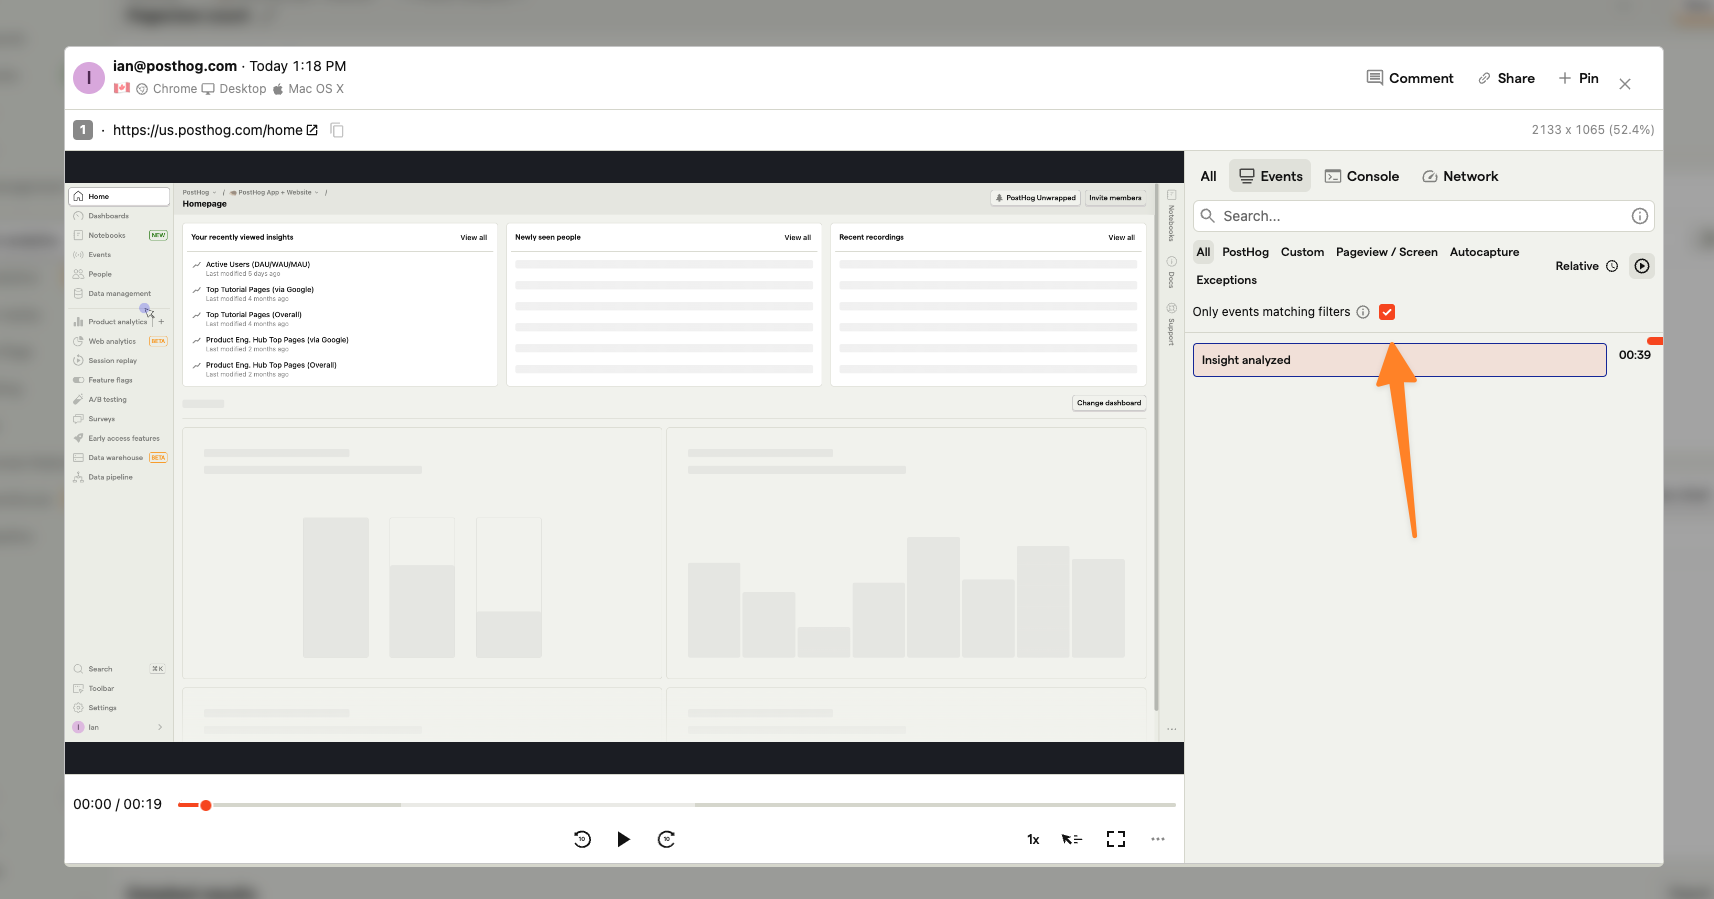
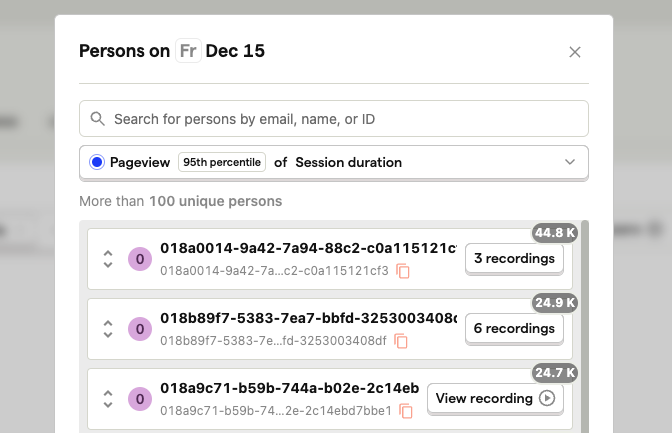
Once created, click any of the days in the graph, and you get a list of people with a 95th percentile session duration that day. For any of them, click the recording to see what they were doing that whole time.
Tip: If you are watching long session replays, make sure to enable “Skip inactivity” (open the ... more options menu in the player controls to toggle it). You can also increase the speed of playback using the “1x” button.
Further reading

Subscribe to our newsletter
build mode
Read by 75,000+ founders and builders
We'll share your email with Substack
PostHog is the leading platform for building self-driving products. With a full suite of developer tools – AI observability, product analytics, session replay, feature flags, experiments, error tracking, logs, and more – PostHog captures all the context agents need to diagnose problems, uncover opportunities, and ship fixes. A data warehouse and CDP tie it all together, unifying that context into one source agents can read across. You can steer it all from Slack, the web app, the desktop (PostHog Code), or your own editor via the MCP.