


Getting started with experiments
Install PostHog SDK
Experiments enable you to test the impact of product changes and understand how they affect your users' behavior. For example, testing different onboarding flows, app designs, or pricing strategies.
The first step is to install PostHog with the library you want to run experiments in:


Create your first experiment
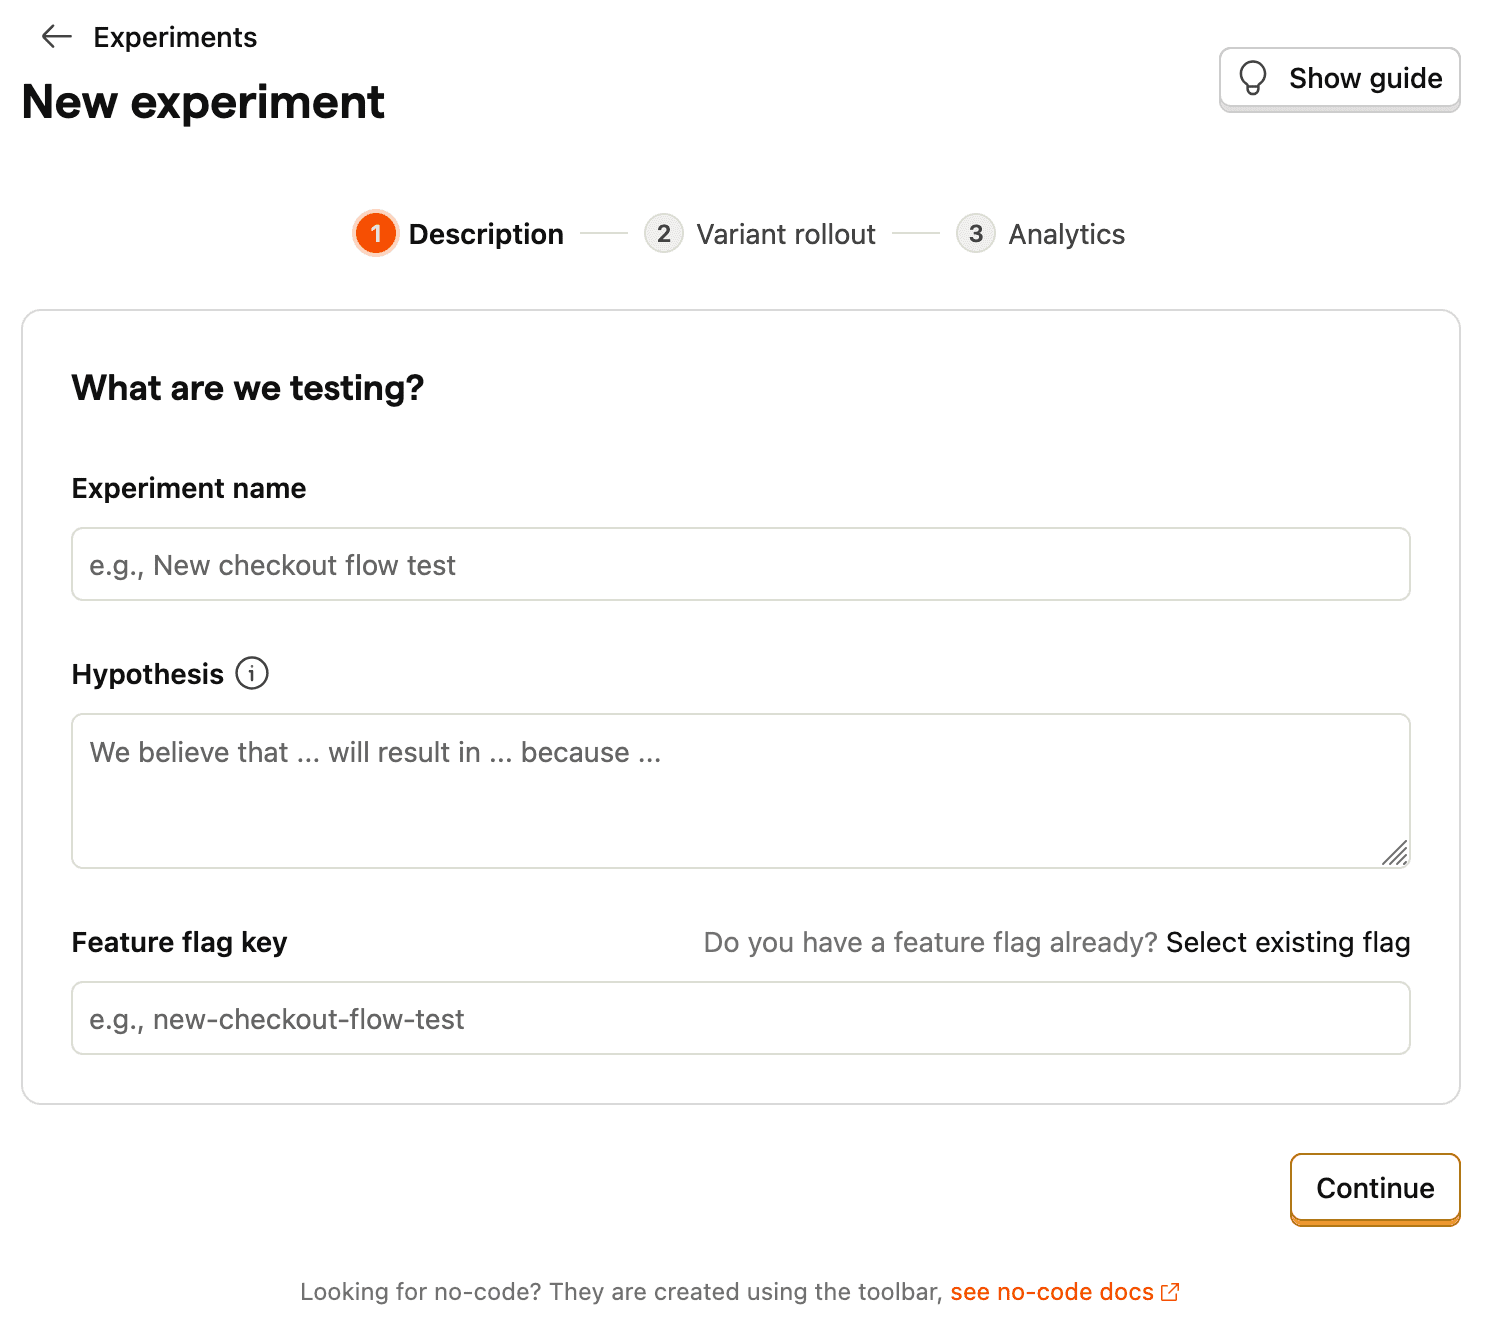
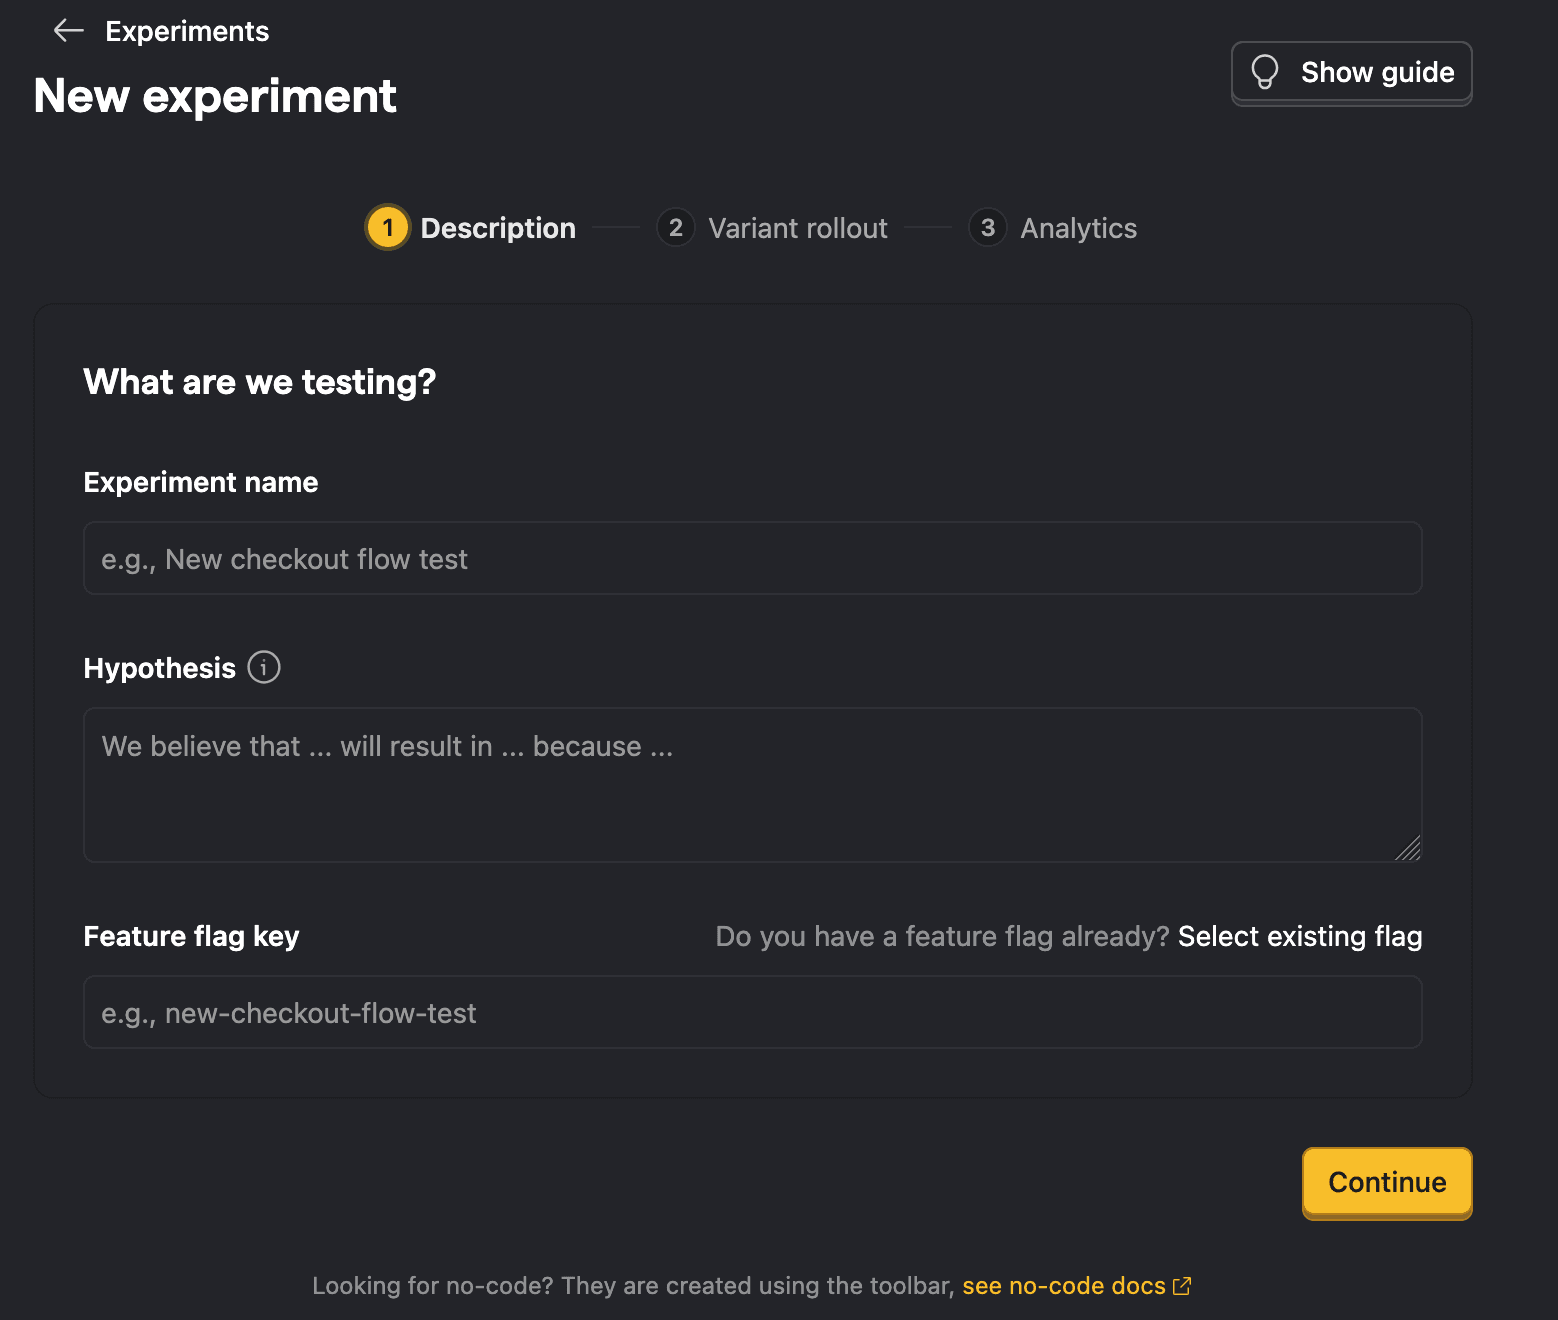
Once PostHog is installed, create your experiment by going to the Experiments section and clicking New experiment.
This opens a guided creation wizard that walks you through three steps:
- Description – Name your experiment, write a hypothesis, and set the feature flag key
- Variant rollout – Configure variants, split percentages, and rollout percentage
- Analytics – Set inclusion criteria and add metrics to measure results
When you're done, click Save as draft on the final step. You can launch the experiment from its detail page after saving.
The following section goes into more detail on each step.
Add experiment code
With your experiment created, add the code to check which variant users see. Simply fetch the feature flag and customize the experience based on its value:
That's it! When you call getFeatureFlag(), PostHog automatically tracks exposures and starts collecting data for your experiment.
Add metrics
Metrics define how you measure the experiment's impact. You can add them in step 3 of the creation wizard, after saving the experiment, or even after launching the experiment.
There are two categories:
- Primary metrics – The main measurements that determine whether your experiment succeeded.
- Secondary metrics – Additional measurements to monitor for side effects or supplementary insights.
You can create metrics directly or reuse shared metrics defined at the project level. We recommend defining your metrics upfront to avoid biasing your analysis.
Monitor and analyze results
Once your experiment is running, monitor the results in real-time. PostHog shows:
- Statistical significance: Whether your results are reliable
- Win probability: The likelihood each variant is better
- Confidence intervals: The range of possible effect sizes
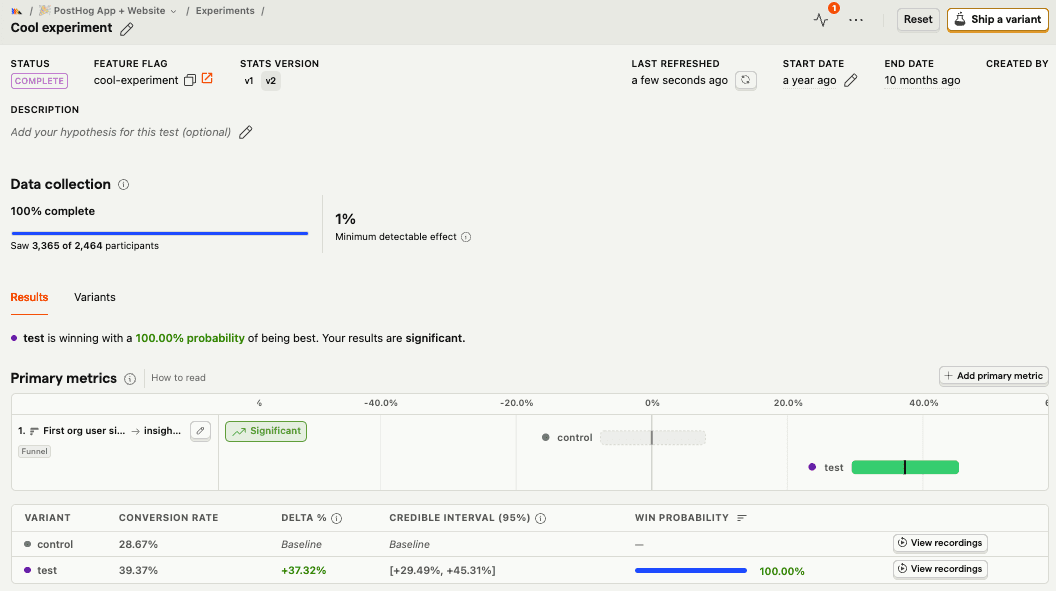
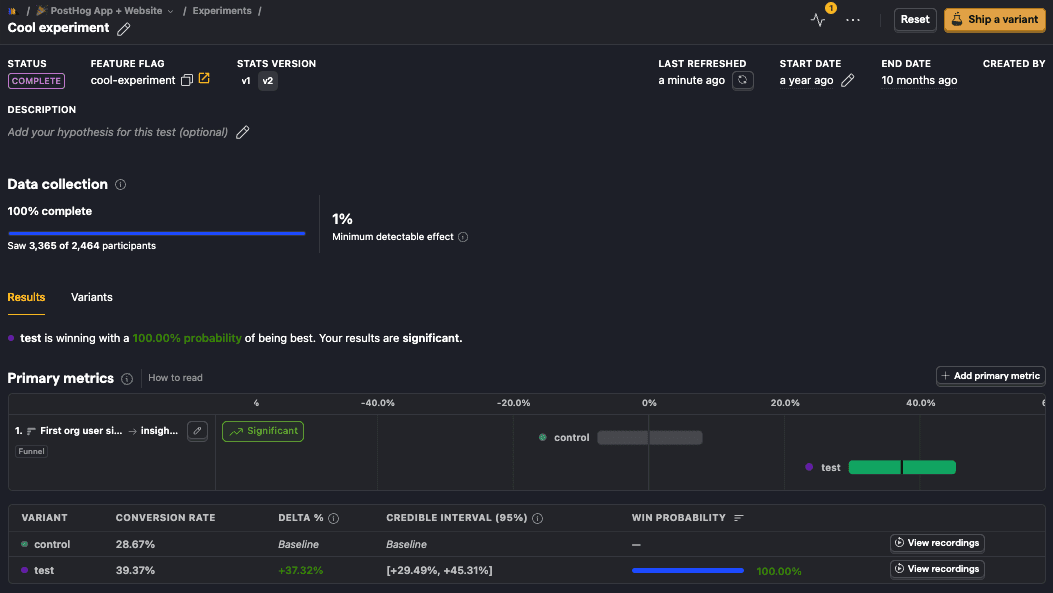
When your experiment reaches significance, you can end the experiment and choose a variant to keep using the End experiment button.
Advanced features
Take your experiments to the next level with advanced PostHog features:
Session Replay
See exactly what users experienced in each variant with session recordings tied to your experiment results. Filter recordings by experiment variant to understand why users behaved differently – click View recordings on any variant in your results to see recordings for users in that group.
Feature Flags
Use feature flags to target specific user segments, implement gradual rollouts, or run experiments on groups instead of individuals. You can also use holdout groups to measure long-term effects of your changes by excluding a subset of users from all experiments.
Advanced experimentation
- Statistical approaches – Choose between Bayesian (default) or frequentist analysis depending on your needs
- Multiple variants – Test more than two variants simultaneously by adding up to nine test variants alongside a control
- Outlier handling – Cap metric data at specified percentile thresholds to prevent extreme values from distorting results
- Best practices – Predetermine test duration, use launch checklists, and calculate the sample size needed to detect meaningful changes
Use for free
PostHog's experiments is built to be cost-effective by default, with a generous free tier and transparent usage-based pricing. Our generous free tier means more than 90% of companies use PostHog for free.
Experiments are billed with feature flags requests.
TL;DR 💸
- No credit card required to start
- First 1 million feature flag requests per month are free
- Above 1 million we have usage-based pricing starting at $0.0001/request with discounts as volume increases
- Set billing limits to avoid surprise charges
- See our pricing page for more up-to-date details
That's it! You're ready to start running successful experiments.