


Getting started with Replay Vision
Contents
Not yet available to everyone – join the waitlist to get updates.
This walkthrough takes you from zero to your first observation in about five minutes. We'll create a scanner from a built-in template, run it on a recording you pick, and then query the result as a regular PostHog event.
You should already have Session Replay recording sessions for your project. Replay Vision watches those recordings – without them there's nothing to scan.
1. Open Replay Vision and pick a template
Open Replay Vision from the side menu, then click New scanner. You'll land on the templates picker.
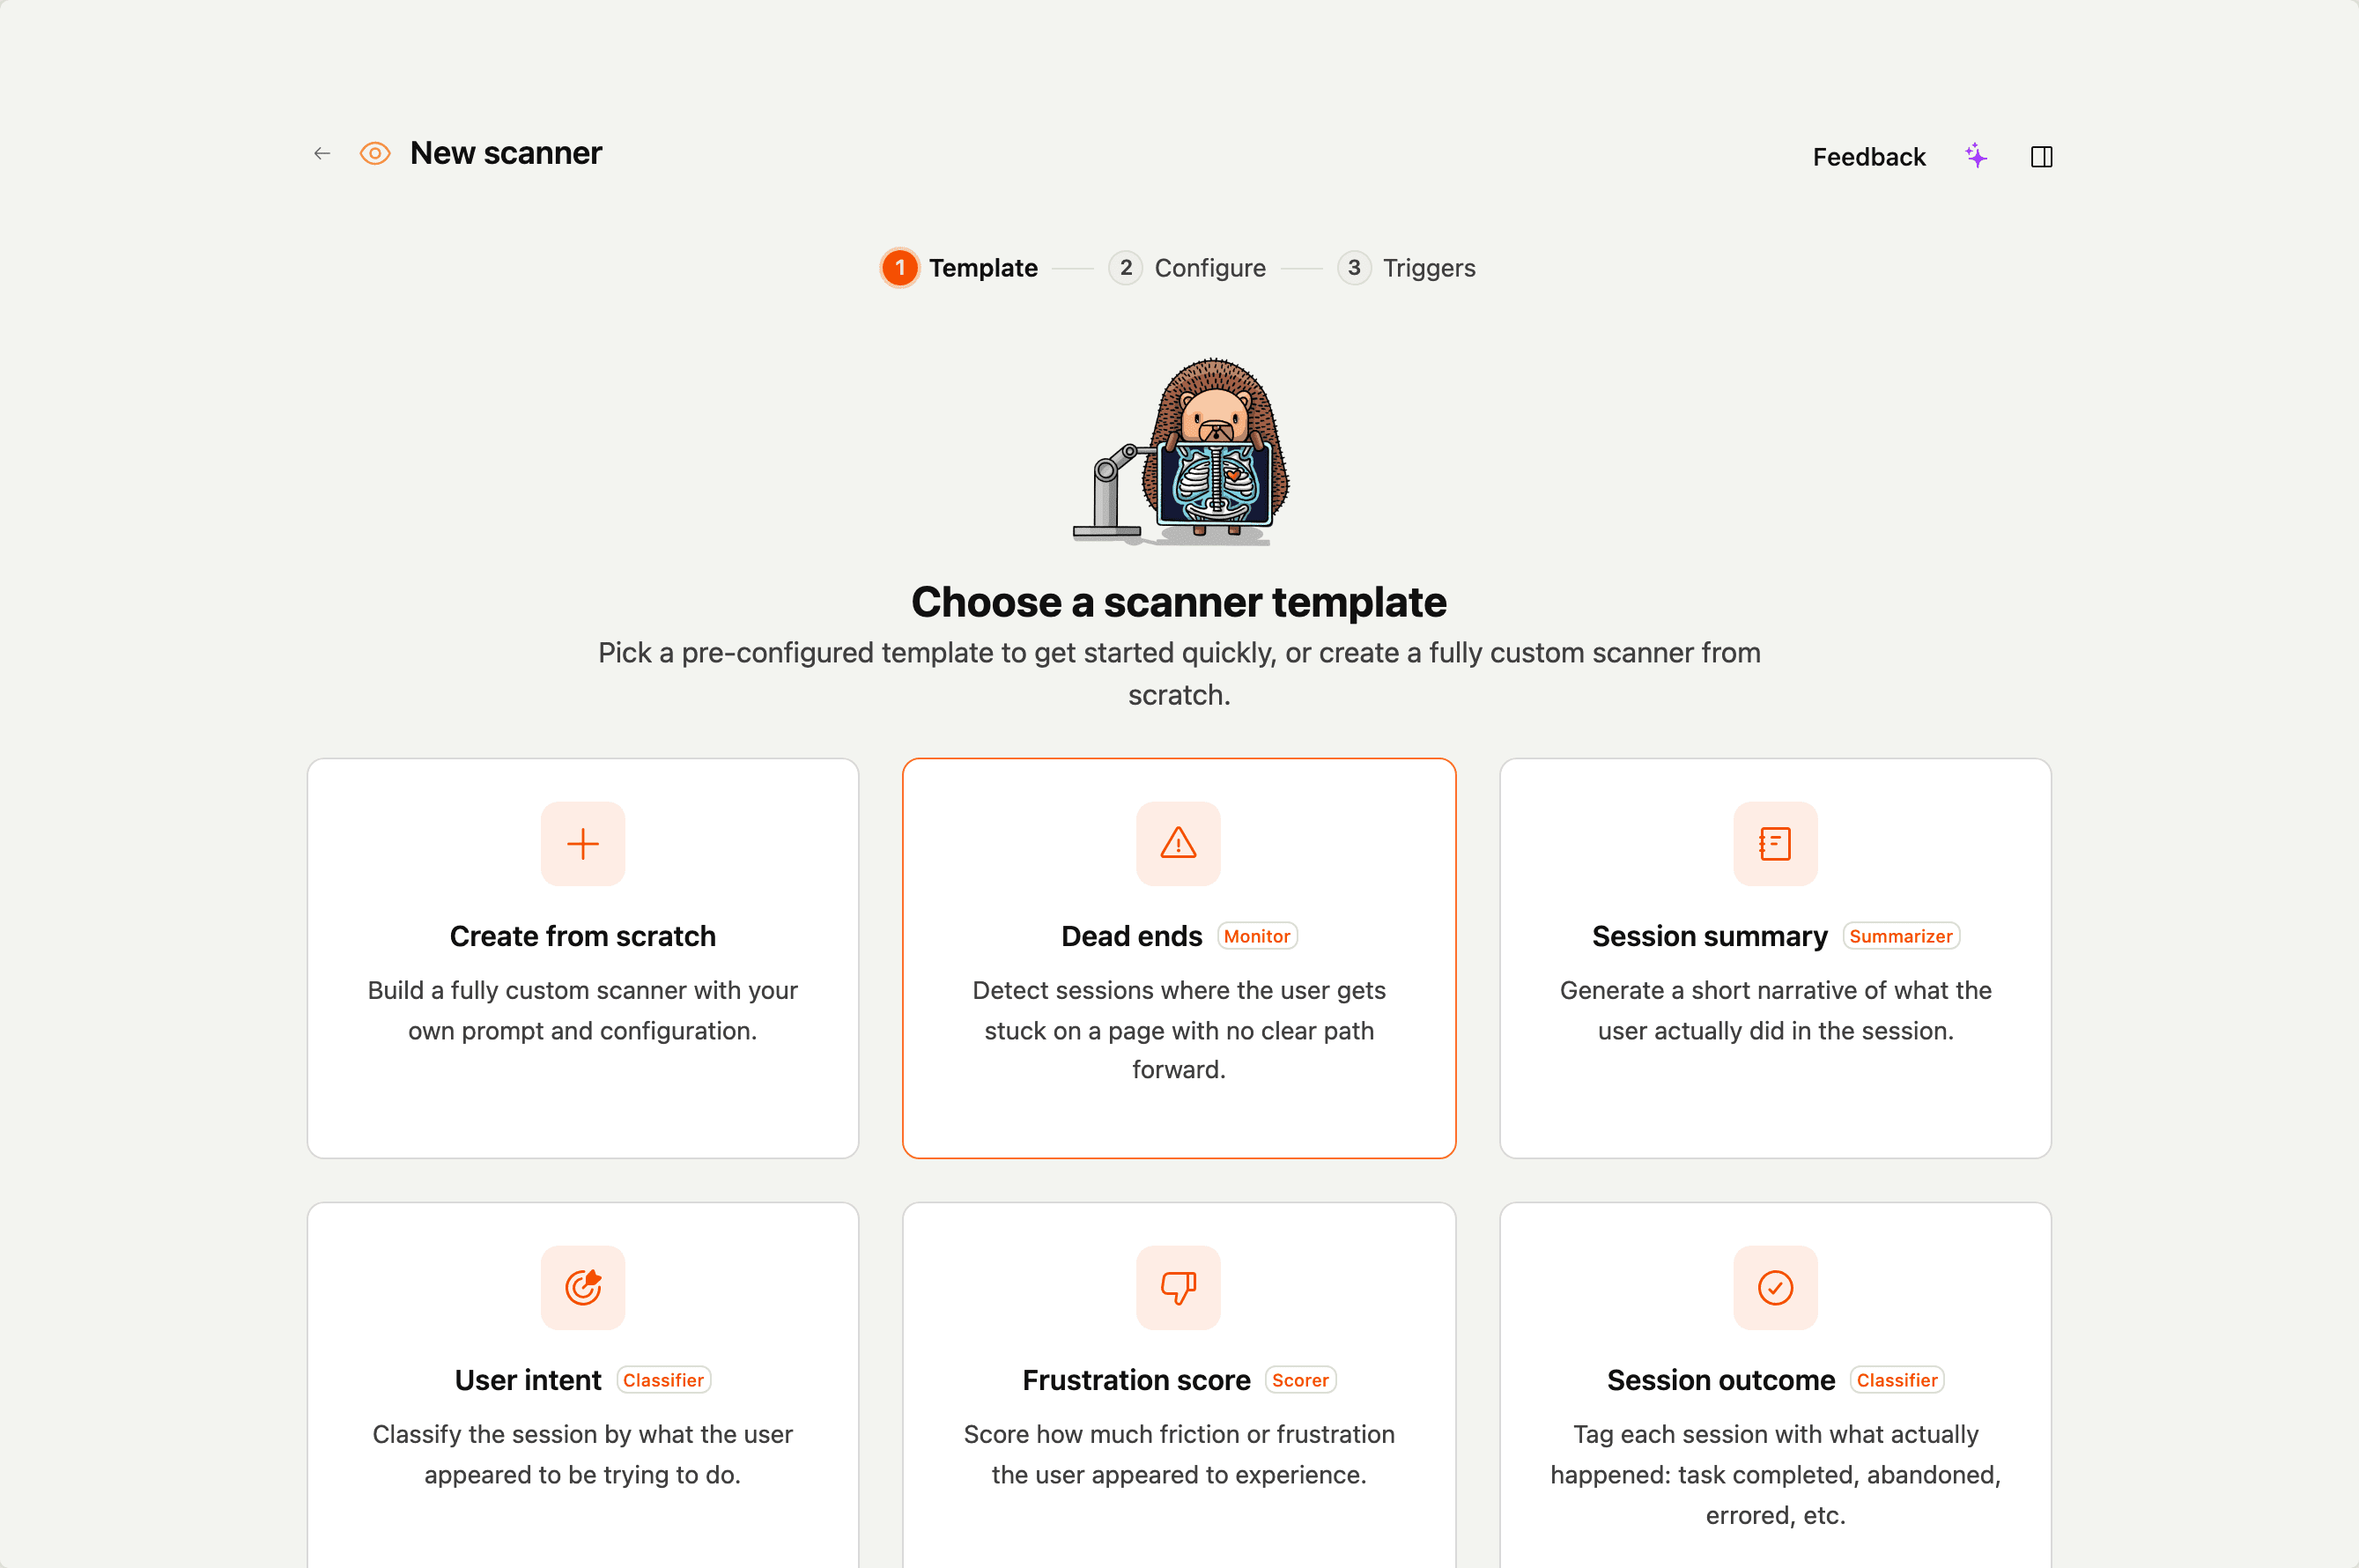
The templates cover the four scanner types:
- Dead ends (monitor) – flag sessions where the user appears stuck
- Session summary (summarizer) – short narrative of what happened
- User intent (classifier) – tag each session with the likely intent
- Frustration score (scorer) – numeric score for how frustrated the user appeared
- Session outcome (classifier) – tag the outcome (completed, abandoned, errored, …)
Pick Dead ends to follow along. You can change anything before saving – the template just pre-fills the form, including the scanner name ("Dead-end pages").
2. Look over the prompt and filters
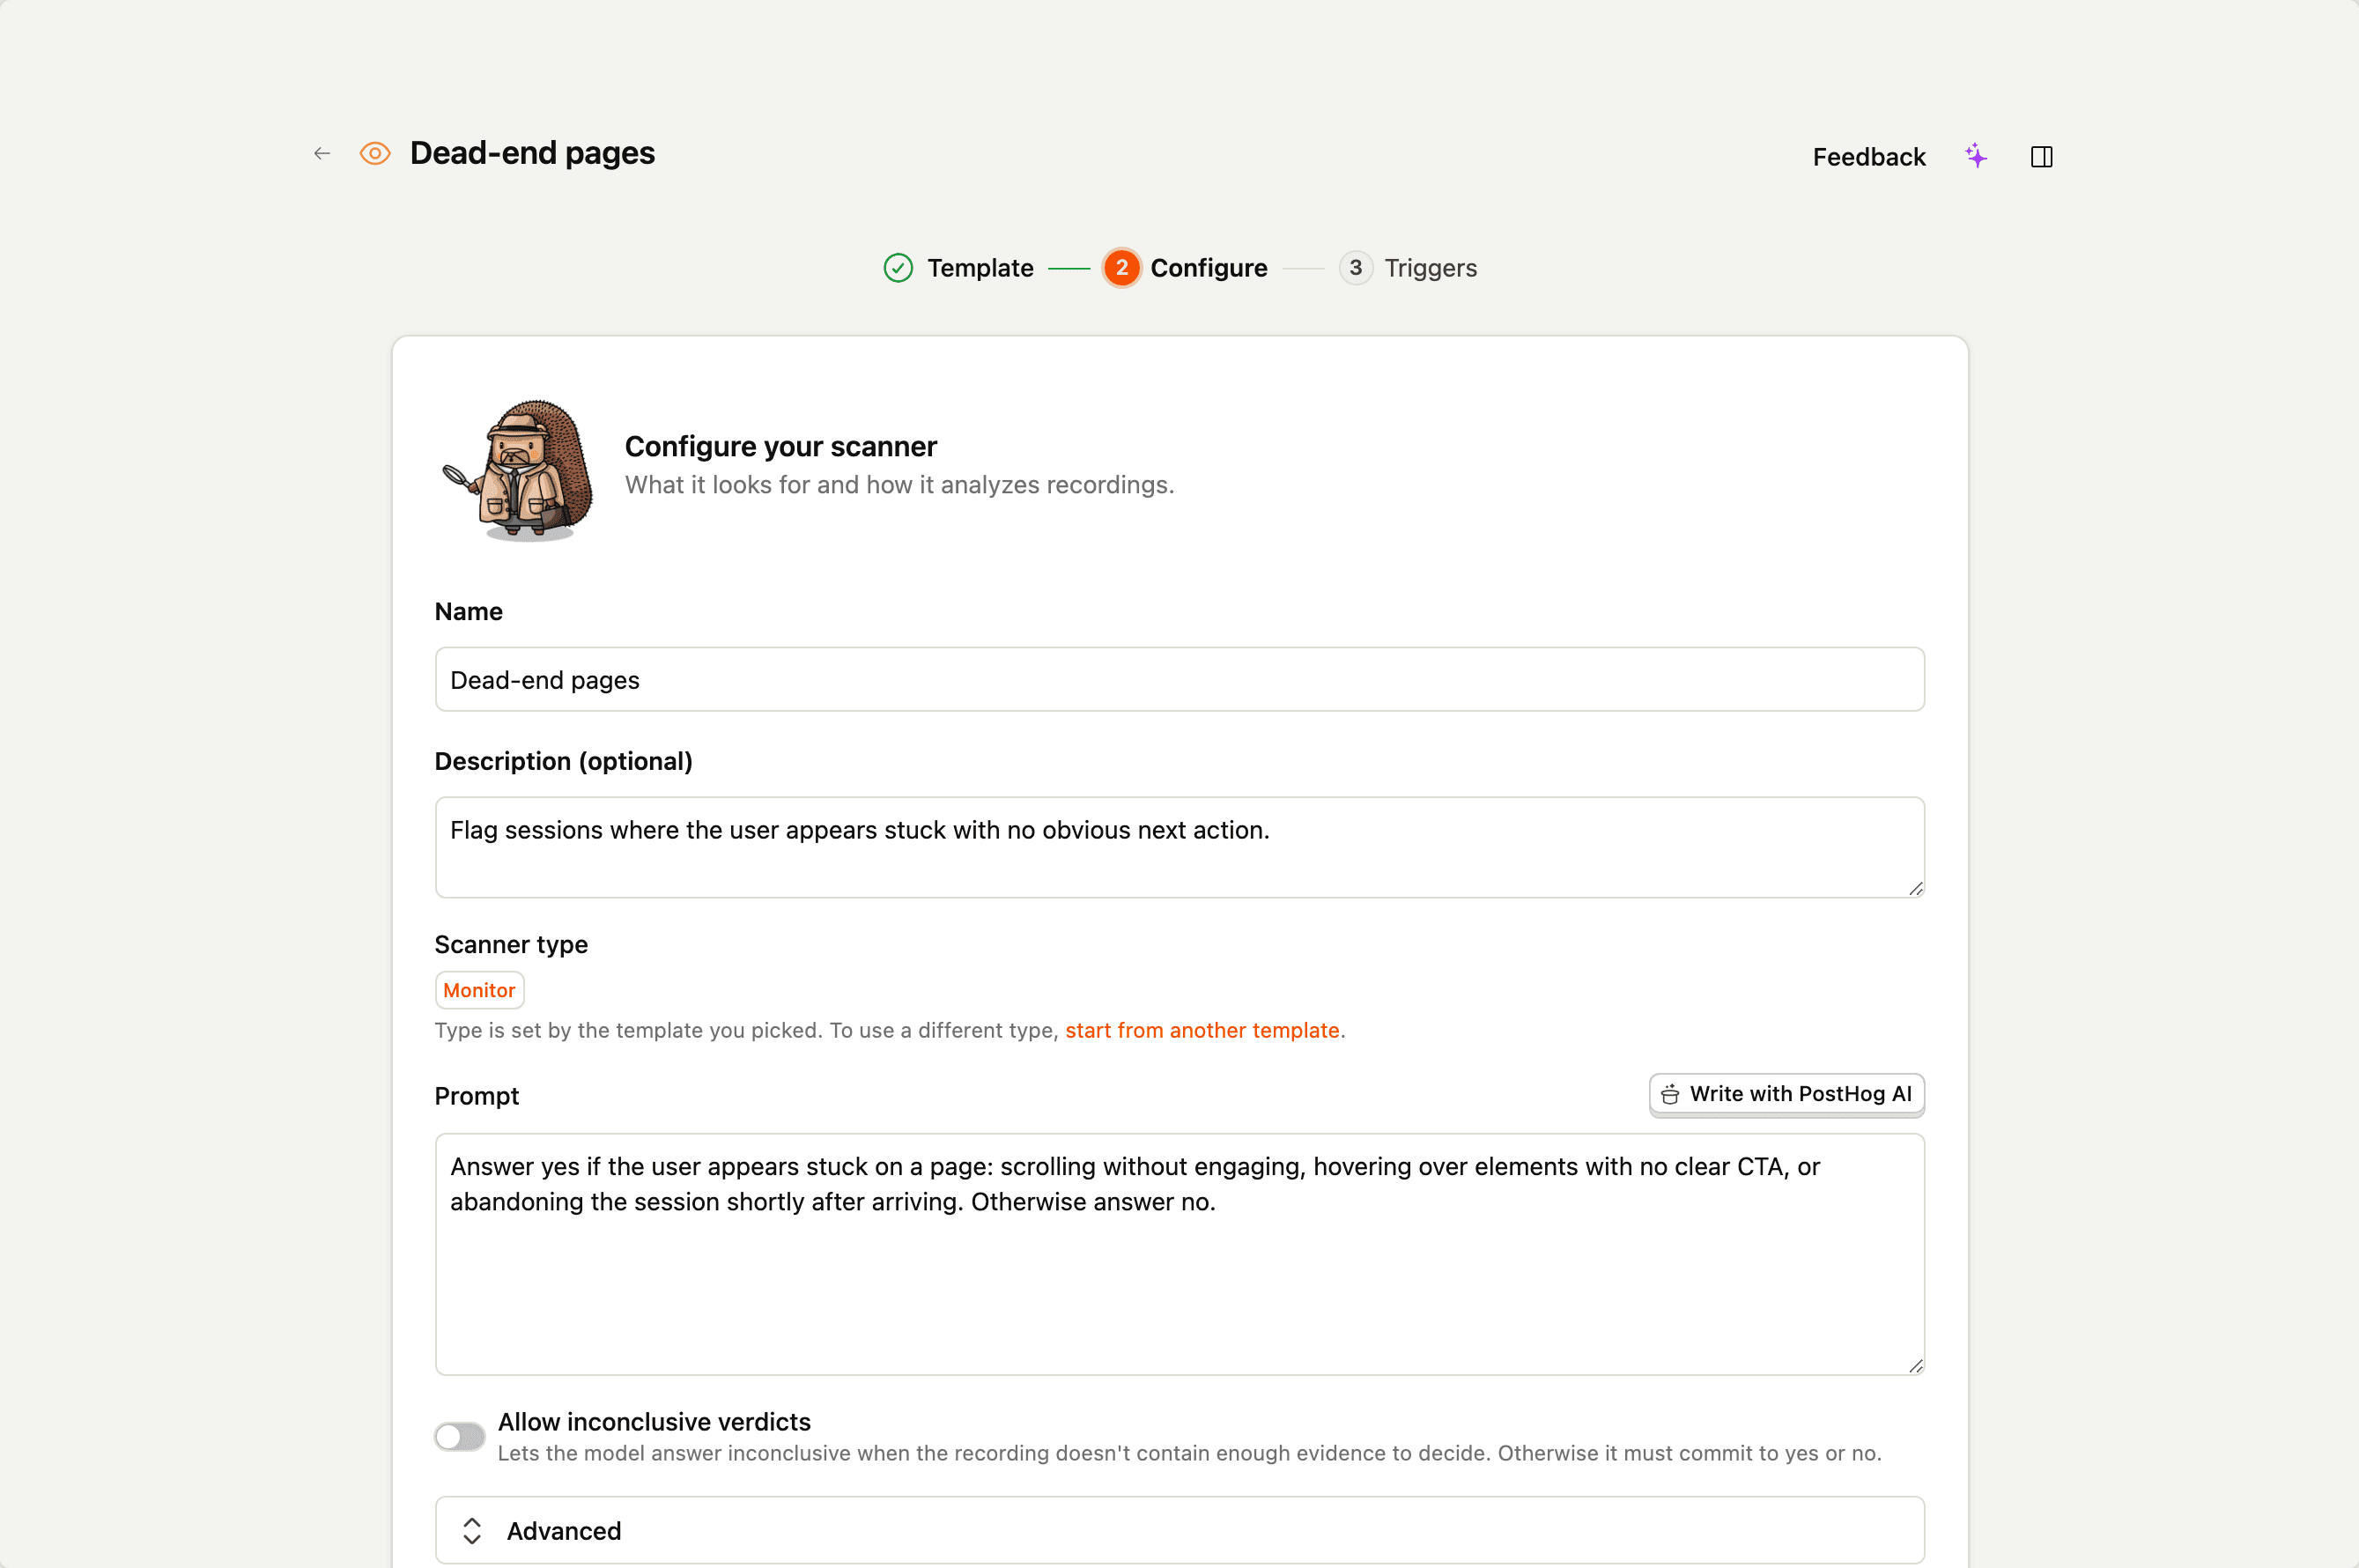
The template arrives with:
- A prompt describing what "stuck" looks like.
- An empty recording filters block – meaning the scanner will match every eligible session in your project.
- A sampling rate of 100% (every matching session gets scanned).
- A model selection (Gemini, with the default flavor pre-chosen).
For a first run, leave the prompt and model alone. To keep volume low while you experiment, narrow the filters – e.g. limit to one URL or to a specific cohort – and drop sampling to something like 10%.
The form shows a projected per-month observation count based on your project's recent recording volume, the filters you set, and the sampling rate. Use that to size against your quota before saving.
3. Save the scanner
Click Save. The scanner is enabled by default and starts sweeping for matching sessions in the background.
For this walkthrough we won't wait for the sweep – we'll trigger one observation by hand against a recording we already know about.
4. Run the scanner on one recording
Open the replay for any session of yours, then use the Scan this recording action on the player.
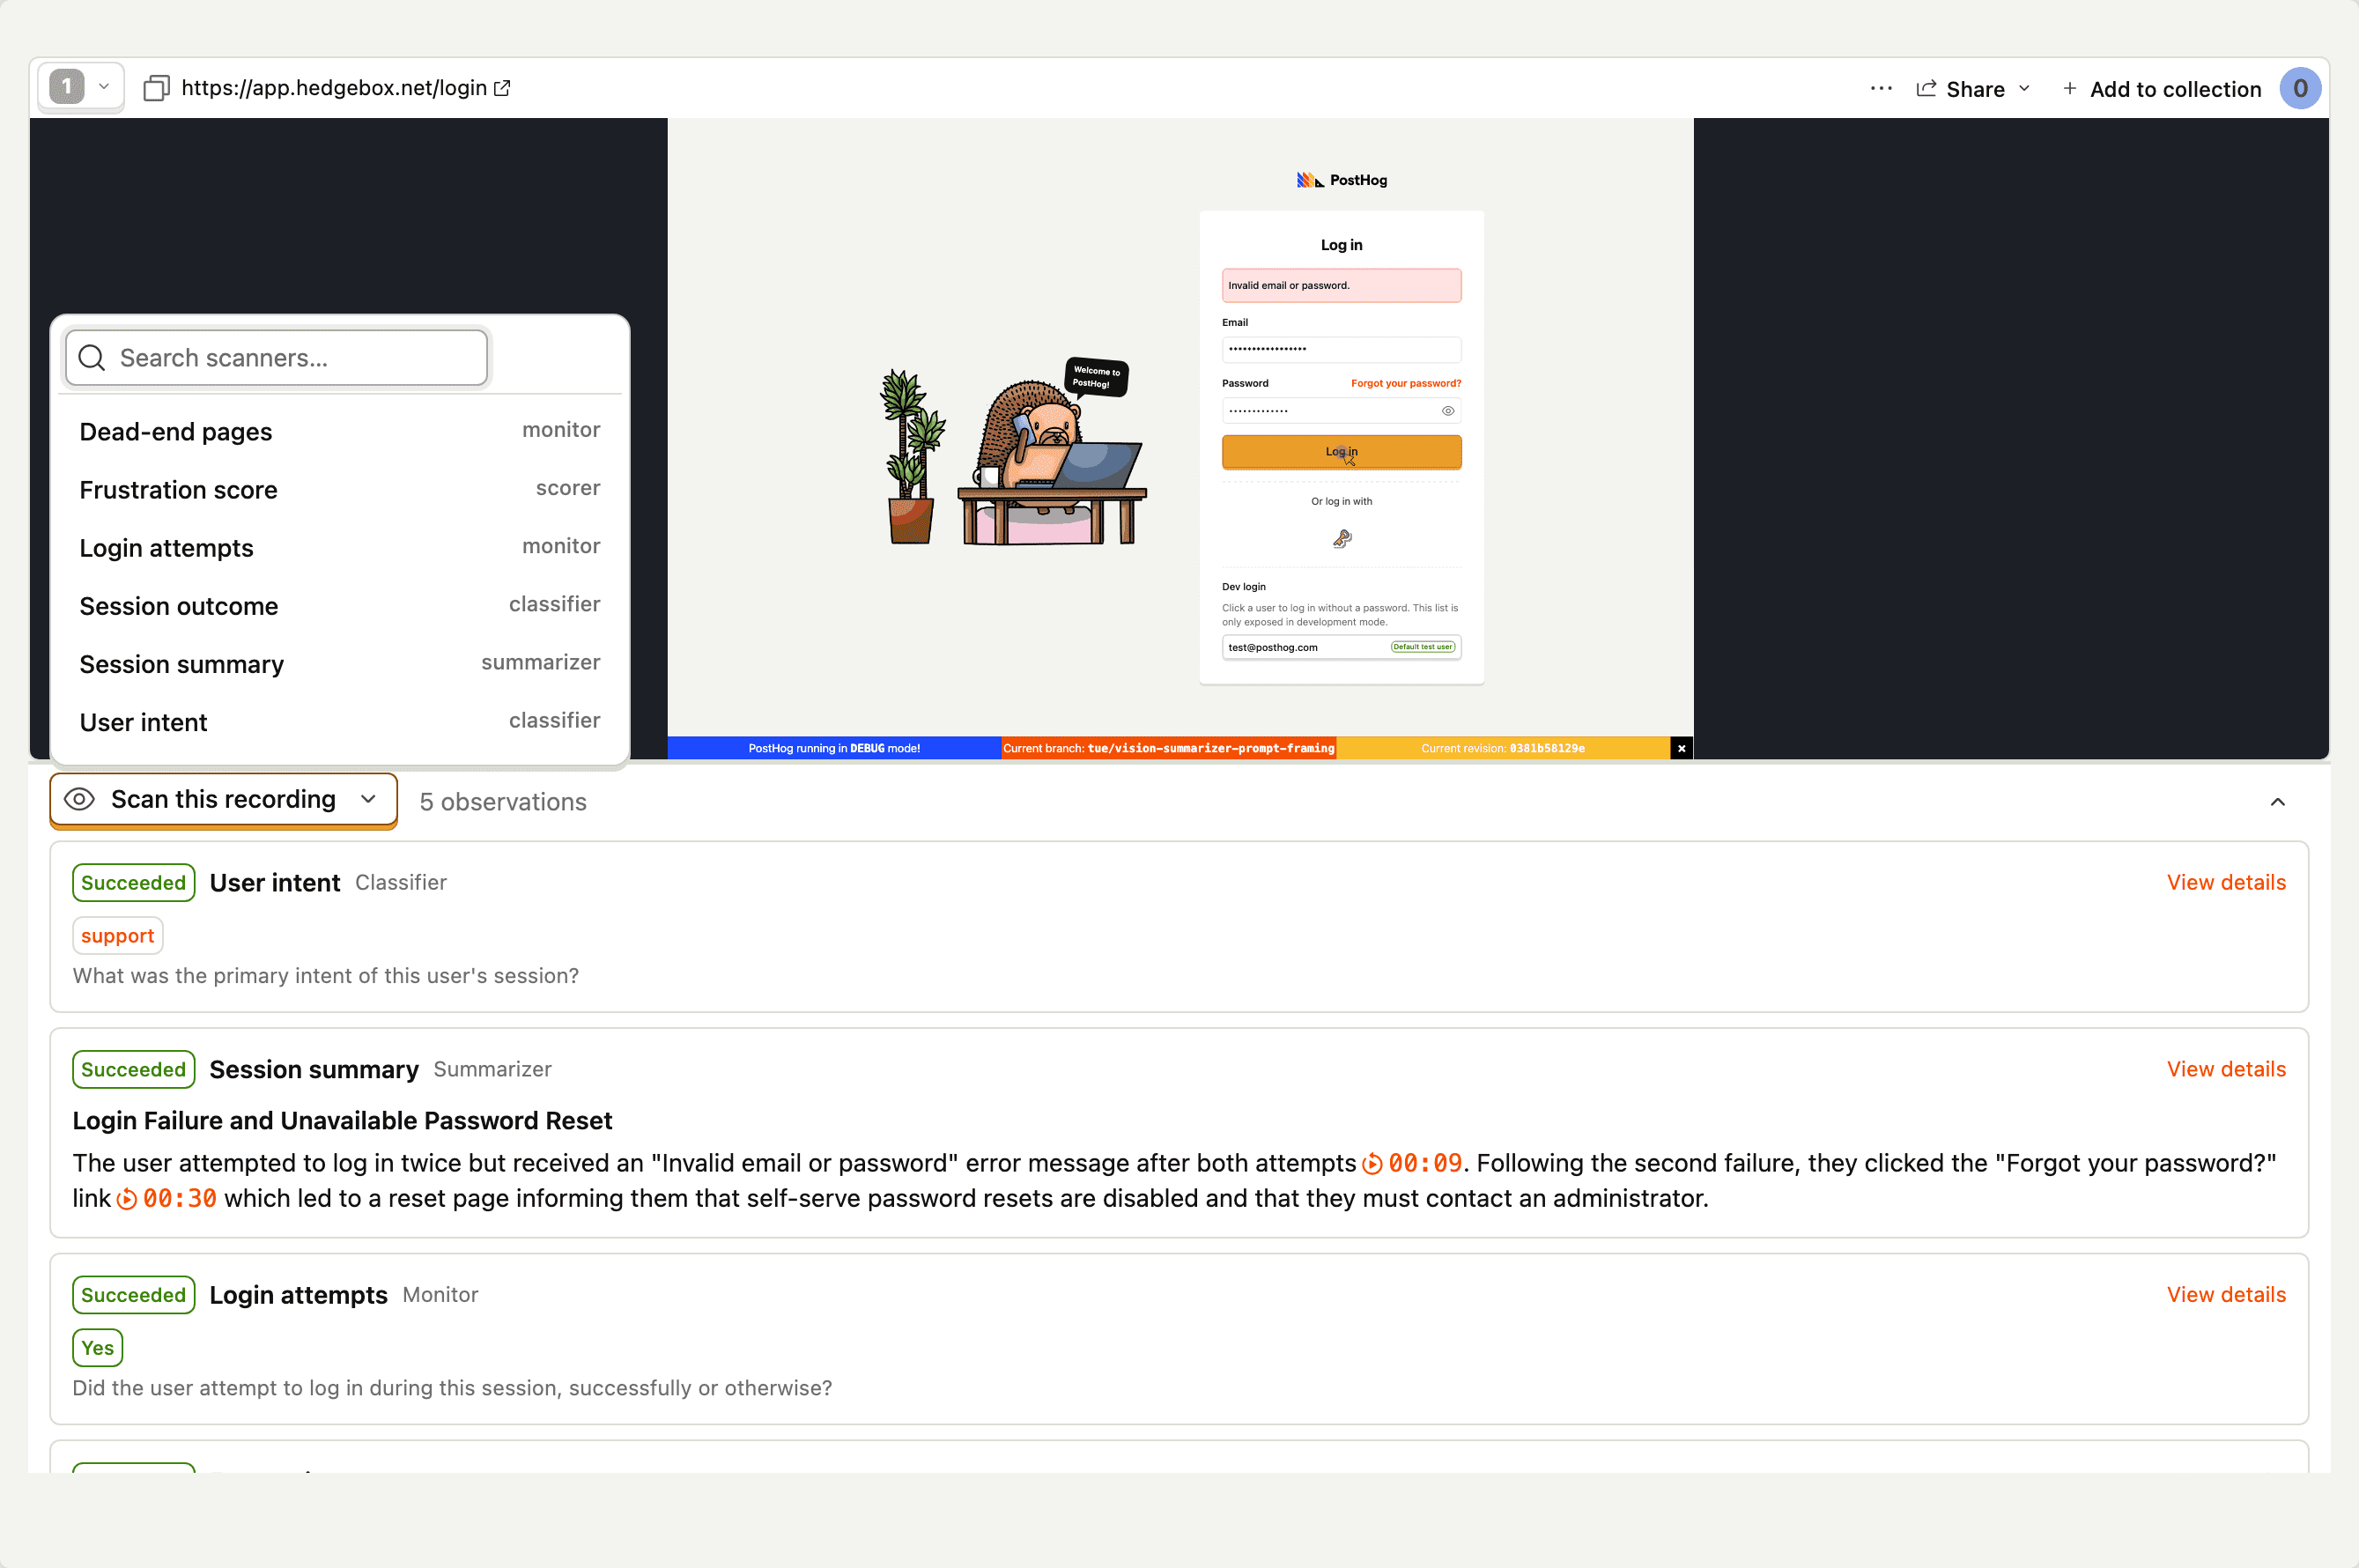
Pick the scanner you just created. PostHog renders the recording, sends it to Gemini, and produces a result. This usually takes a couple of minutes.
You can also run a scanner programmatically – see running scanners for the MCP option.
5. Open the observation
Once it finishes, the observation appears in two places: on the scanner's Observations tab, and in the observations dock at the bottom of the replay player for the recording you scanned. Open the observation to see the structured result.
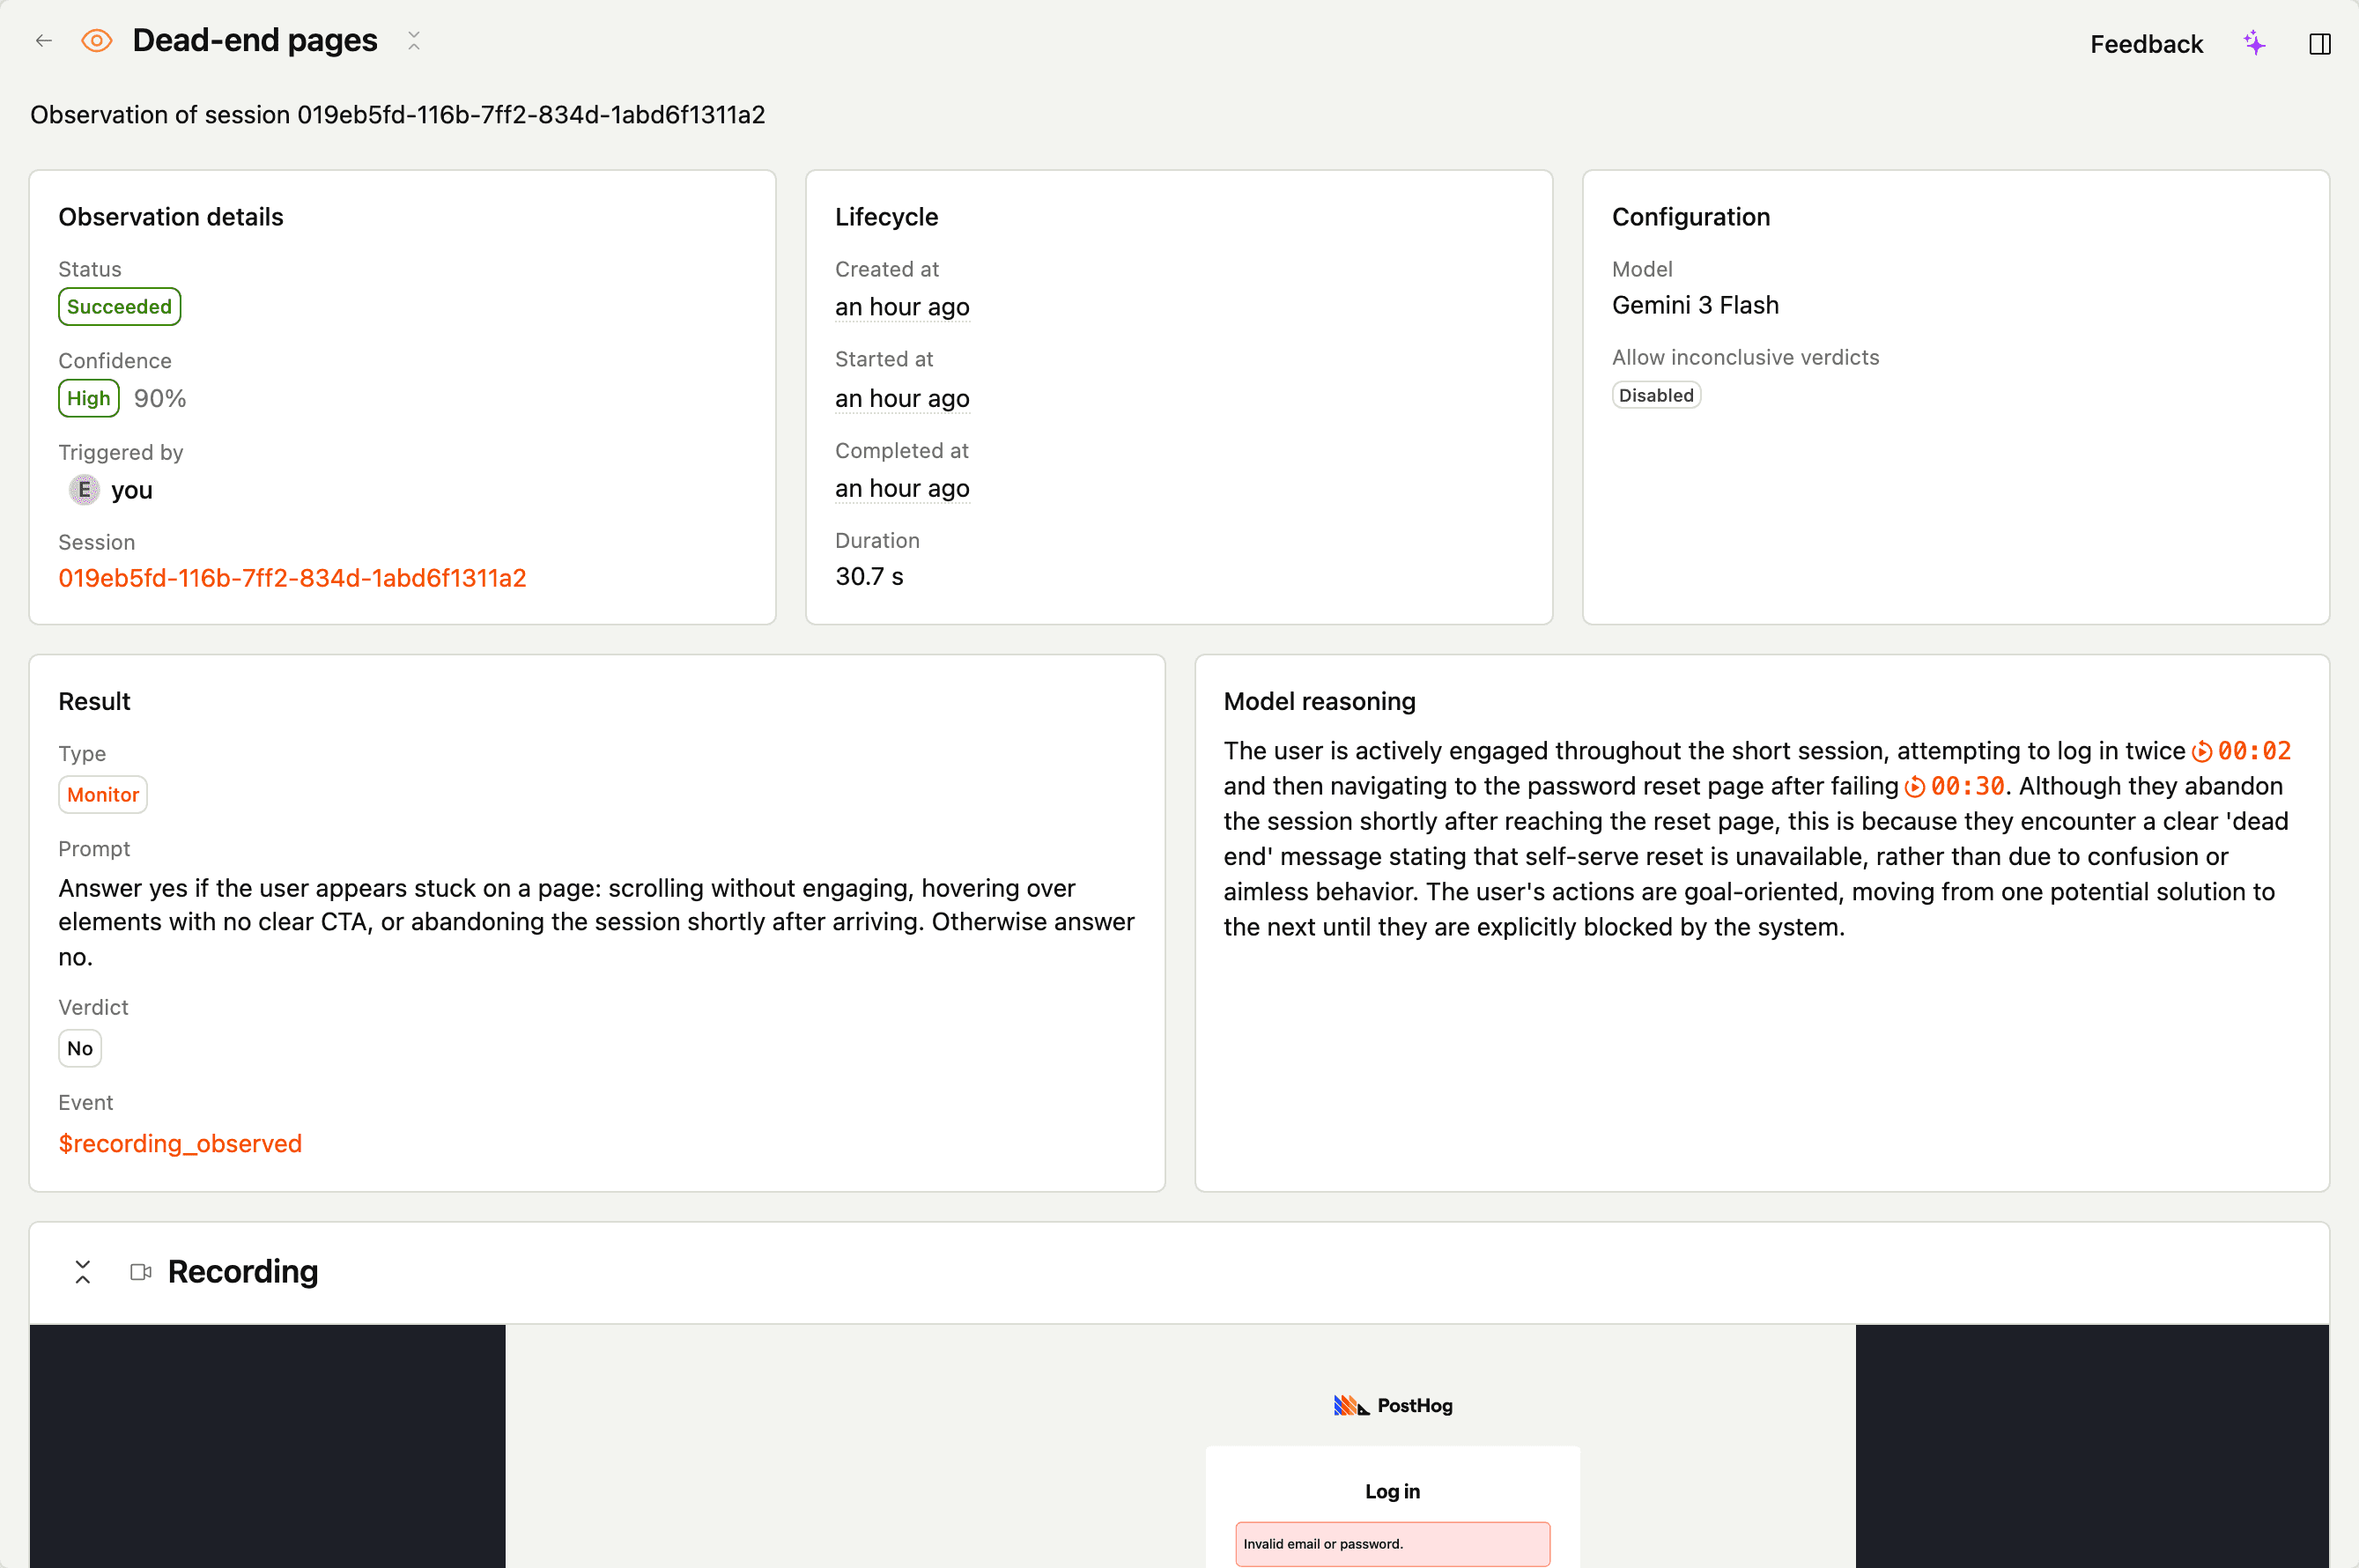
For a monitor scanner you'll see:
- A yes/no verdict with a confidence score.
- The model's reasoning, with clickable citations that jump the embedded player to the relevant moment.
- The prompt that produced this result – the exact text Gemini saw, frozen even if you edit the scanner afterwards.
Spend a minute here. Watching the moments the model cited next to its reasoning is the fastest way to develop intuition for what your prompt actually catches.
6. Query it as an event
Every successful observation is also captured as a $recording_observed event in your project. Open a new SQL insight and run:
You'll see a count over time of sessions the scanner flagged. From here you can chart it, drop it on a dashboard, or wire an alert. See observations for more SQL patterns.
What's next
- Scanner types – understand monitor vs. classifier vs. scorer vs. summarizer before authoring your second one.
- Creating scanners – prompt patterns that actually work, plus how filters and sampling interact.
- Running scanners – automatic background sweeps vs. on-demand triggers, and what happens to ineligible sessions.