


How to fix your app onboarding drop-off points

Contents
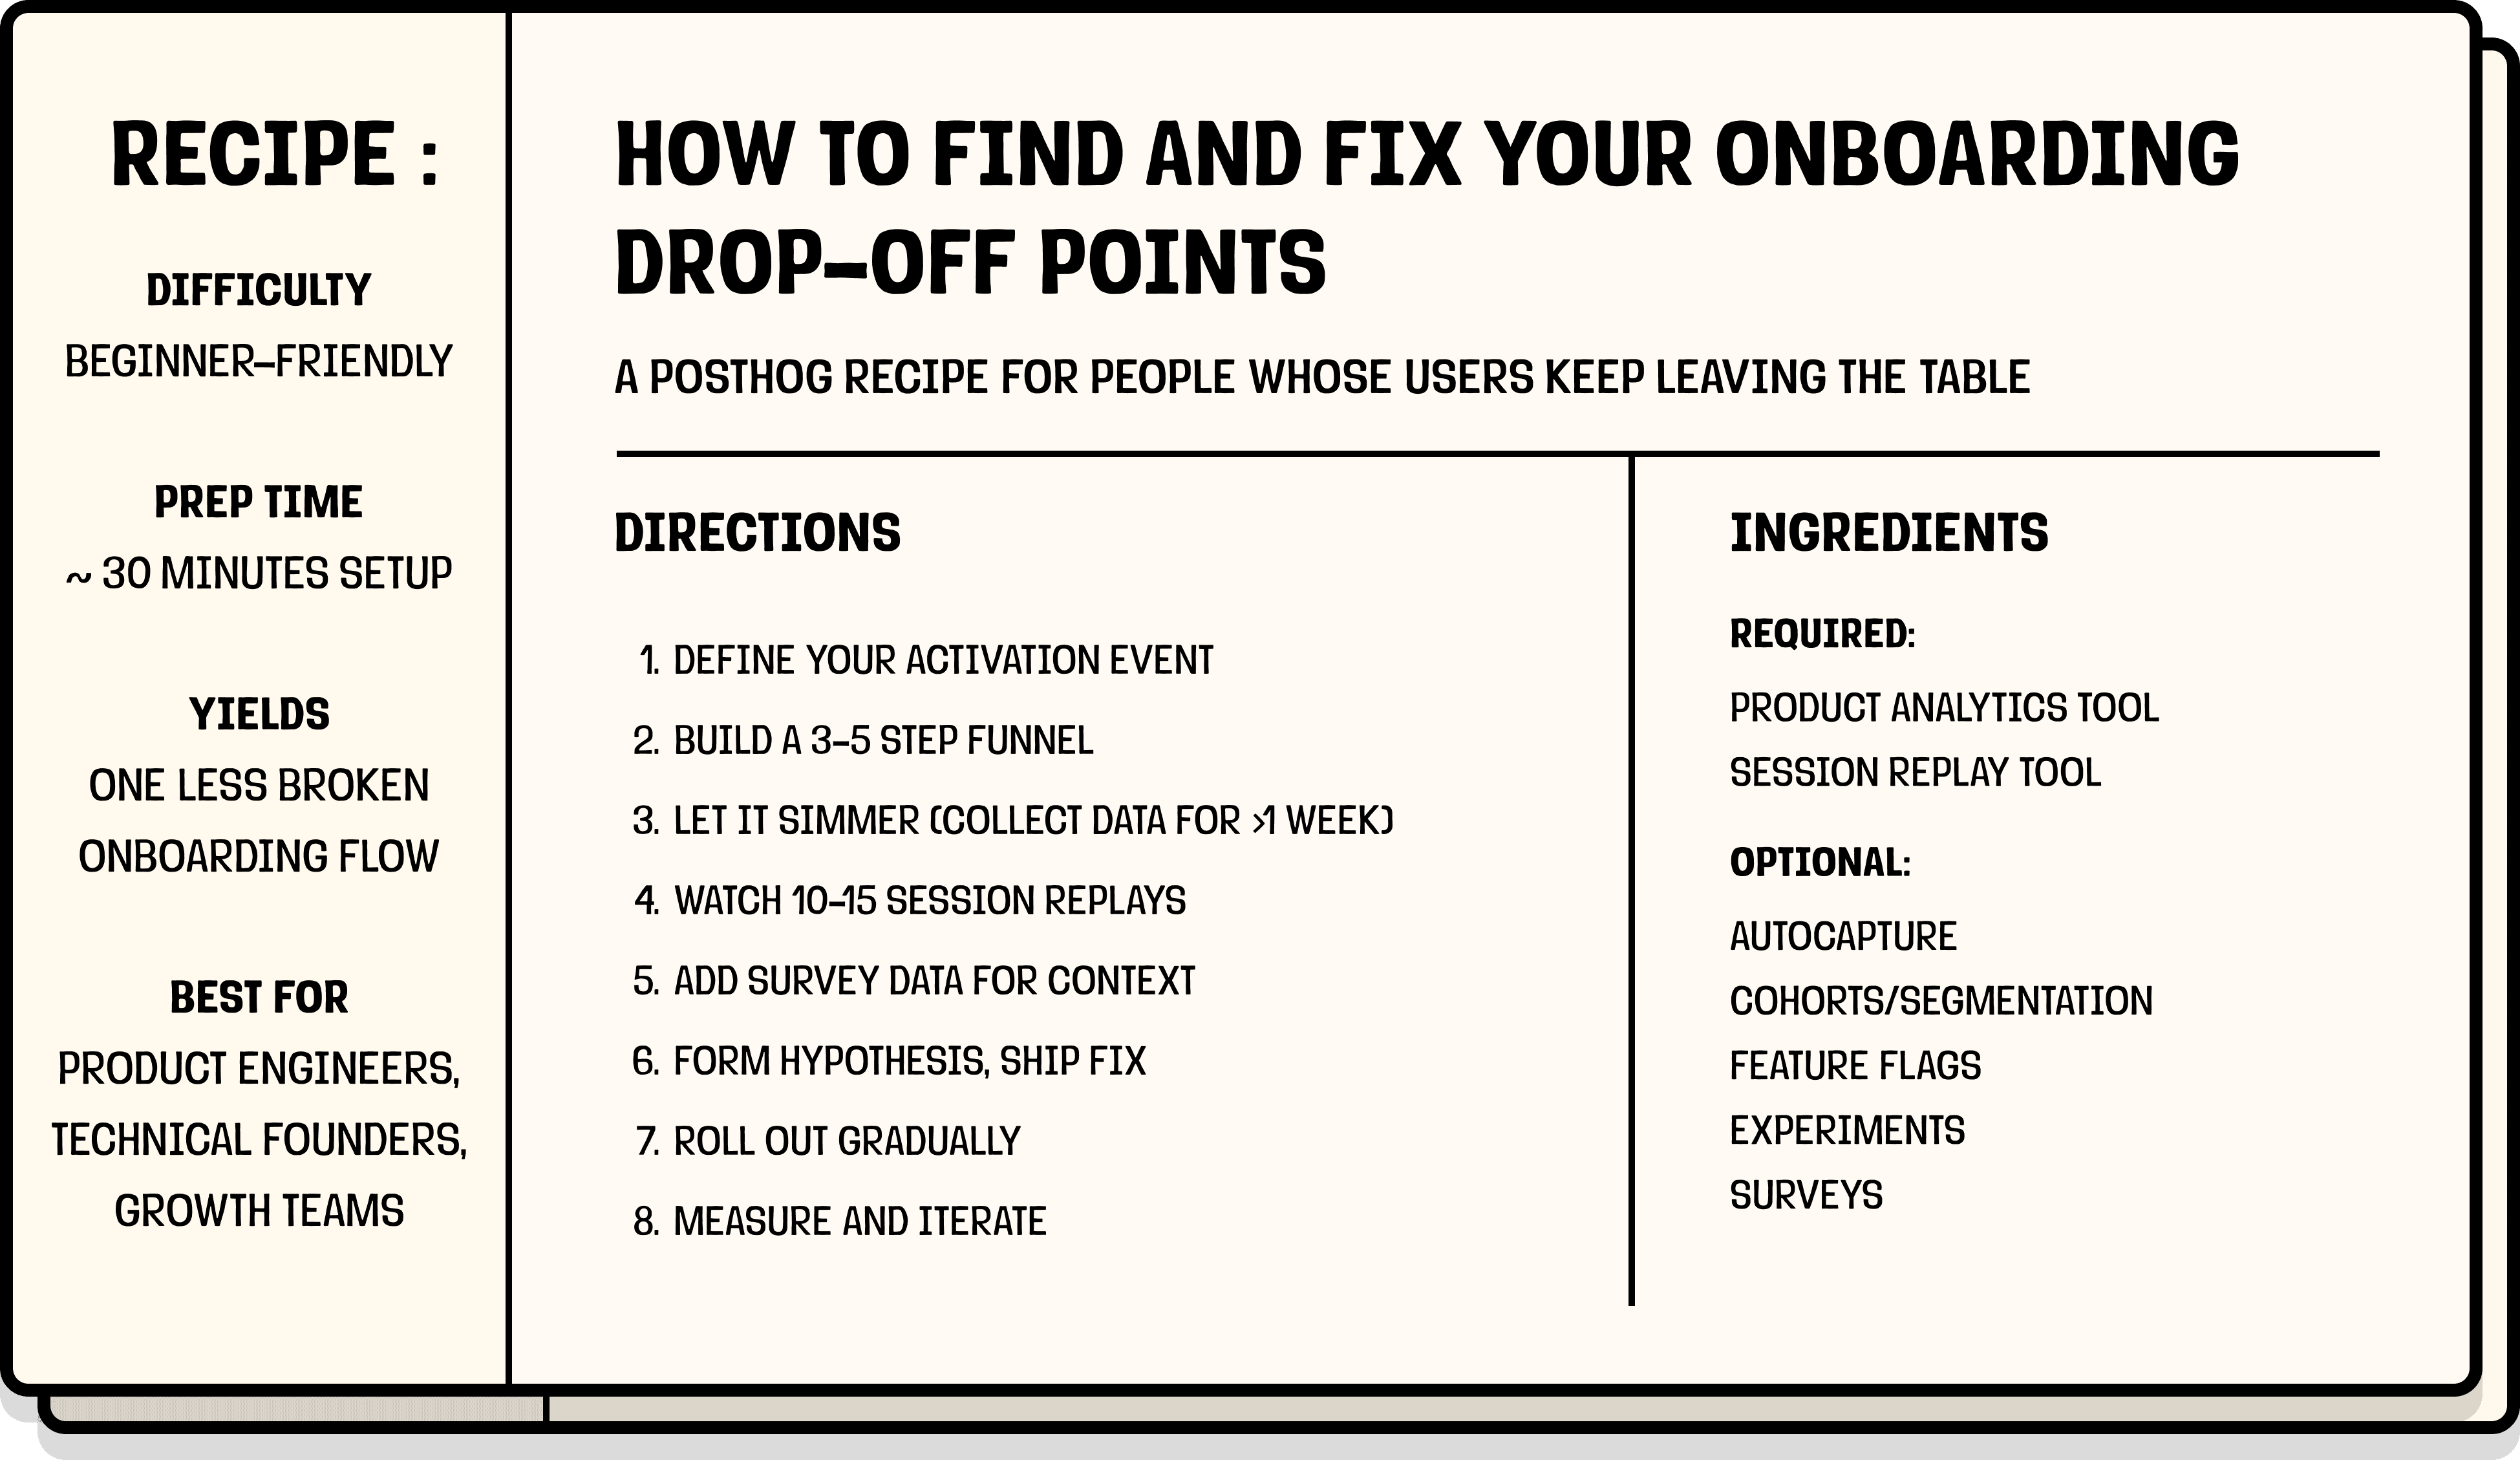
A PostHog recipe for people whose users keep leaving the table.
| Prep time | ~30 minutes setup, ~1 week of data |
| Difficulty | Beginner-friendly |
| Yields | One less broken onboarding flow |
| Best for | Product engineers, technical founders, growth teams |
| Outcome | Better onboarding conversion boosts all downstream metrics from activation to retention to revenue. |
Seeing your onboarding stats drop or stall can be discouraging, but here's the good news: it doesn't mean your product sucks (phew!)
Onboarding drop-offs are usually an indication of friction, not rejection. Users don't rage-quit because they hate your product, they quit because something didn't make sense, didn't work, or asked for too much too soon.
It's like attempting a beef wellington, realizing you're in over your head somewhere around the "wrap the beef in mushroom duxelles" step, and bailing to order pizza instead. Ask me how I know.
Even better news: onboarding friction is measurable, debuggable, and fixable.
What you'll need
Ingredients
You don't need a massive stack for this recipe.
Required:
Optional, but recommended:
Substitutions
No session replay tool? You can interview users directly instead, but you'll be relying on their memory of what happened rather than what actually happened. It works, it's just slower and less reliable. Here's our guide to running effective user interviews if you go this route.
No surveys? It's okay, replays will get you 80% of the way there; the other 20% is context you'll have to infer.
No feature flags? You can ship straight to production. We won't judge. (...we will judge a little.) If something breaks, you'll just have to roll back manually. Here's why we think feature flags are worth it.
No cohorts or segmentation? You can still run this recipe, you'll just be looking at all users as one group. If your drop-off is consistent across everyone, that's fine. If it's not, you'll have a harder time figuring out who's actually struggling.
You'll also need:
- A clear definition of what "successful onboarding" looks like. This is your activation event – the moment a user has gotten enough value to stick around (more on this below).
- Events firing & at least a few hundred users going through your flow. You need enough data to spot patterns. If you're at an earlier stage, you can still follow this recipe; just watch more replays and lean harder on qualitative signals until your numbers catch up.
Want to cook with PostHog? Great choice.
If you haven't set it up yet, start here. Make sure you're capturing the key events in your onboarding flow (signups, form completions, button clicks, etc.). If you have autocapture enabled, you're probably already covered.
We highly recommend calling posthog.identify() when users sign up or log in; you'll be able to track them across sessions and devices, which makes your funnel data much more reliable.
Step 1: Prep the finish line
Before you can fix your onboarding, you need to define what a successful onboarding flow actually means. This is your activation event, the foundation of your activation metrics and the thing you'll measure everything against.
Ask yourself: What's the moment when a user has gotten enough value that they're likely to stick around? What you're looking for is a value-producing action.
Some examples:
- For an e-commerce app: Added item to cart and completed checkout
- For a streaming service: Watched their first video or listened to their first song
- For a project management tool: Created their first project and invited a teammate
- For a fintech app: Linked their bank account or made their first transaction
- For a social app: Followed their first account or posted their first content
- For an analytics product: Sent their first event and created an insight
- For a CRM: Added their first contact and sent an email
Not sure what yours is? Try looking at your retention data – what do retained users do that churned users don't? That should give you a starting point.
Here's how we figured out our activation metric at PostHog (spoiler: it took a few iterations).
Pick one. Be opinionated. You can always adjust later.
👨🍳 Chef's tip
Don't confuse the appetizer for the main course; signing up or landing on a dashboard aren't meaningful enough steps to be considered product activations, for example. Also, your activation event might change over time – what predicted retention two years ago might not be the best signal today, so revisit it if needed.You can complete the sentence: "A user has successfully onboarded when they ____."
Step 2: Build a funnel
Now you're ready to cook.
In your analytics tool, create a funnel with the steps a user must complete to reach your activation event.
A simple example:
$pageviewon/signup/success(or a customsigned_upevent)profile_completedfirst_project_createdteammate_invited(the last step is your activation event)
A few tips:
- Start with 3-5 steps max. Too many steps and you'll have trouble identifying the real problem areas.
- Use sequential order (the default) so users must complete steps in the order you've defined.
- Set a reasonable conversion window (7 to 14 days is a good starting point).
If using PostHog:
Head to Product Analytics → New insight → Funnel. If you have autocapture enabled, many of these events may already be tracked for you; check your activity to see what's coming in.
👨🍳 Chef's tip
Start with your core flow. Once it's optimized, create separate funnels for specific segments. Don't forget to name your funnel something specific (e.g., "Self-serve onboarding Q1 2025") so future-you knows what it's measuring when you have 47 funnels.Your funnel is prepped, ending with your activation event, saved, and ready to collect data.
Step 3: Let it simmer
Save your funnel and let data collect for at least a week. You need enough users going through the flow to see meaningful patterns; looking too early is how you end up "fixing" problems that don't exist.
As a rough guideline:
- A few hundred users entering onboarding is usually enough to start
- More is better if you plan to segment by user type or device later
While you wait, you can:
- Set up session replay, if you haven't already
- Prep an exit survey for later (we'll use it in Step 6)
👨🍳 Chef's tip
Resist the urge to peek daily. Set a calendar reminder for one week out – watching the pot won't make it boil faster.Your data has had time to marinate – at least a few hundred users through the funnel with clear conversion rates at each step. Undercooked data leads to undercooked fixes.
Step 4: Find the leak
Now that your funnel is showing you where users are falling off, look for:
- The step with the lowest relative conversion rate – this is usually your biggest opportunity
- Absolute numbers – sometimes a step has decent conversion but is still losing you thousands of users
If everyone drops off at the same step, it's probably a UX problem. Something about that step is broken or confusing for all users.
If only some users drop off, it's a context problem. Something about who they are or how they got there is causing friction.
If it's a context problem, try segmenting your funnel to find a clearer diagnosis:
- New users vs. returning users
- Invited users vs. self-serve signups
- Browser, device, or OS
- Plan type or pricing tier
If using PostHog:
Click on the drop-off number in your funnel to see the actual users who didn't make it. Use breakdowns to slice your funnel by user properties, device, or any event property. If you have many steps or breakdown values, you can also sort for poor performers in terms of number of conversions, conversion percentage, and even time in the Detailed results section.
👨🍳 Chef's tip
You can export your cohort of dropped-off users and use it to target them with win-back marketing campaigns or surveys later.You're able to say: "Users drop off most at [this step]" and "It affects [these users] more than others." If you can't say both, don't move on yet.
Step 5: Watch the replays
You know where users drop off, now you need to find out why.
Watch 10–15 recordings. You're looking for patterns:
- Are users getting confused at a specific UI element?
- Are they rage-clicking something that doesn't work?
- Are they abandoning after seeing a specific screen (pricing, permissions request, etc.)?
- Are they hitting errors? (Check the console logs in the replay; PostHog captures these too.)
- Is something failing quietly? Look at network requests if you have network recording enabled.
If recordings are looking wildly different from one user to the next, go back to Step 4 and segment further; you're probably mixing multiple problems together.
If using PostHog:
Fastest way: Click directly on the drop-off in your funnel – PostHog will pull up recordings for those users automatically. (This is one of the nice things about having replay and analytics in one tool!)
Manual way: In Session Replay, click Show filters → Filter for events or actions → select the last event users completed before dropping off. See our session replay filtering guide for more.
If you saved a cohort in Step 4, you can filter replays by that cohort directly.
👨🍳 Chef's tip
Don't just watch drop-offs. Sometimes successful users struggled through the same friction – they just pushed through anyway. Watch both to taste the difference.You're able to say "Users drop off here because [this thing] keeps happening."
Step 6: Fold in survey data (optional, but recommended)
This step isn't required, but it can be the difference between a good fix and the right fix.
Exit survey (for users who drop off)
Trigger this when users are about to abandon your onboarding flow:
- Question: "What's stopping you from finishing setup?" (open text)
- Display conditions: Show on your onboarding URL + after 30–60 seconds of inactivity, or on exit intent
You likely won't get a ton of responses, but the ones you do get can be really useful signals.
Completion survey (for users who made it)
Survey users who did complete onboarding to understand what almost stopped them:
- "What was the hardest part of getting started?"
- "What, if anything, almost made you give up?"
Trigger this right after your activation event fires; they'll remember while it's fresh.
If using PostHog:
Go to Surveys → New survey.
You can set display conditions based on URL, user properties, or events. For the completion survey, trigger it when your activation event fires.
👨🍳 Chef's tip
Keep surveys short. One or two open-ended questions max. Users will give you more when you ask for less. Also, remember survey responses are seasoning, not the main dish; it's okay to just have a handful of responses. A few strong signals beat hundreds of vague ones.You've seasoned your data with user feedback that confirms, refines, or challenges what you saw in replays.
Step 7: Form a hypothesis and ship a fix
By now you should have:
- Quantitative data on where users drop off (funnel)
- Behavioral data on what they were doing (replays)
- Direct feedback on what they were thinking (surveys)
Mix these into a hypothesis: "[These] Users are dropping off at [step] because [reason]."
Some common fixes:
- Simplify your flow – reduce fields, remove friction, break it into smaller steps, make a required field optional
- Add guidance – tooltips, progress indicators, inline help
- Squash any bugs – if replays showed errors, fix them
- Reorder the flow – maybe you're asking for too much too soon
👨🍳 Chef's tip
One ingredient at a time. If you change five things at once, you won't know what fixed it (or broke it). Also, write down your hypothesis before you ship. It's easy to retrofit a narrative after you see results – having it on record keeps you honest.You've got one fix in the oven, designed to address your hypothesis.
Step 8: Taste before serving (optional, but recommended)
Whatever the change, don't dump it straight into production, roll it out gradually if you can using feature flags.
Feature flags let you:
- Release to 10–20% of users first, then ramp up
- Target specific user segments (e.g., new users only)
- Kill the change instantly if something goes wrong
Want statistical proof it worked? Run an A/B experiment. This is optional, not every fix needs one. But it's worth it when:
- The change is significant (like a full flow redesign)
- You're debating between multiple solutions
- You need to convince stakeholders with data
While step isn't mandatory, it helps avoid "we think this worked" decisions.
If using PostHog:
Use feature flags to roll out your fix to a percentage of users first.
To run an experiment, go to Experiments → New experiment. Use your feature flag as the basis – PostHog will split users into control and test groups and track your funnel as the goal metric.
👨🍳 Chef's tip
If you're nervous about a big change, start at 5% rollout. You can always ramp up, but you can't un-serve a burnt dish. Also, not every fix needs a full experiment – but if it's a big change, or you need to convince stakeholders, statistical proof is worth the extra time.Your fix is out of the kitchen, live (ideally behind a feature flag) and collecting data.
Step 9: Measure the improvement
After your fix has been live for a bit:
- Go back to your funnel
- Compare conversion rates before and after your change (most analytics tools let you view trends over time)
- Watch a few new replays to confirm the friction is gone
Things to check:
- Did funnel completion improve?
- Did drop-off move to a different step?
- Do replays show smoother behavior?
If using PostHog:
Set your funnel's Graph type to Historical trends to see conversion over time.
If you used a feature flag or experiment, check the results in Experiments to see the impact with statistical significance. For another perspective on your funnel, you can also break it by whether that feature flag was enabled for that user.
👨🍳 Chef's tip
Screenshot your before/after funnels. They make great artifacts for retros, stakeholder updates, and convincing your team that this stuff actually works.You can see a lift in activation rates after deploying your fix.
If it didn't work as expected, that's okay. Go back to Step 4 with a new hypothesis. Onboarding optimization is iterative, you're rarely done after one fix.
Why this recipe works especially well with PostHog
Most teams piece this workflow together across 3–4 different tools: analytics in one place, replays in another, surveys or feature flags somewhere else. It works, but it's slow and you lose context switching between tabs.
With PostHog, everything's connected in one place:
- Funnels show you where users drop off
- Breakdowns show you who's struggling
- Session replay shows you why
- Surveys tell you what users were thinking
- Feature flags let you ship fixes safely
- Experiments confirm whether the fix actually worked
Get started free with 1M events, 5K recordings, and 1M feature flag requests free every month!
FAQ
What is product activation?
Product activation is the moment a user experiences enough value to stick around. It's the bridge between signing up and becoming an engaged user, and it's one of the most important metrics for product-led growth.
The key product activation metrics to keep an eye out for are activation rate (% of signups who activate), time to activate (how long it takes), and onboarding completion rate (% who finish your onboarding flow). Track all three to get the full picture.
What's the difference between app onboarding and product activation?
Onboarding is the flow — the steps you guide users through. Activation is the outcome — the moment they get value. Good onboarding leads to activation, but they're not the same thing.
What is onboarding drop-off?
Onboarding drop-off is when users start your onboarding flow but leave before completing it. They signed up and showed intent, but never reached the point where they experienced real value from your product (your activation event).
Onboarding drop-off is not the same as churn – these users never really started using your product in the first place.
What's the difference between onboarding drop-off and churn?
Onboarding drop-off happens before users get value. They never activate.
Churn happens after activation. Users got value, used the product for some time, and then stopped.
Drop-off is usually caused by UX friction or broken flows. Churn is more often driven by value, habit, pricing, or competition.
What causes users to drop off during onboarding?
The most common causes are:
- Asking for too much information too soon
- Confusing or unclear UI
- Unclear next steps or lack of guidance
- Broken flows, errors, or silent failures
- Required steps that don't feel required
- Onboarding that takes too long to complete
What's a good onboarding completion rate?
There's no universal benchmark.
For self-serve SaaS, 20–40% onboarding completion is common. Higher-touch products with sales involvement often see higher rates.
More important than benchmarks is tracking your own completion rate over time and improving it incrementally.
What's the biggest mistake teams make with onboarding analytics?
Optimizing the wrong metric.
Teams often track signups, pageviews, or dashboard loads instead of the action that actually predicts retention. If your activation event is wrong, everything downstream will be misleading.
How do I reduce onboarding drop-off?
Start by diagnosing the problem.
Identify where users drop off, then look at what actually happens at that step. Fix one thing at a time by simplifying the flow, adding guidance, removing unnecessary fields, fixing bugs, or reordering steps.
Roll out changes gradually so you can measure impact and roll back if needed.
What tools do I need to track and fix onboarding drop-offs?
At a minimum, you need:
- Product analytics to build funnels and see where users drop off
- Session replay to understand what users were doing before they left
You can assemble this with separate tools (for example, analytics, replay, feature flags, and experiments), but that usually means more setup, more context switching, and slower iteration.
Or you can use a unified platform like PostHog to do all of this in one place.
Can I do this without a unified analytics tool?
Yes, but it's harder.
Most teams end up stitching together funnels, replays, surveys, and experiments across multiple tools, which slows analysis and makes it harder to connect cause and effect.
A unified stack makes it much easier to move from “where users drop off” to “why” to “did this fix work?”
Pairs well with
- The AARRR pirate funnel explained
- 10 things we've learned about A/B testing
- How to think like a growth engineer
- What we've learned about talking to users
- 50 things we've learned about building successful products
...hungry for more?

Subscribe to our newsletter
build mode
Read by 75,000+ founders and builders
We'll share your email with Substack
Did you make this recipe?
Share your before-and-after funnel below.
⭐⭐⭐⭐⭐ "Finally fixed our onboarding. Down to only 3 existential crises per quarter." – Actual user, probably
PostHog is the leading platform for building self-driving products. With a full suite of developer tools – AI observability, product analytics, session replay, feature flags, experiments, error tracking, logs, and more – PostHog captures all the context agents need to diagnose problems, uncover opportunities, and ship fixes. A data warehouse and CDP tie it all together, unifying that context into one source agents can read across. You can steer it all from Slack, the web app, the desktop (PostHog Desktop), or your own editor via the MCP.