


Validating what you ship: Did anyone use it? Did it work?

Contents
You shipped. People clapped in Slack. Now what?
This guide helps you define success before you ship, measure it systematically after, and make confident decisions about whether to iterate, promote, or kill what you built.
Why features fail silently
A feature can ship successfully and still fail completely. Without measurement, you won't know until someone asks "how's that feature doing?" three months later.
Without pre-defined success criteria, you end up in one of two traps:
The moving goalpost: You look at the data post-launch and adjust your definition of success to match what happened. "Well, we didn't hit 20% adoption, but 8% is pretty good for a v1."
The infinite iteration loop: You keep tweaking because you're not sure if it's working. Six months later, you're still on "v1.4" of something that should have been killed or promoted months ago.
The fix is simple but requires discipline: write down what success looks like before you ship, then hold yourself to it.
Validation by example
Let's say you're launching a new onboarding flow for your SaaS product.
Before launch, you define success:
- Primary metric: Activation rate (users who complete onboarding AND perform a key action within 7 days)
- Target: Increase from 35% to 45%
- Timeline: Measured 4 weeks post-launch
- Guardrail: Support ticket volume doesn't increase by more than 10%
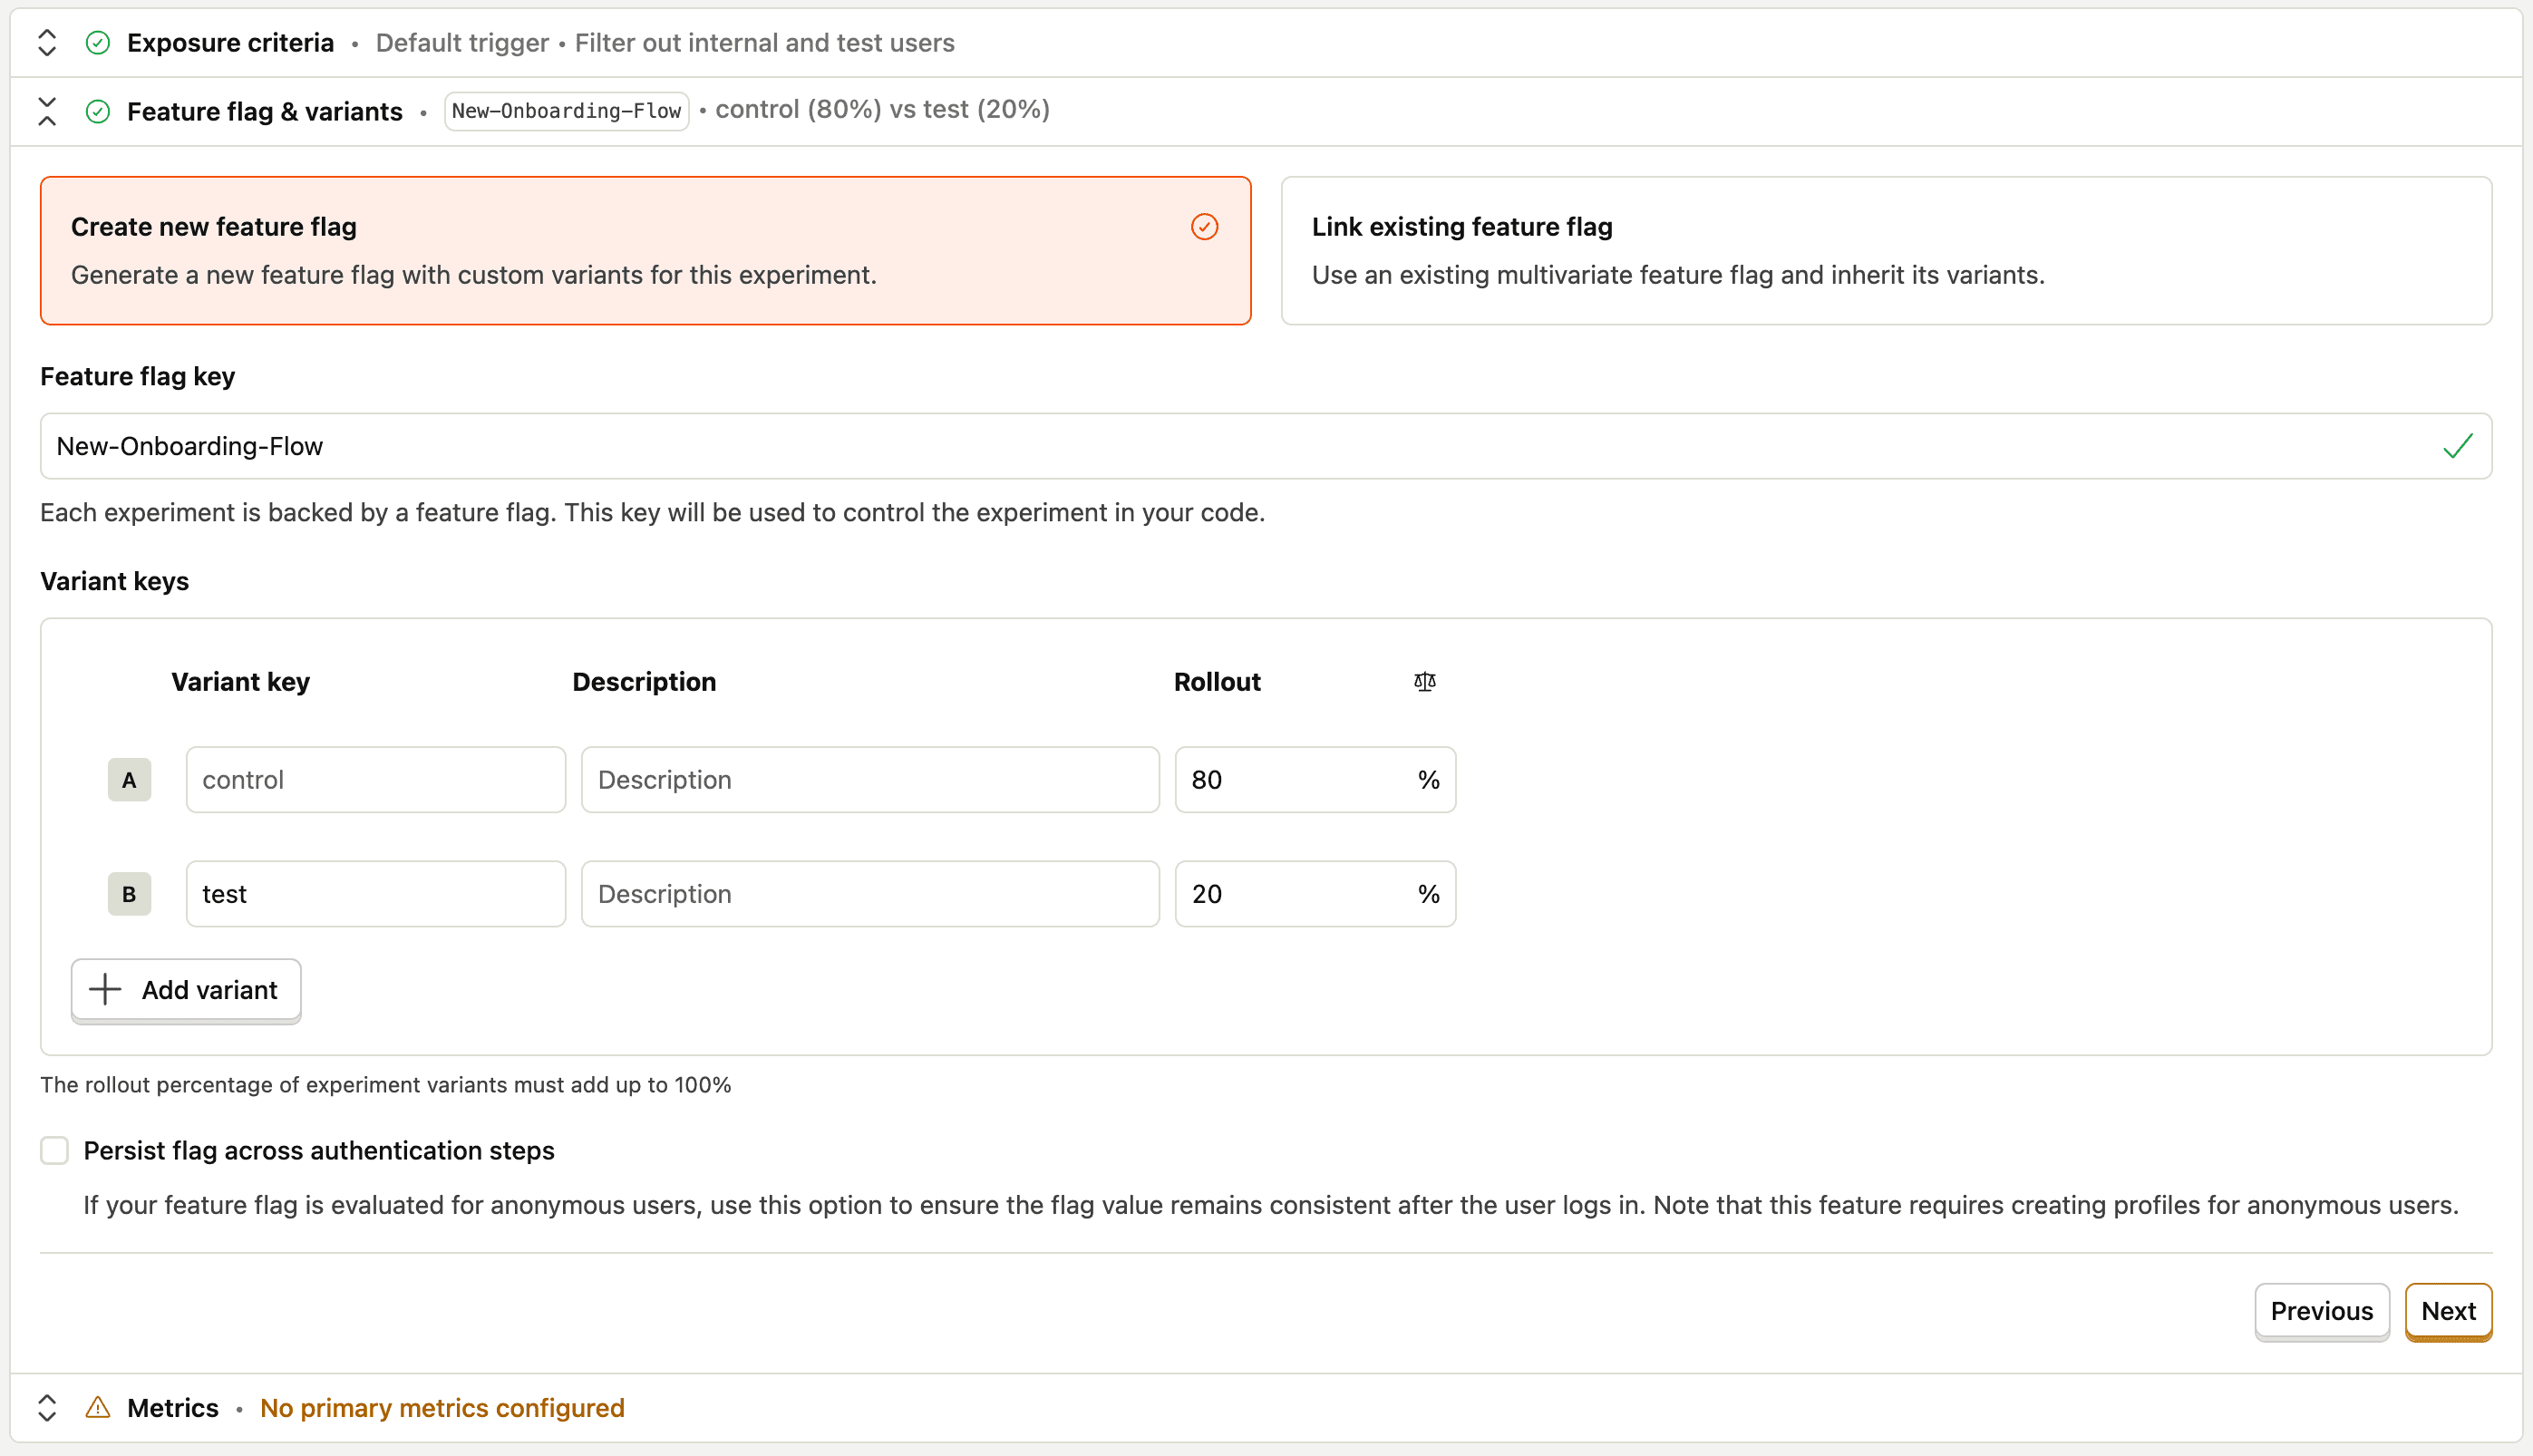
At launch, you ship to a subset of users first. Create a feature flag called new-onboarding-flow and roll it out to 20% of users. This gives you a natural control group for comparison.
Post-launch, the data tells a clear story. Activation rate went from 35% to 41%. Not the 45% you hoped for, but a measurable improvement. You also notice step 3 of onboarding has a 40% drop-off. That's your iteration target.
Without this setup, you'd be guessing. With it, you know exactly what happened and what to do next.
Setting up validation in PostHog
Step 1: Write your hypothesis
Before writing any code, document:
- What are you changing? (Be specific: "New onboarding flow with interactive tutorial")
- What do you expect to happen? ("Users will activate at a higher rate because they understand the product faster")
- How will you measure it? ("Compare activation rate between users who see new flow vs. old flow")
- What's your success threshold? ("10% improvement in activation rate")
- What could go wrong? ("Users might find the tutorial annoying and abandon earlier")
Planning prompt: What could go wrong? Write this down alongside your success condition.
Step 2: Define your metrics
Leading indicators tell you if users are engaging with your change:
| Metric | Example event | What it tells you |
|---|---|---|
| Discovery | onboarding_started | Are users entering the flow? |
| Progress | onboarding_step_completed | Are users moving through it? |
| Completion | onboarding_completed | Are users finishing? |
Tip: When capturing events, include a
step_nameproperty so you can later analyze where users get stuck.
If you need help capturing the necessary events, try our complete guide to event tracking.
Lagging indicators tell you if the change improved outcomes:
| Metric | How to measure | What it tells you | Resources |
|---|---|---|---|
| Activation | Track completion of key actions that indicate value | Whether users are experiencing value, which predicts retention and downstream metrics | Activation and why you should care |
| Retention | Week-over-week return rate | Does this have lasting impact? | Track retention |
| Revenue | Conversion to paid | Did this affect the business? | See Stripe revenue in PostHog |
Guardrail metrics tell you if you broke something:
| Metric | What to watch | Warning threshold | Resources |
|---|---|---|---|
| Support volume | Tickets tagged "onboarding" | >10% increase | See Zendesk data in PostHog |
| Error rate | Errors in onboarding flow | Any increase | Set up error tracking |
| Performance | Load time of onboarding pages | >200ms increase | Web vitals dashboard |
To get notified faster when something breaks, you can set up alerts to monitor these metrics.
Step 3: Create an A/B test for controlled rollout
In PostHog, go to Experiments → New experiment.
Create an experiment that splits users into control and test groups (start with 10-20% in the test group). This creates a natural control group: users in the control group give you a baseline for comparison.
Step 4: Build your dashboard before you ship
Create a new dashboard called "New Onboarding Flow Launch - {Date}". In it, include the following insights:
Onboarding funnel (Funnel insight):
- Step 1:
onboarding_started - Step 2:
onboarding_step_completedwherestep_name = profile_setup - Step 3:
onboarding_step_completedwherestep_name = first_project - Step 4:
onboarding_completed - Filter by feature flag
new-onboarding-flow = true
Completion over time (Trends insight):
- Events:
onboarding_started,onboarding_completed - Compare: Users with feature flag on vs. off
Activation rate (Trends insight):
- Event: Your key activation event (e.g.,
first_project_created,first_invite_sent) - Compare: Users with feature flag on vs. off
- This is your primary success metric
Guardrails (Trends insight):
- Support tickets tagged "onboarding"
- Errors in onboarding flow
- Time to complete onboarding (should decrease, not increase)
Step 5: Set up alerts and qualitative checkpoints
Proactive alerts (Workflows → Slack notification):
- Positive: Alert when a user completes onboarding and activates
- Negative: Alert when support tickets tagged "onboarding" spike
Post-interaction survey (Surveys):
- Trigger: After
onboarding_completed - Question: "How easy was it to get started?" (1-5 rating + optional text)
- Sample: 10-20% of users to avoid survey fatigue
Session replay:
- Create a filter for users where
new-onboarding-flowis true - Watch 5-10 session recordings per week during the launch period
- Look for: Confusion at specific steps, rage clicks, users skipping the tutorial
Reading your results
Give your launch 2-4 weeks before making big decisions. Behavior change takes time.
Week 1: Sanity check
- Is data flowing? (Check that events are firing as expected)
- Any obvious errors? (Check guardrail metrics)
- Is discovery happening? (Users are at least seeing the change)
Week 2-3: Pattern recognition
- Where are users dropping off in the funnel?
- Are leading indicators trending up or flat?
- What are survey responses and session replays telling you?
Week 4: Decision time
Compare your actual results against your pre-defined success criteria.
Healthy signals:
- Onboarding completion rate above 50%
- Activation rate improving week over week
- Guardrail metrics stable
Warning signals:
- Sharp drop-off at a specific onboarding step → UX problem at that step
- Users complete onboarding but don't activate → Onboarding isn't teaching the right things
- Users skip the tutorial entirely → It's too long or seems unnecessary
Deciding what to do next
Based on your data, you have three options:
| Result | Action |
|---|---|
| Hit or exceeded target | Roll out to 100%, document learnings, move on |
| Meaningful improvement but below target | Identify biggest drop-off, make targeted fix, re-measure |
| No improvement or regression | Kill it, run a retro, apply learnings to next attempt |
| Guardrail metrics breached | Roll back immediately, investigate root cause |
Planning prompt: What threshold would make you confident enough to roll out to 100% of users? Write that down before you look at the data.
What success looks like
Here's a checklist of what you should have before you launch:
Common mistakes
Measuring too soon: A launch on Monday doesn't tell you much by Friday. Most behavior change takes 2-4 weeks to stabilize.
Changing the goal: If you didn't hit your target, that's useful information. Retroactively adjusting your success criteria throws away that information.
Ignoring qualitative signals: A 10% conversion rate tells you what's happening. A session replay of a user rage-clicking tells you why.
Skipping the post-mortem: Whether your launch succeeded or failed, document what you learned. Your future self will thank you.
Next steps
With validation in place, you're ready to:
- Run a proper experiment with statistical rigor
- Analyze retention of users who experienced your launch
- Set up deeper survey flows for ongoing feedback collection
- Use session replay to watch how users move through onboarding
PostHog is the leading platform for building self-driving products. With a full suite of developer tools – AI observability, product analytics, session replay, feature flags, experiments, error tracking, logs, and more – PostHog captures all the context agents need to diagnose problems, uncover opportunities, and ship fixes. A data warehouse and CDP tie it all together, unifying that context into one source agents can read across. You can steer it all from Slack, the web app, the desktop (PostHog Code), or your own editor via the MCP.