







6-7 loops we use every day to make PostHog self-driving

Contents
I've mostly given up keeping up with agent trends. Every few months, I ignore all of it and ask what I'm actually getting use out of. Three things always make the list: tools, skills, and loops.
(P.S. – If you're sleeping on the PostHog skills store, you're missing out – almost everything I do each day runs through it).
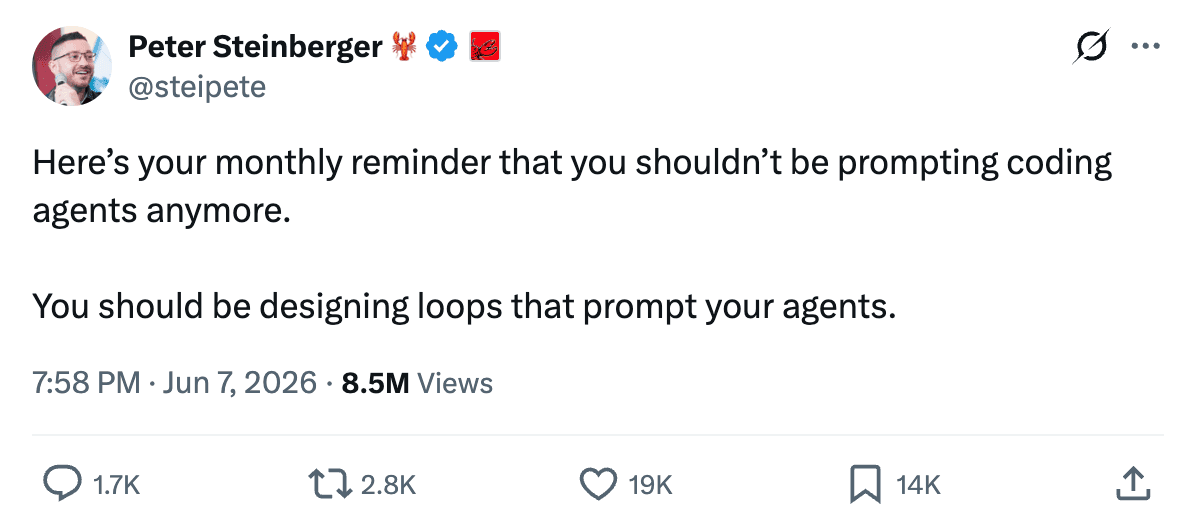
Loops have made the biggest difference in my day-to-day. A good loop, for me, does three jobs:
- Finds things worth looking at. It watches something I care about so I don't have to.
- Takes the boring parts off my plate. The triage, the dedupe, the "is this the same issue as last week?", and – I'm not going to lie to you here – increasingly large chunks of the actual implementation work.
- Keeps me in the loop (sorry). I can read exactly what it did and why, and step in anywhere to steer. I'm on the fence about how long I'll want that, but for now I still like deciding what actually ships.
As part of the self-driving team at PostHog, my job is to build the loops that let you skip the third bit if you want to. Here are 6-7 loops we use on self-driving to, well, build self-driving.
1. The PostHog MCP agent feedback loop
When an agent or human hits friction using the PostHog MCP, they can file structured feedback headlessly, right from the session where it happened using our agent-feedback tool.
That feedback becomes a single event stream, mcp feedback submitted. Instead of making a human manually review these feedback snippets, we added a signals-scout-agent-feedback scout that:
- Groups negative and blocked (
task_completed=false) submissions into per-type friction themes, anchored on many reports converging on the same problem. - Routes each theme to its owner: MCP, a product area, docs, or the signals team itself.
- Corroborates MCP themes against actual
mcp_tool_callerror rates before speaking up. - When something's above a confidence bar, it authors a report into the inbox.
- A PostHog task can then pick that report up and open the PR, or escalate to the right team for human input.
What makes this a loop is that the scout checks back on things that it thinks got fixed. It does this by keeping notes in its scratchpad about what was reported, what shipped, and validates that the fix held before considering a theme closed.
And it works fast. For example, on August 28th at 11:28 UTC, an agent working in a customer's project filed missing_tool feedback with task_completed=false. It wanted to define catalog events before any had been ingested. The MCP had event-definition-update but no create, so its workaround was firing one anonymous seed capture per event and then calling update. Ugly.
About five minutes later, the scout emitted a report after checking that there no pre-existing reports, open PRs, or assigned issues. Eight minutes after that, PR #90832 was open. The REST create endpoint already existed so the MCP just needed a tool to call it.
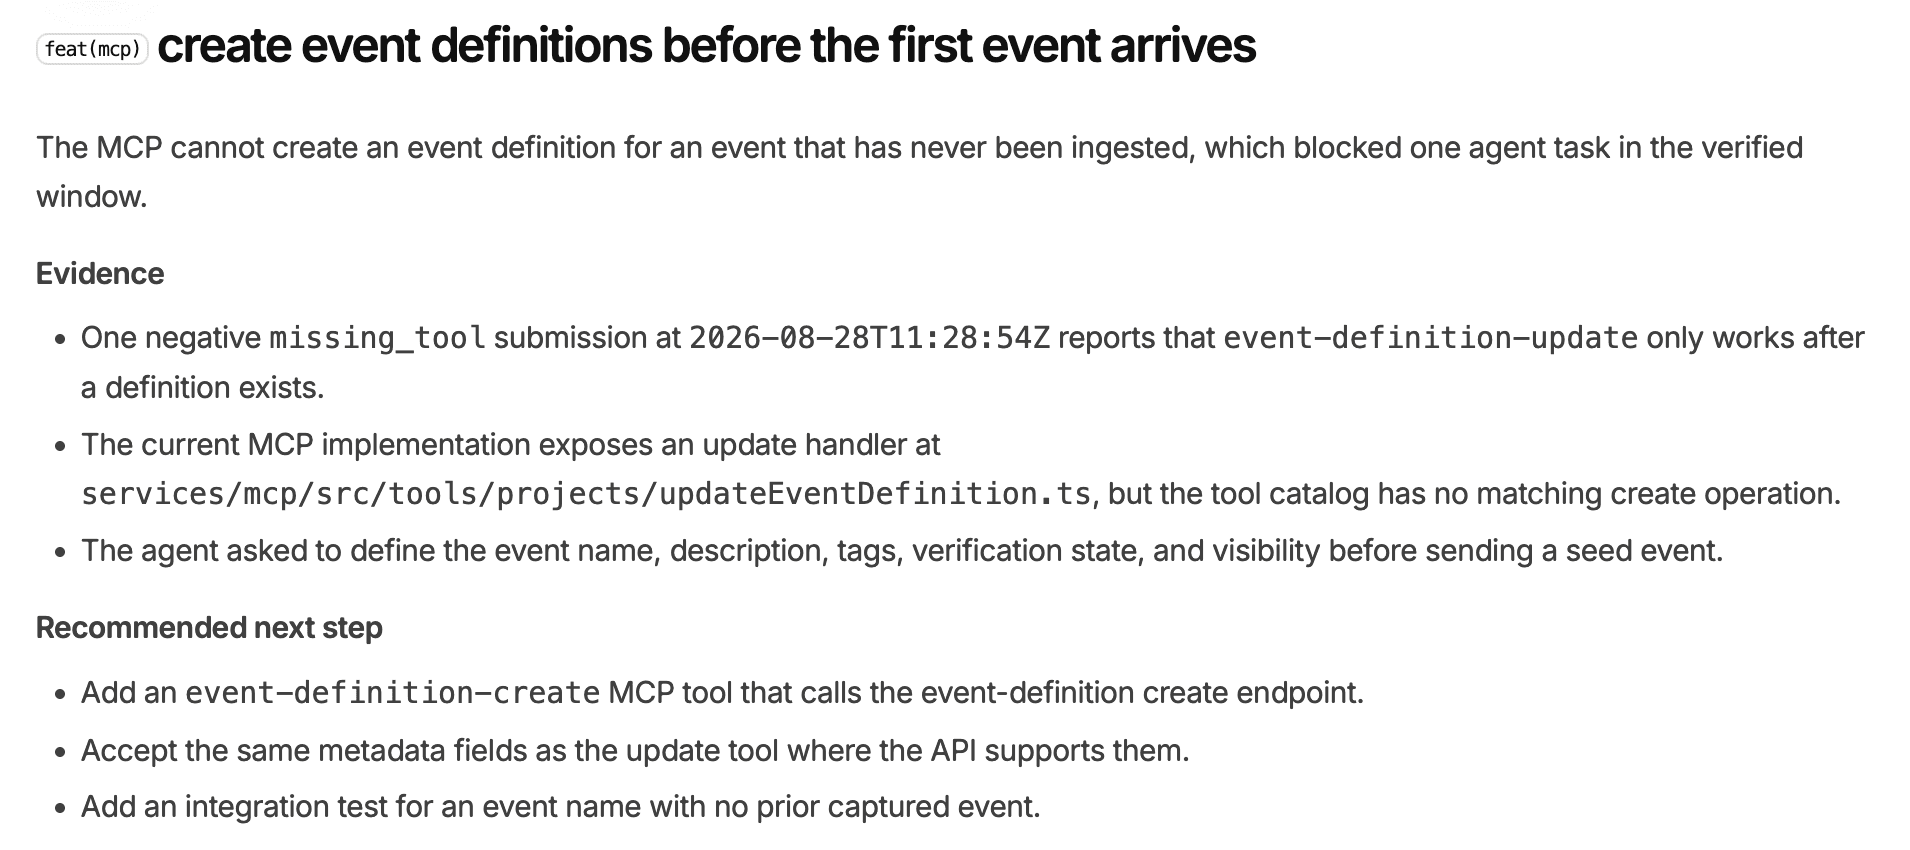
The report: a missing-tool complaint, supporting evidence, and a concrete next step.
The first version of the fix wasn't perfect, though. The PR went through a few rounds of agent-assisted review from ReviewHog (our internal code review tool) and Codex. The final PR included backend changes and tests as well as the new tool.
I ended up approving the PR at 14:22, hit /trunk merge at 17:27, and it landed in prod by 18:56. The whole timeline from complaint to fix took less than a work day, and the only time I spent on it was reviewing and a bit of prompting.
Where I sit: Reviewing the reports, and reviewing the PRs. The detection, triage, dedupe, and root-cause legwork all happened before I arrived. I steer it when needed, but often it catches useful little (and sometimes bigger or more important) fixes as APIs, tools, skills, and clients change.
TL;DR – An customer's agent complains about something in our MCP → A scout watches and distills the feedback → Turns it into a report → A self-driving agent picks it up and creates a PR → I do some manual steering → The scout checks if the PR actually fixed it.
2. Our #team-self-driving bug reports loop
Some of our best bug reports start with someone on the team asking, "Is this happening to anyone else?" in Slack. You know the smaller stuff that's annoying enough to mention, but not big enough to be on someone's to-do list.
We set up signals-scout-team-self-driving to watch our team's channel for exactly that kind of stuff: bug reports, feature ideas, and customer feedback that get lost in threads. It groups by thread, skips the banter and memes, and brings useful findings into our self-driving inbox.
For example, on August 25, Dylan shared a task in our channel while asking about a GitHub integration problem. I clicked the link and got "Task not found," so I asked @PostHog in the thread why I couldn't open it.
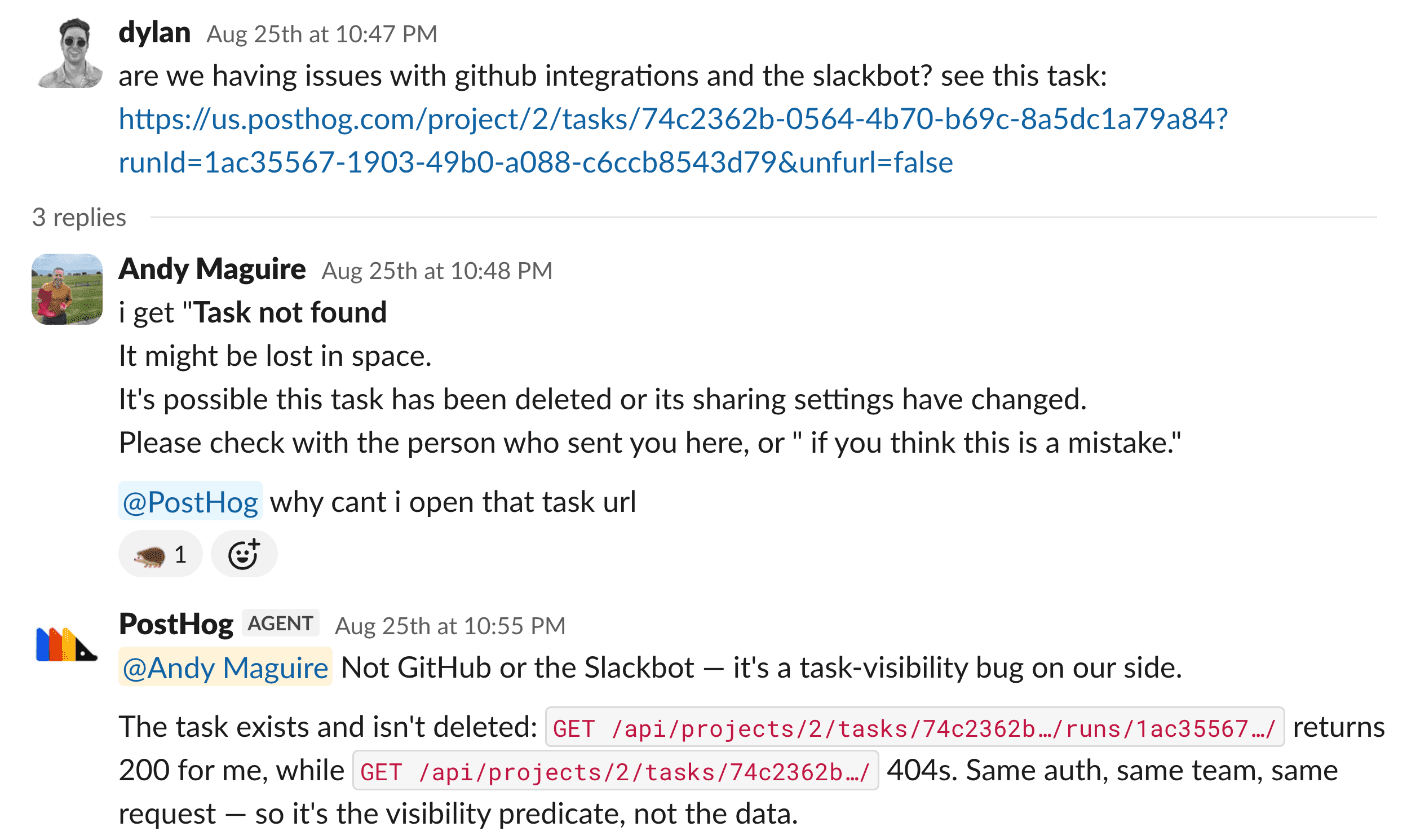
A shared link, a second bug, and the start of an investigation.
It turned out the task link was valid, but the task page used a different visibility check and rejected the request before the page could load. The signals-scout-team-self-driving scout picked up the bug in this thread and authored an inbox report, which kicked off a task that opened PR #88912 with the fix.
I added Vojta and Georgiy as reviewers, Vojta approved, and it merged on September 4. A bug we stumbled over while talking about another bug made it through to a fix.
Where I sit: Reproducing problems, reviewing the reports, and bringing in the right people to review the fix. Sometimes, like here, the investigation starts right in the Slack thread.
TL;DR – Team notices a bug → Shares it in Slack → A scout picks it up → Investigates the issue → Creates a PR → We review and merge.
3. The issues → reports → PRs loop
This loop has changed how I work more than any other.
I spend more time upfront nowadays writing specs, or GitHub issues that contain the intended behavior of a code change. Our team has a signals-scout-self-driving-github-issues scout that sweeps our team's GitHub issue specs and judges whether they're ready for implementation (i.e., is the scope clear, is anything blocking them, and is someone already doing the work?)
When an issue is deemed ready, it becomes an inbox report and can move into implementation. Something that still needs a product decision comes back for human input. The scout also checks for matching reports to avoid duplicate PRs.
For example, on September 4, I wrote issue #94896 to explain that we needed to rename skills without losing their history. Duplicating a skill and archiving the old one was a workaround, but it didn't preserve the same skill's versions and ownership.
The issues scout picked it up that morning which kicked off PR #95499 to add a Rename dialog in the skill's More menu and a skill-rename MCP tool, with the existing versions, bundled files, and ownership stay attached to the skill:
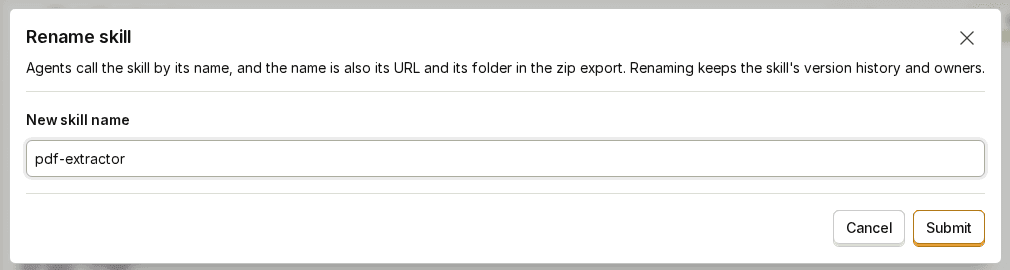
The result: a Rename dialog that keeps the skill’s history and owners. Screenshot from the merged PR’s Storybook example.
I approved it on September 7, and it merged that morning. A feature I wanted, from an issue I wrote, with a concrete result to review at the other end.
I can have more of these going at once because I don't need to watch each agent work. Writing a good issue and checking the result still take time, but that feels like a much better use of mine.
Where I sit: Writing the issue and checking the result before merging.
TL;DR – Human writes the spec → A scout sweeps regularly to see what's ready → Kicks off tasks and PRs for specs that are ready for implementation → Human reviews and merges.
4. The anomaly alert → investigation → fix loop
We use alerts to watch metrics we care about and start an investigation when something looks wrong. For our team, that includes the error rate of the MCP tools self-driving uses. These alerts get posted to our Slack channel. We use the PostHog in Slack integration to quickly ask follow-up questions and steer the agent toward a fix.
For example, on September 5, our MCP error-rate alert fired at roughly 9.9%, against a typical baseline of 0.3% to 1.2% over the previous two weeks. The investigation narrowed the spike to scout-project-profile-get: 88 errors in an hour, spread across about 44 projects. I replied in the thread: "let's root cause this".
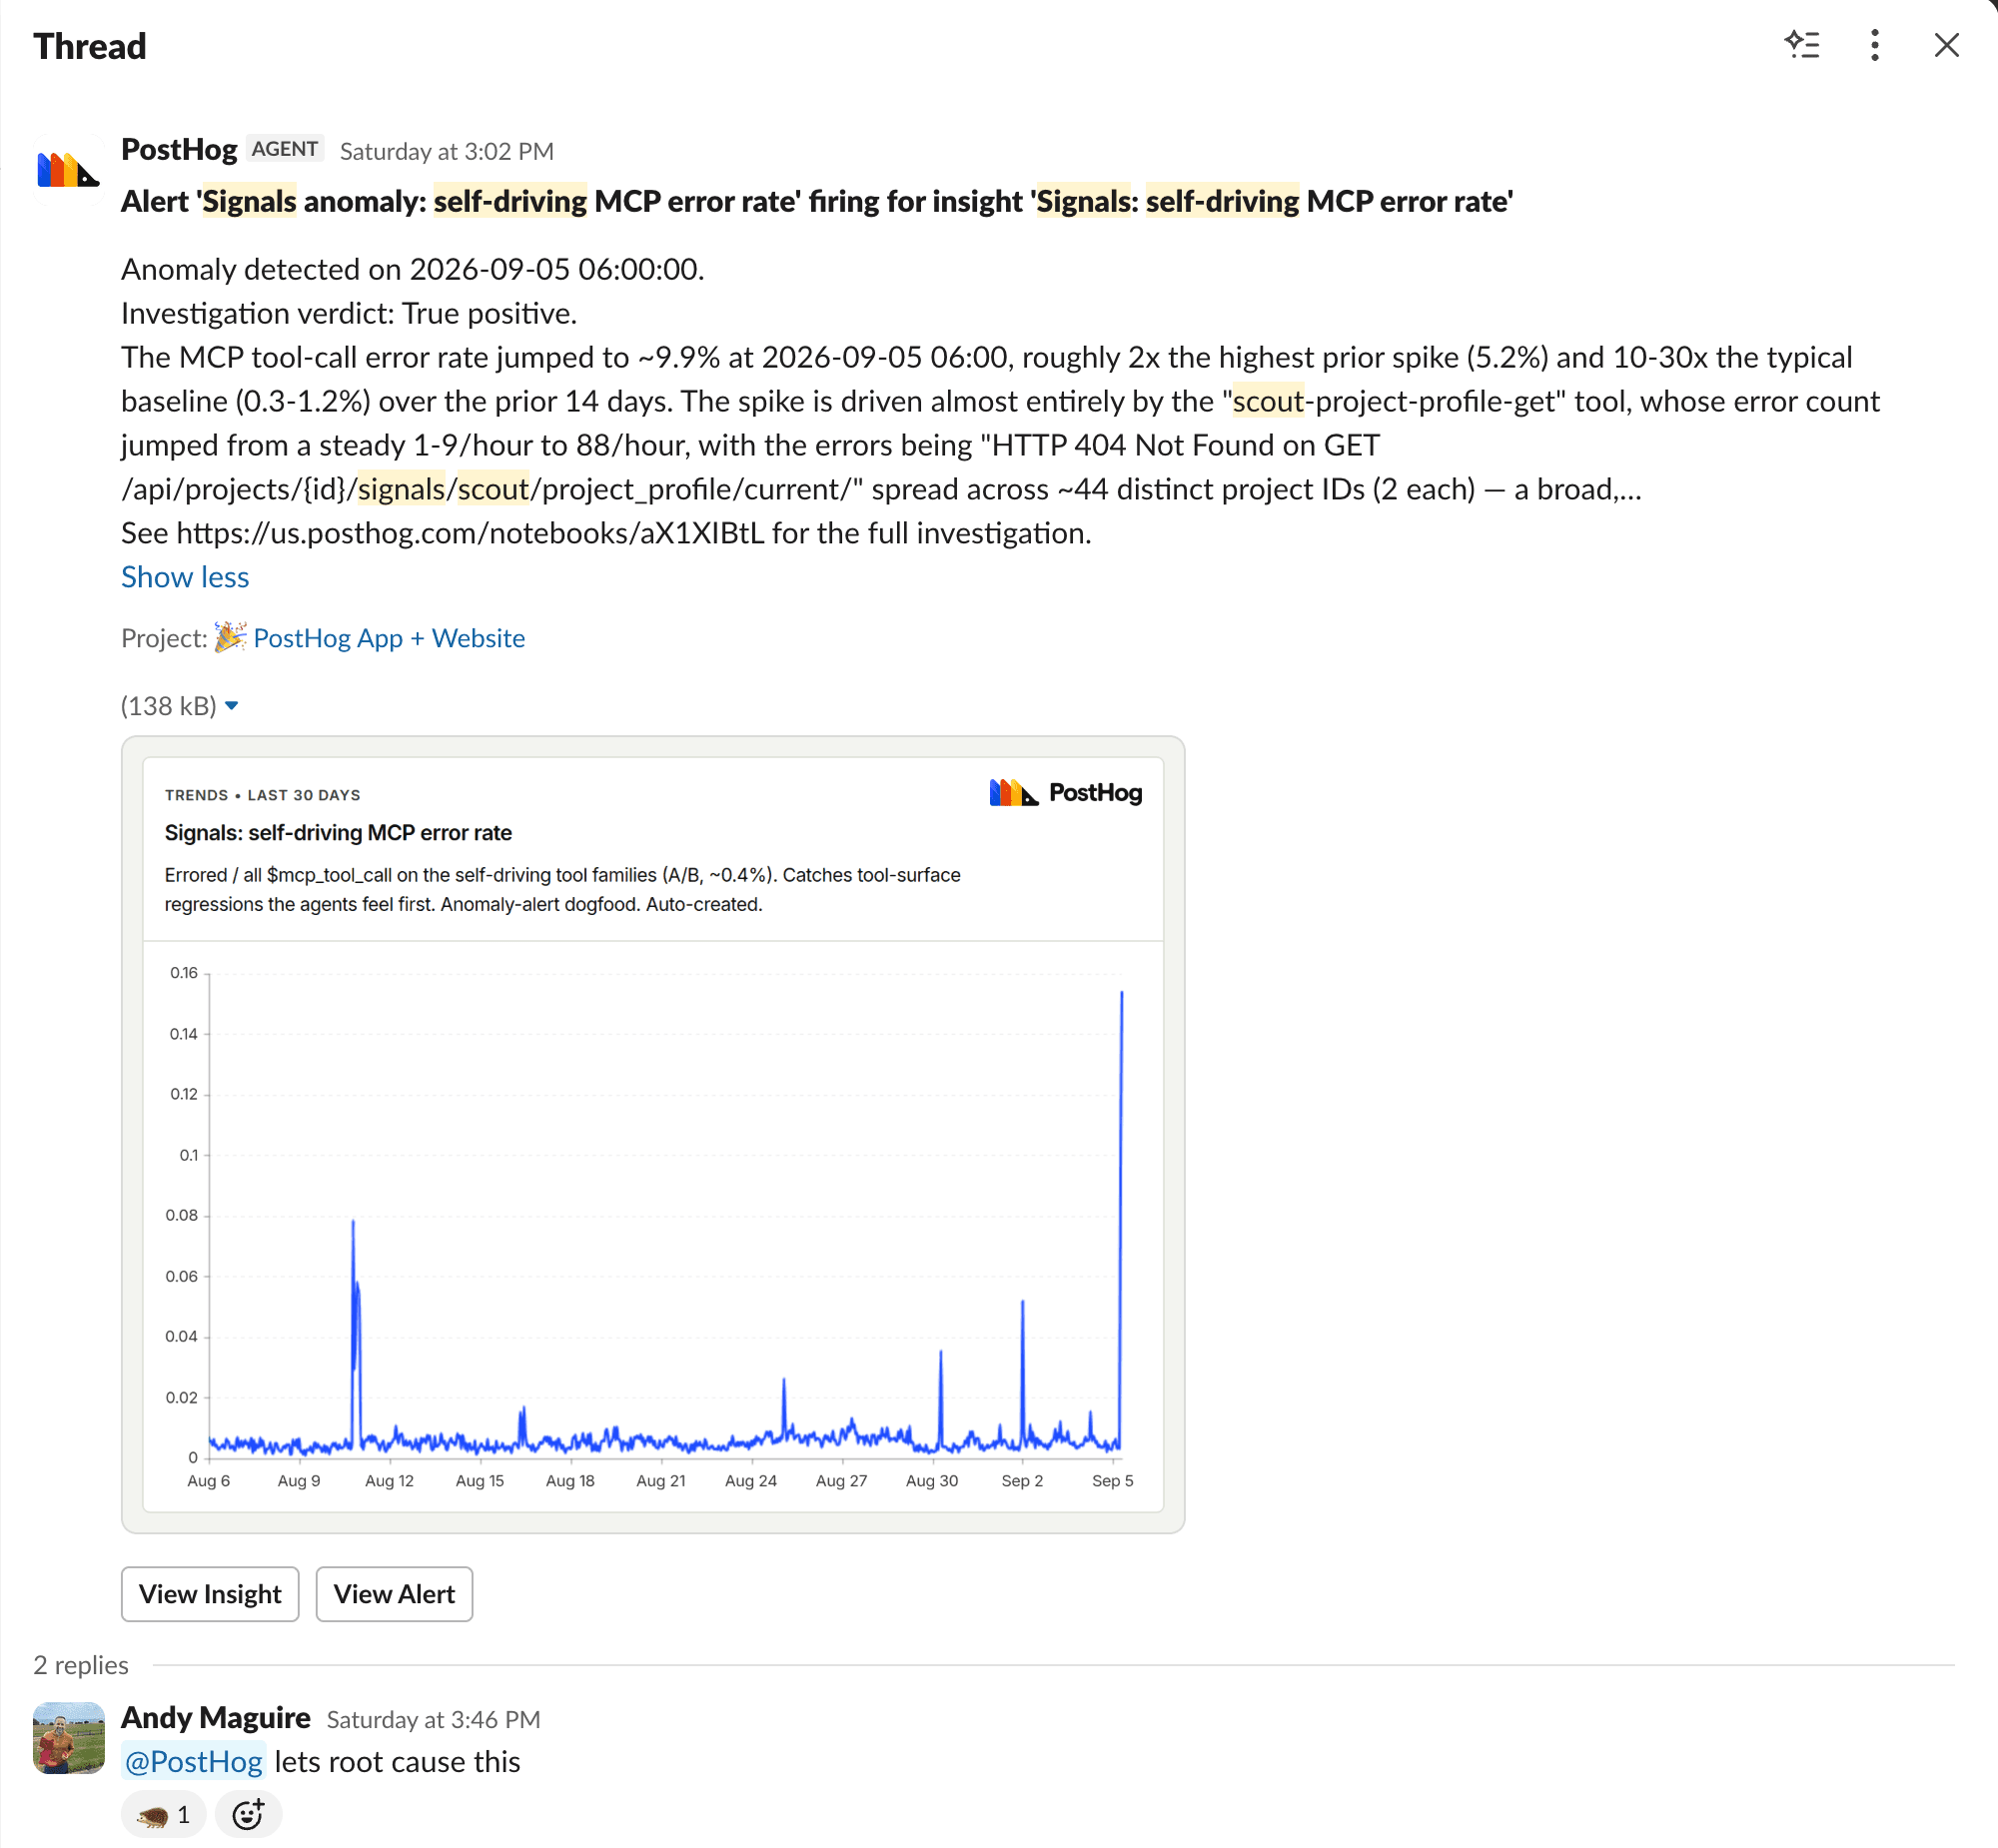
The alert landed in Slack with a chart and an initial investigation. I picked up the thread from there.
The agent connected the failures to a deployment that gave scouts optional extra write permissions. Working through it, we pinned down a mismatch between two separately deployed workers: the scheduler now sent a dictionary describing the permissions, but an older sandbox worker still expected the old preset format.
I opened PR #95623 with agent assistance to make scouts without extra grants use the compatible preset string again. It merged that afternoon. I also opened PR #95621 to fix the deployment filter that had skipped the tasks worker when shared OAuth code changed. (That follow-up is still open as I write this.)
So, the alert didn't autonomously fix production while I made coffee, since this one needed more steering from me than the others. But it caught the problem, gave me a starting investigation, and helped me get a compatibility fix merged. I'll take that.
Where I sit: Asking follow-up questions, checking the diagnosis, and getting the right fix merged.
TL;DR Loop. Metric moves → We get a Slack alert → We ask investigative questions → Scout kicks off a fix → We review and merge the PR → Scout keeps watching the metric and reports if it didn't work.
5. The Replay Vision observation loop
This loop starts from actual users using the product, without having to tell us what went wrong. This is done with Replay Vision which watches session recordings and turns what it sees into structured observations.
We run a monitor scanner with it called "Desktop onboarding friction" over recordings of PostHog Desktop. Its prompt is roughly: watch for people getting visibly stuck.
One day, a recording showed someone hitting a provider error in PostHog Desktop and then failing to deliver a follow-up message.
The report connected the visible failures, sent them for investigation, and found a gap in the error handling. We already recognized one provider error, but the second one skipped the retry handling and exposed raw provider text. There was telemetry for related task failures, but the follow-up rejection itself left the run alive and didn't produce its own failure event. The recording showed the user-facing problem that the event stream alone missed:
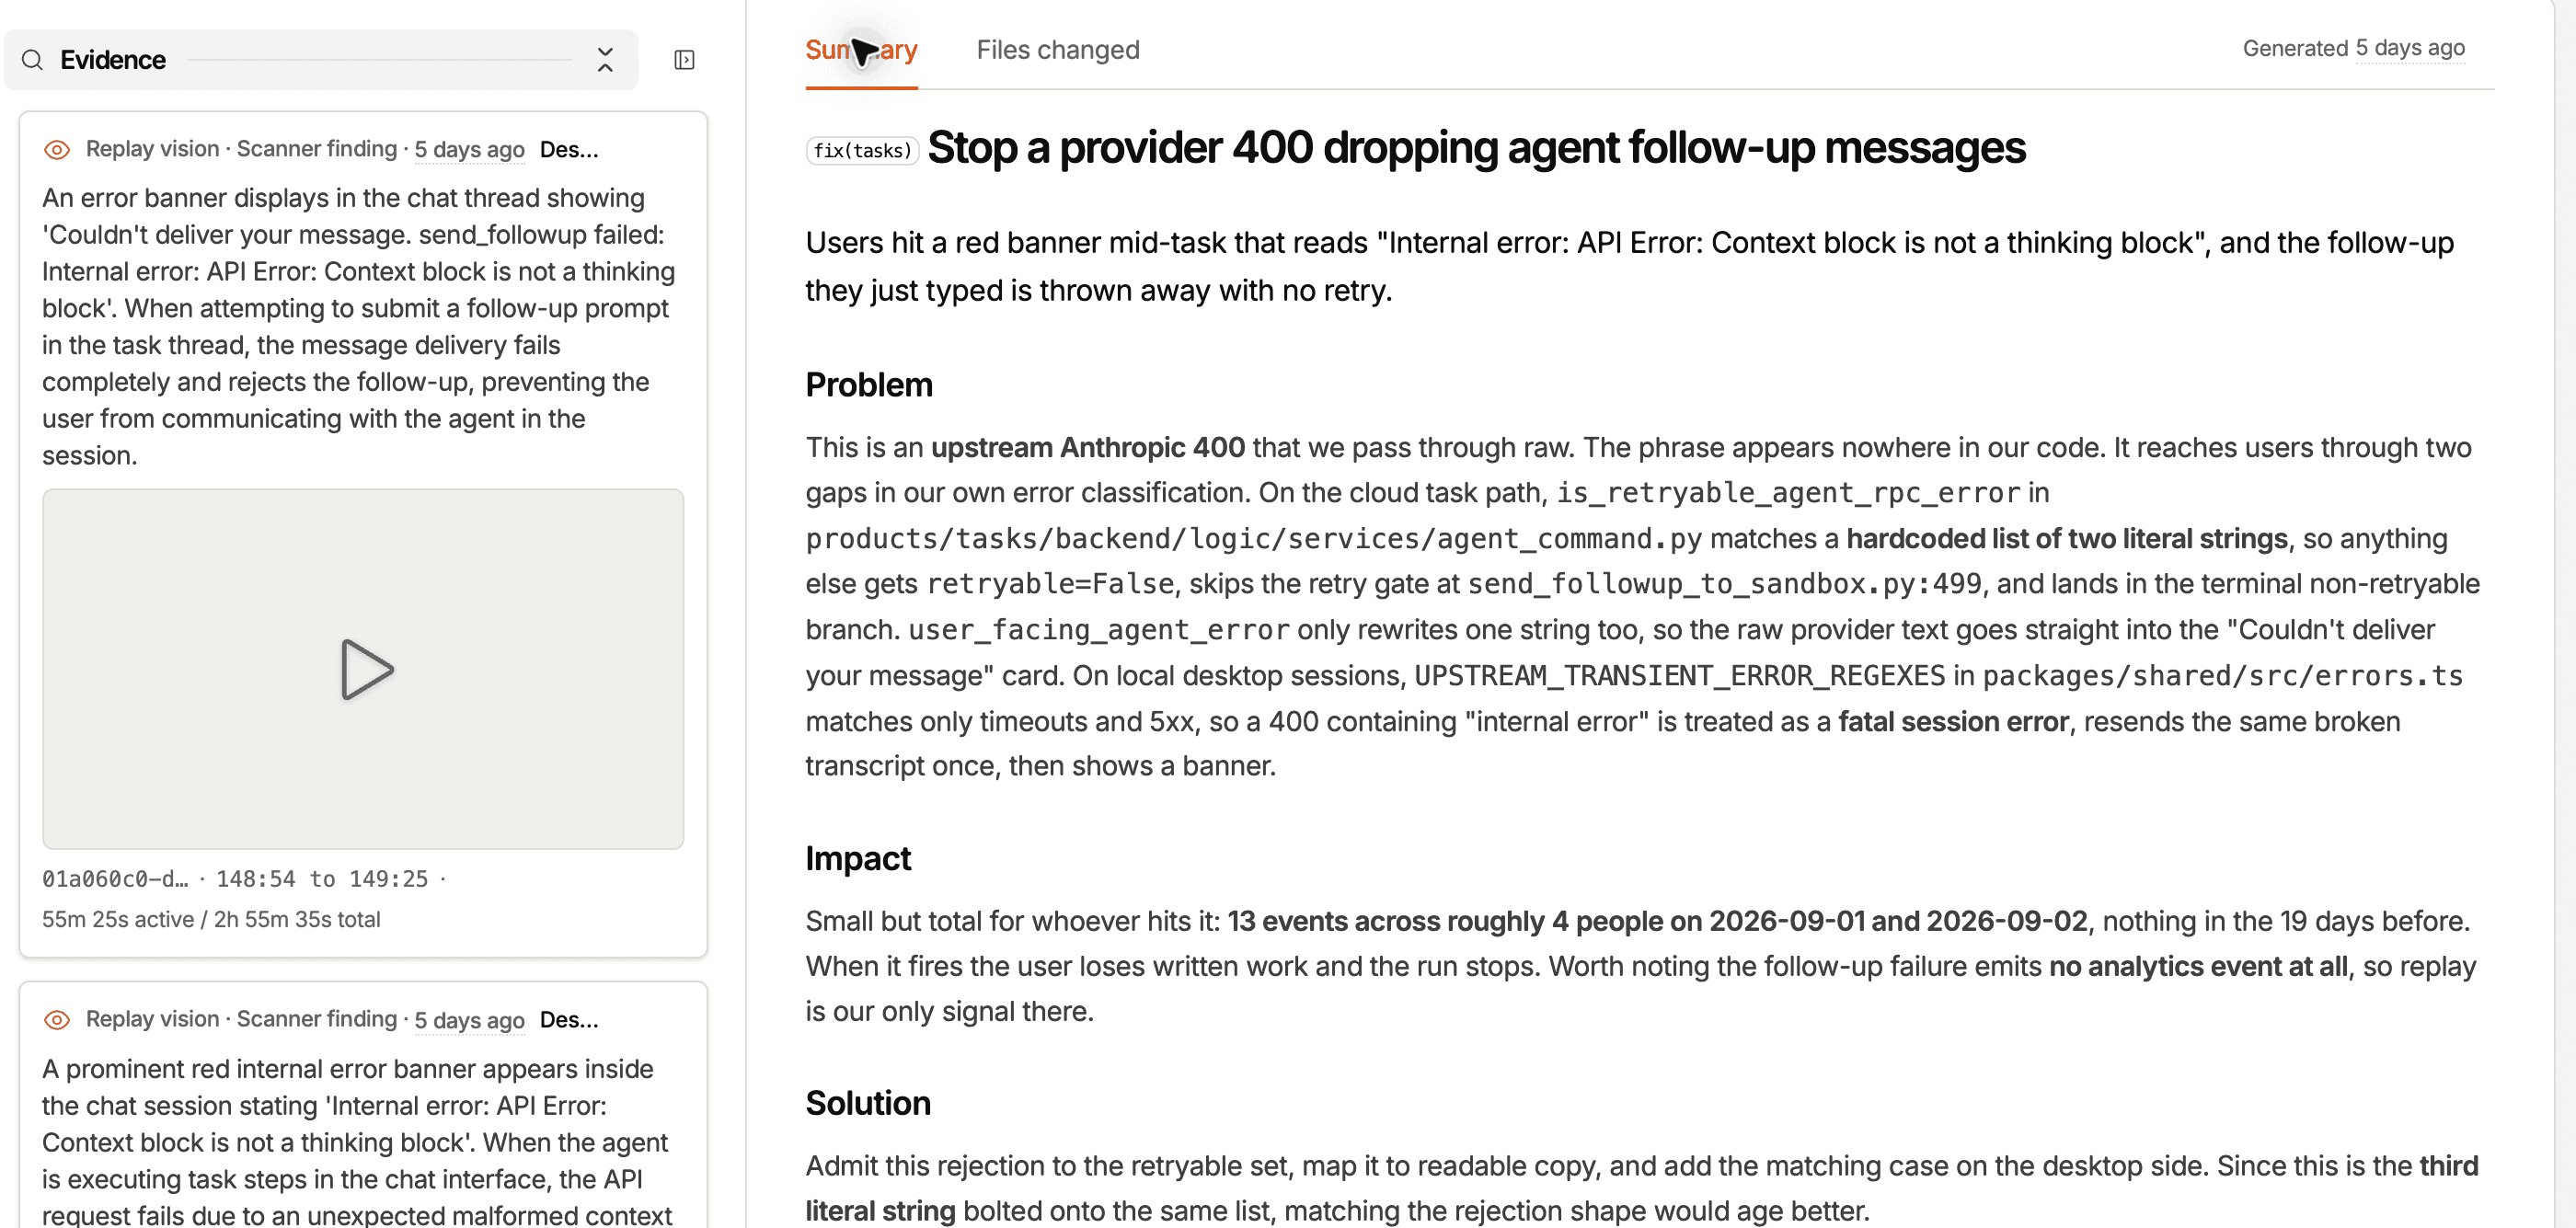
The report as generated, with timestamped Replay Vision observations beside the diagnosis. The implementation later corrected “Context block” to “Content block.”
PR #93181 matched the content-block error family and made the follow-up eligible for retry handling, replaced the raw provider text with readable guidance, and kept the desktop session alive for this rejection.
The fix was merged on September 2. The PR itself isn't super interesting, but the exciting part is how we found it: someone got stuck, and the recording became the starting point for a fix.
Where I sit: I read this report after the fix had merged. Another engineer reviewed the implementation. I'm including it because it shows a new way of finding problems that our other telemetry can miss.
TL;DR – Replay Vision watches users → Records friction points → Reports them to us → Kicks off a PR → We review and merge.
6-7. The self-checking & self-validating error log loops
Another one we set up uses a scheduled scout called signals-scout-self-driving-logs to look for problems in the self-driving related slices of our runtime logs. It works out what failed that caused the log, whether repeated lines are one retry loop or many separate failures, and whether someone is already fixing it.
One run found a task that couldn't start its Hogland (an internal VM service) sandbox because one of its metadata tags was too long. The tag included a workflow ID made from a prefix and two UUIDs. Metadata that had worked with a previous provider ran into a limit with a different one. PR #92909 bounded the tag strings sent to Hogland and added tests for their lengths, with task and run IDs still available as separate tags.
The part I like is what happened while that PR sat in review. The scout kept checking, and each new run added evidence of the same failure to the existing report instead of starting a competing investigation:
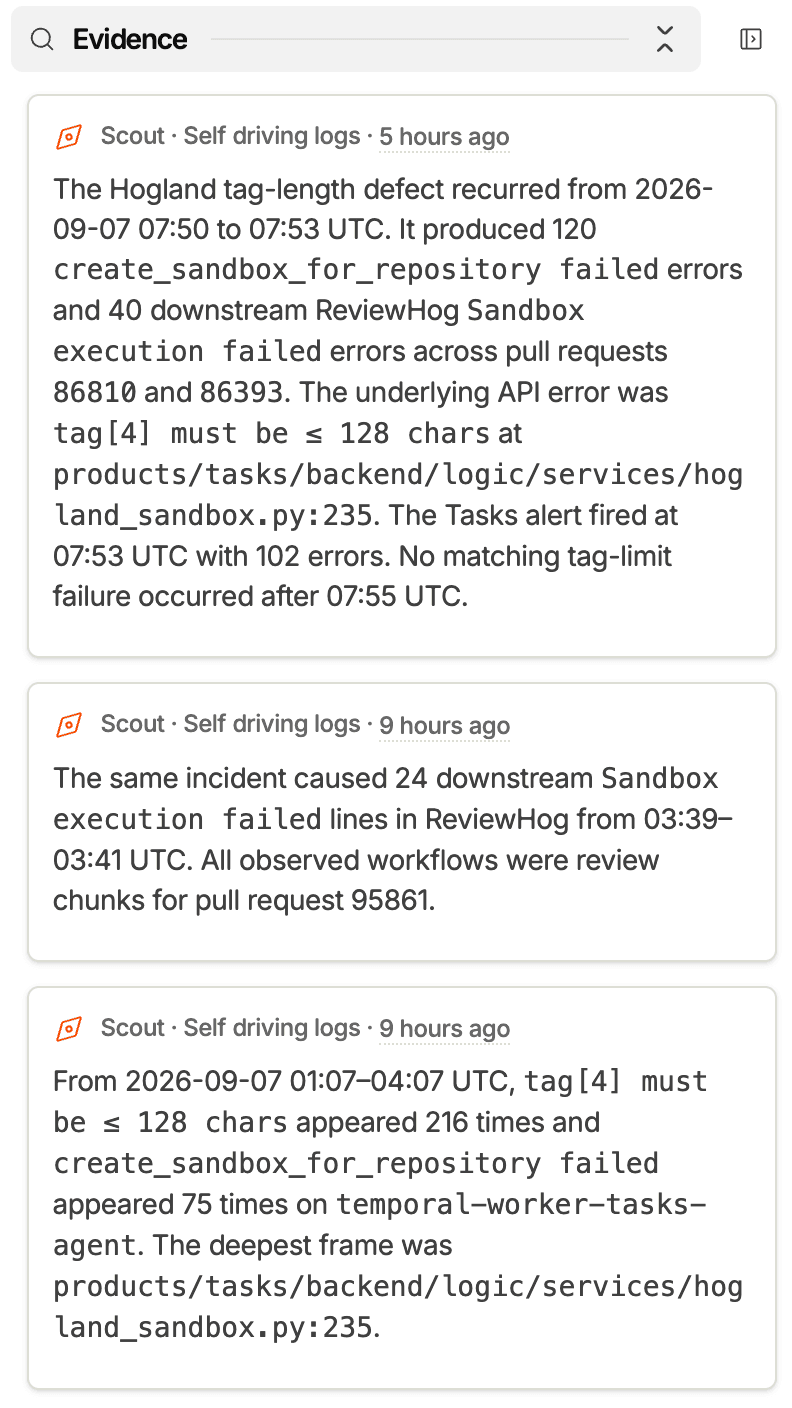
The report's Evidence section: fresh findings from later scout runs accumulate on the same report.
I requested the merge on September 7, and it merged that morning at 10:00 UTC.
... But merged isn't the same as verified in production. The job isn't done yet – the harness tells scouts to leave follow-up notes and re-check the evidence on what they reported, so they have to follow up and check if it's actually fixed.
In the scout's next run after the PR merged, it saw that the last matching failure happened at 10:06 and didn't happen again afterwards. That's what lets the scout say that "the Hogland burst stopped after its fix merged," and not author any other reports. It took care of checking the fix so that I didn't have to!
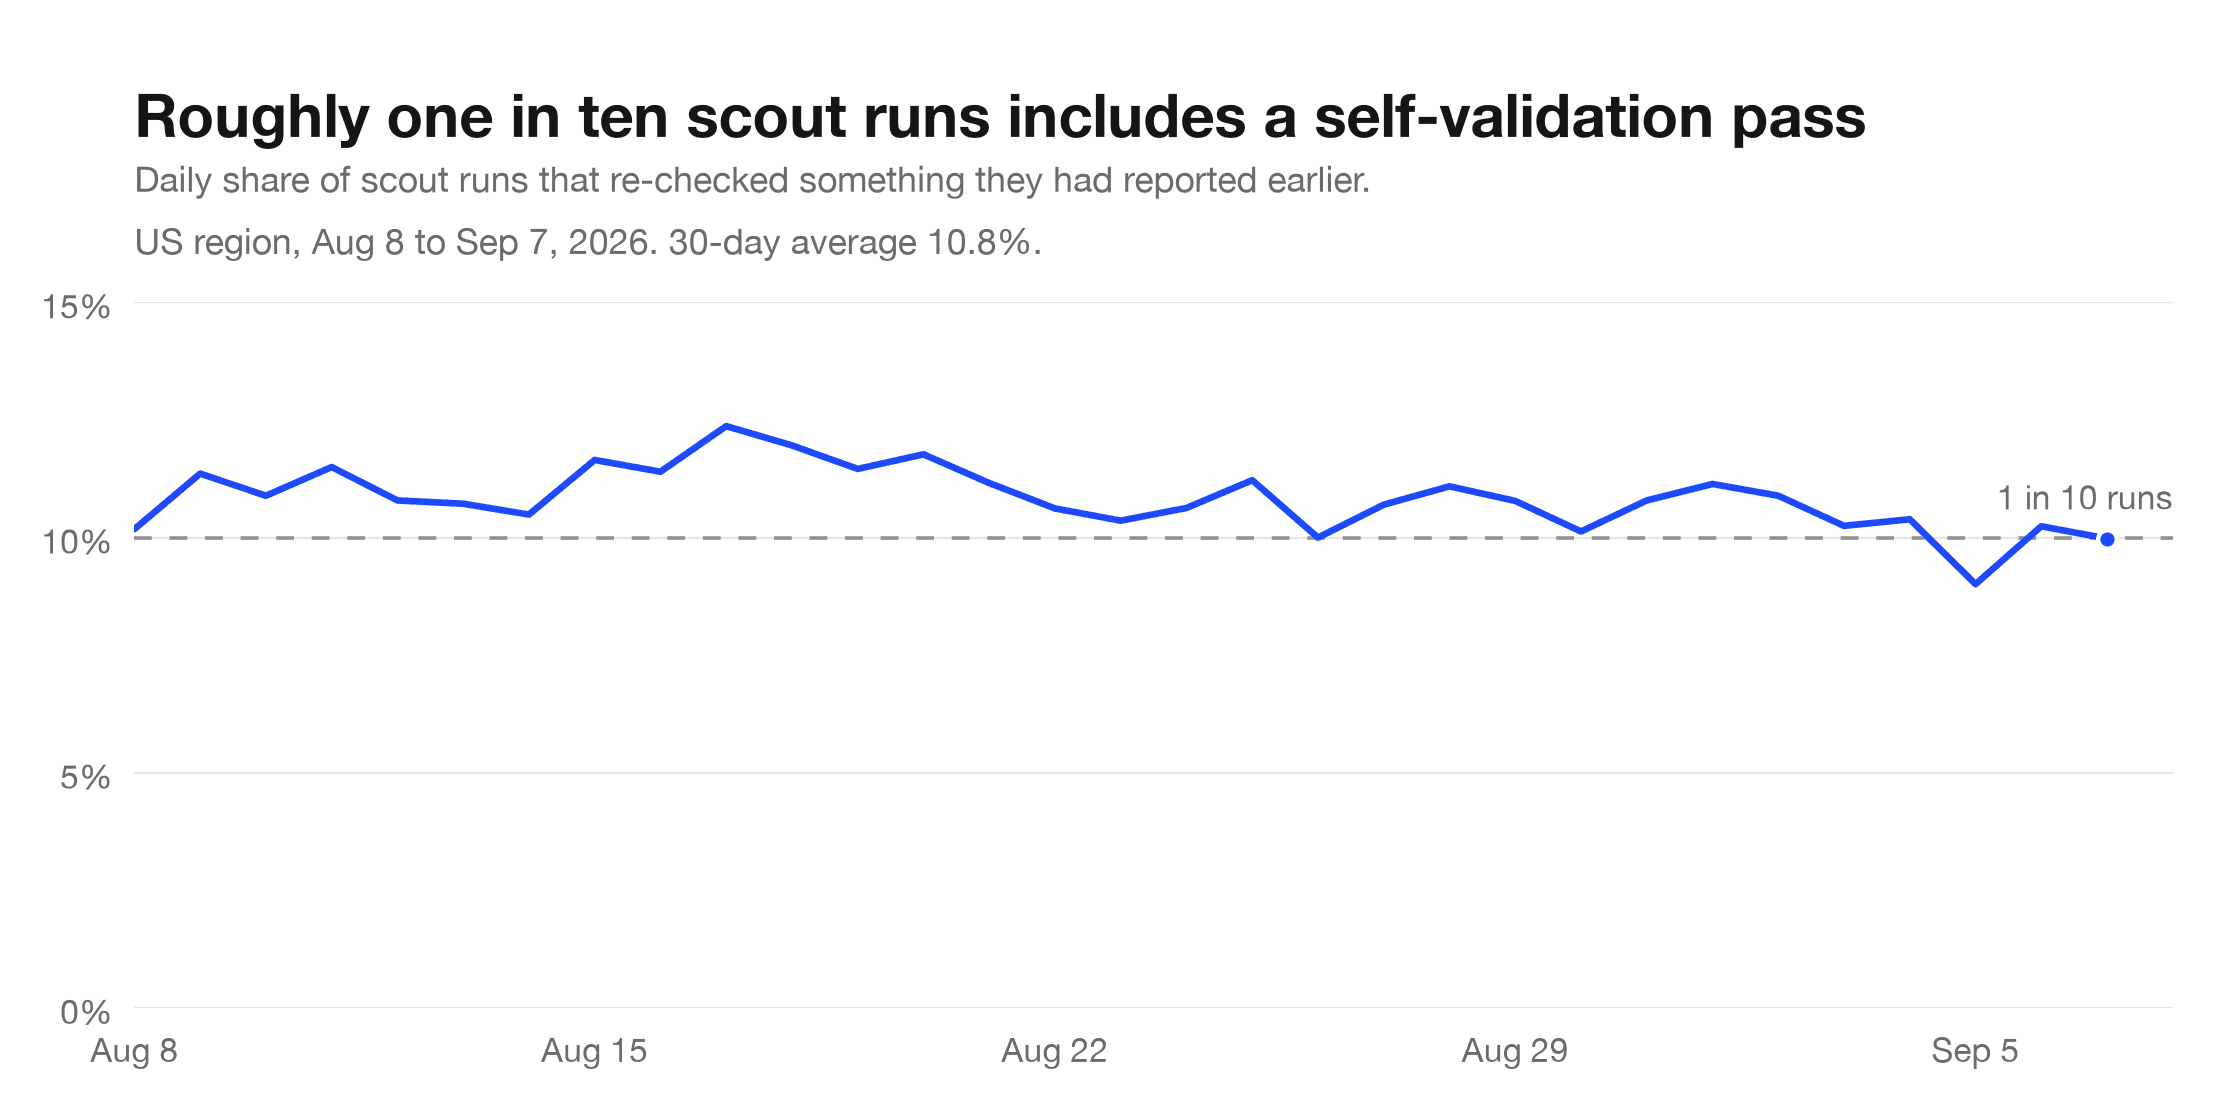
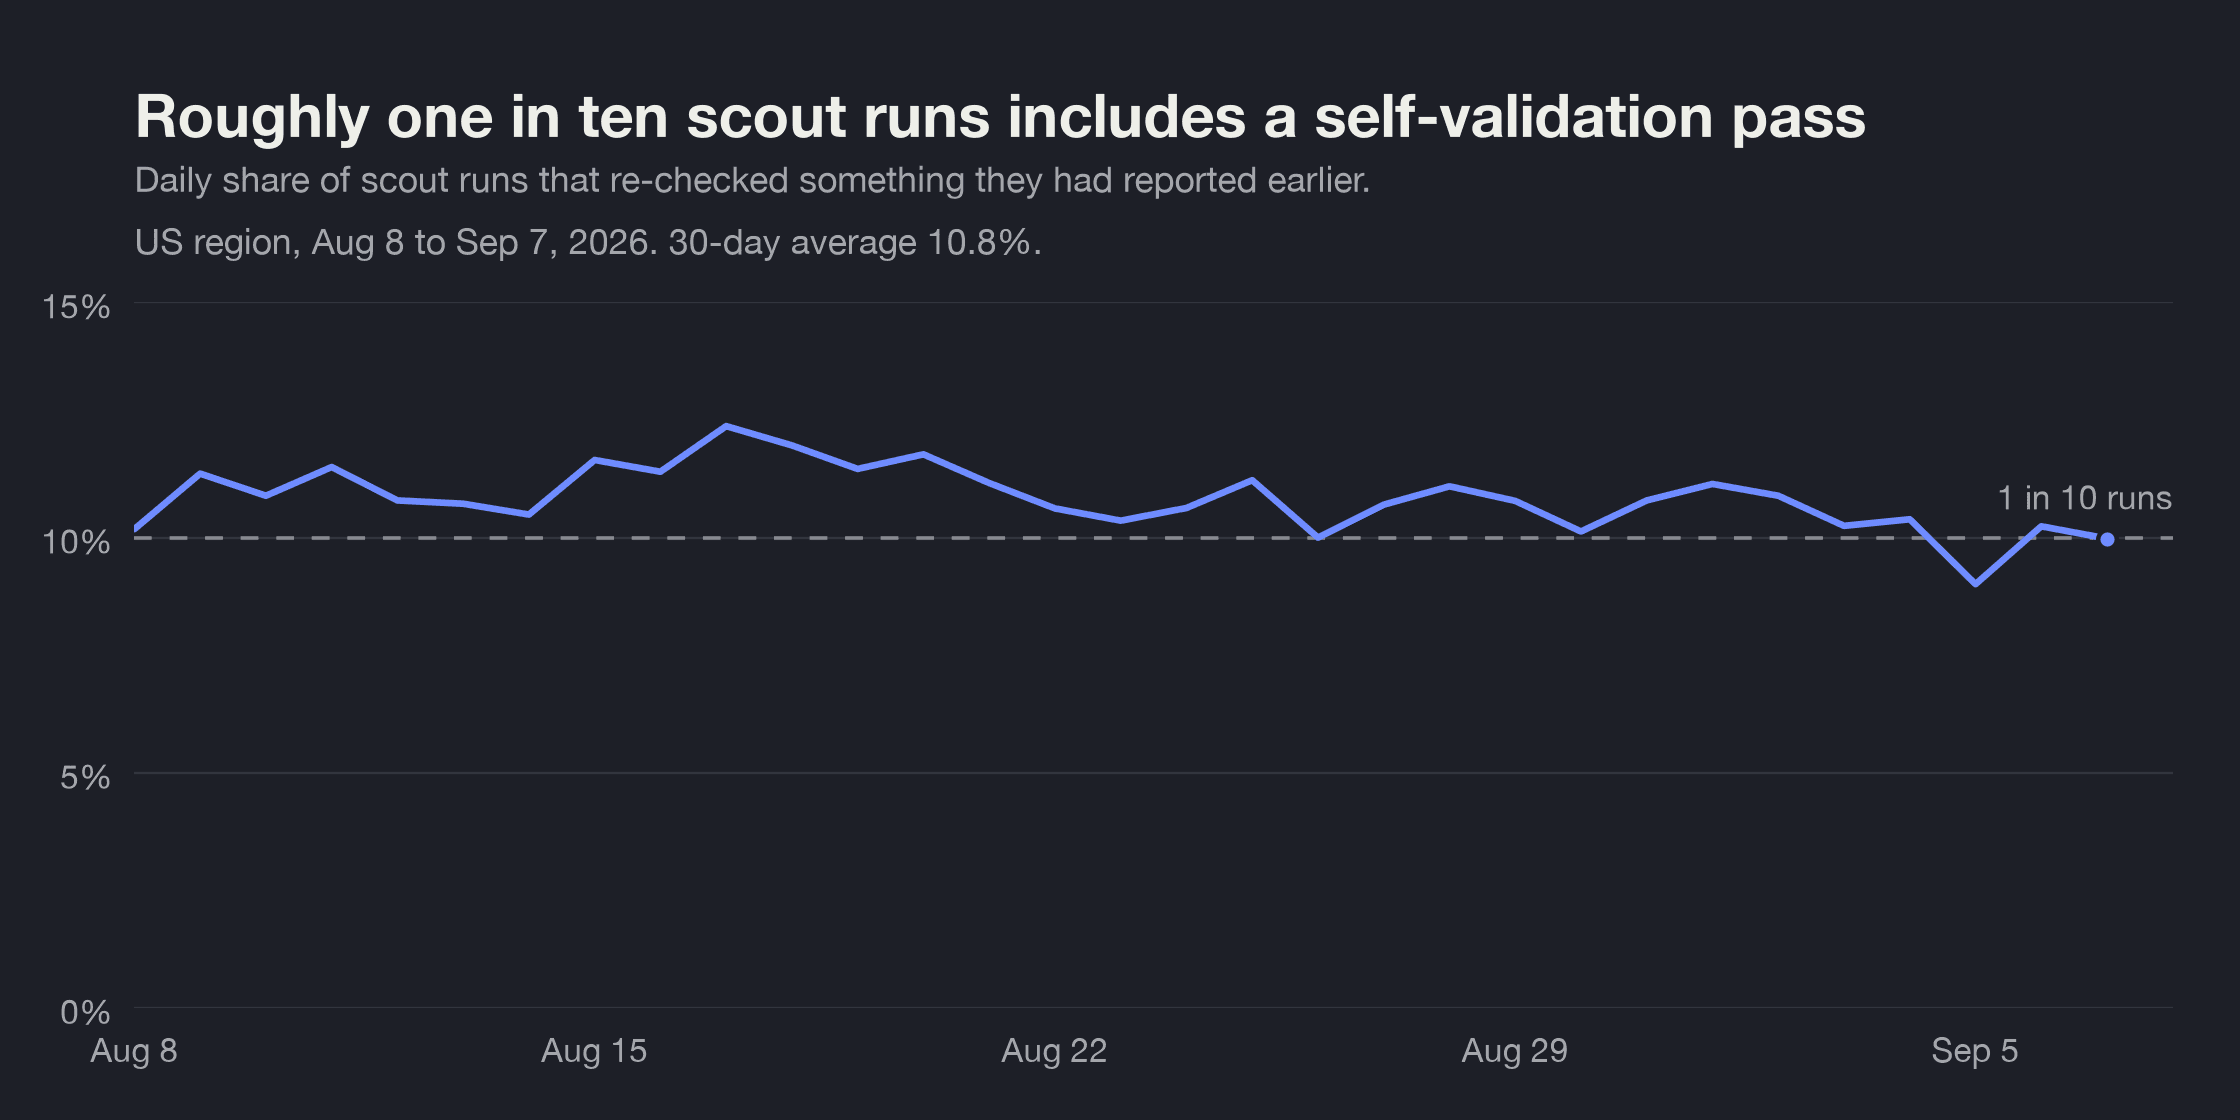
We call this part of the work self-validation. And over the last month, roughly one in ten scout runs included a self-validation pass. Checking old findings is a regular part of the work.
Where I sit: Deciding whether the diagnosis and fix make sense, then getting the change merged.
TL;DR – A scheduled scout notices logs → Investigates what caused issues → Checks if it's fixed already → Appends to existing reports using memory. Future scheduled scouts keep watching logs and adding to the same existing reports instead of making new ones.
Try it yourself
To get loops like these running on your own product, follow the Self-driving setup guide.
Okay, now you draw a loop
I was writing this post as GPT 6 Astra came out so of course i had to add a little game (yes its 3D!).
PostHog is your product's context layer. With a full suite of developer tools – AI observability, product analytics, session replay, feature flags, experiments, error tracking, logs, and more – PostHog ingests and stores all the data agents need to diagnose problems, uncover opportunities, and ship fixes. A data warehouse and CDP tie it all together, unifying that context into one source agents can read across. You can steer it all from Slack, the web app, the desktop (PostHog Desktop), or your own editor via the MCP.