






How AI changes the way PostHog is used

People can't stop talking about how AI changes the way products are used. We can't stop writing about it.
And although theorizing is fun, hard numbers are better. Here's how AI has actually changed the way PostHog is being used based on the data we capture.
Note: Most of this data is a snapshot from September 2026, and a lot of it is new:
- MCP Analytics was only released into alpha in June.
- The source of object creation (human vs AI) was set up at different times for different products.
- Data from PostHog's own agents wasn't always separated.
This can makes AI trends seem sharper than they actually are.
AI creates a majority of dashboards and insights
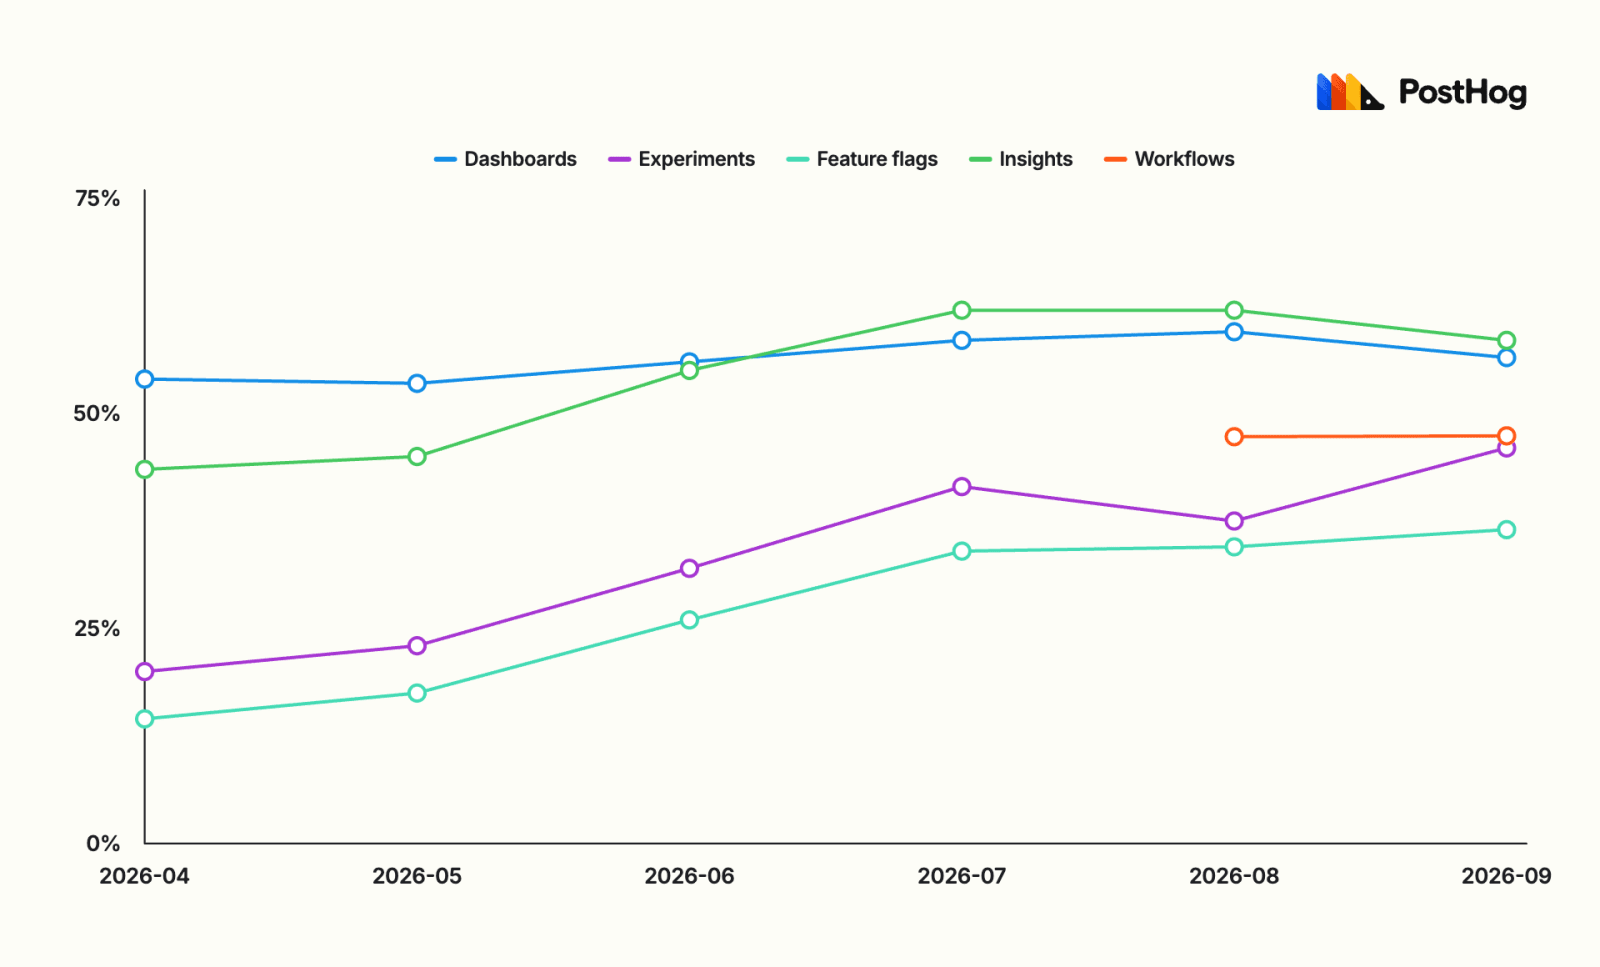
We count creation creation through our MCP, CLI, installation wizard, Slack app, Scouts, and PostHog AI as "AI". By that definition, AI creates a huge share of objects across PostHog's most popular products:
| Object | AI | Web UI | API |
|---|---|---|---|
| Insights | 58.7% | 15.0% | 25.3% |
| Dashboards | 56.4% | 23.6% | 18.4% |
| Workflows | 47.4% | 33.2% | 19.5% |
| Experiments | 45.8% | 27.7% | 26.3% |
| Feature flags | 36.1% | 36.6% | 21.8% |
The share of dashboards built with AI is roughly flat since April 2026 (up from 54%). Others have seen more recent and rapid adoption:
- Insights is up from 43% to 59%
- Experiments is up from 19.9% to 45.8%
- Feature flags is up from 14.3% to 36.1%
The UI is not dead, even for agent users
Do people come back to what AI creates? To check, we counted an object as "viewed" if someone opened it at least a day after it was created, and within 30 days. The viewing gap between AI-created and UI-created objects is biggest for insights:
| Product | AI created, UI viewed | UI created and viewed | Still viewed day 15–30 (AI / UI) |
|---|---|---|---|
| Insights | 7% | 24% | 2% / 9% |
| Dashboards | 52% | 54% | 28% / 30% |
| Experiments | 63% | 71% | 31% / 41% |
| Workflows | 34% | 47% | 14% / 19% |
Just because someone uses agents, doesn't mean they give up on the UI either. 96% of agent-heavy users (meaning they made 200+ calls through their agent in September) still use the UI.
People who start using agents kept the same number of days with a UI pageview (median of 9), while similar users who didn't start with agents fell from 8 to 5. 30% of experiments created through the MCP were later edited in the UI, and about of a third of their launches happened there too.
Agents speak SQL
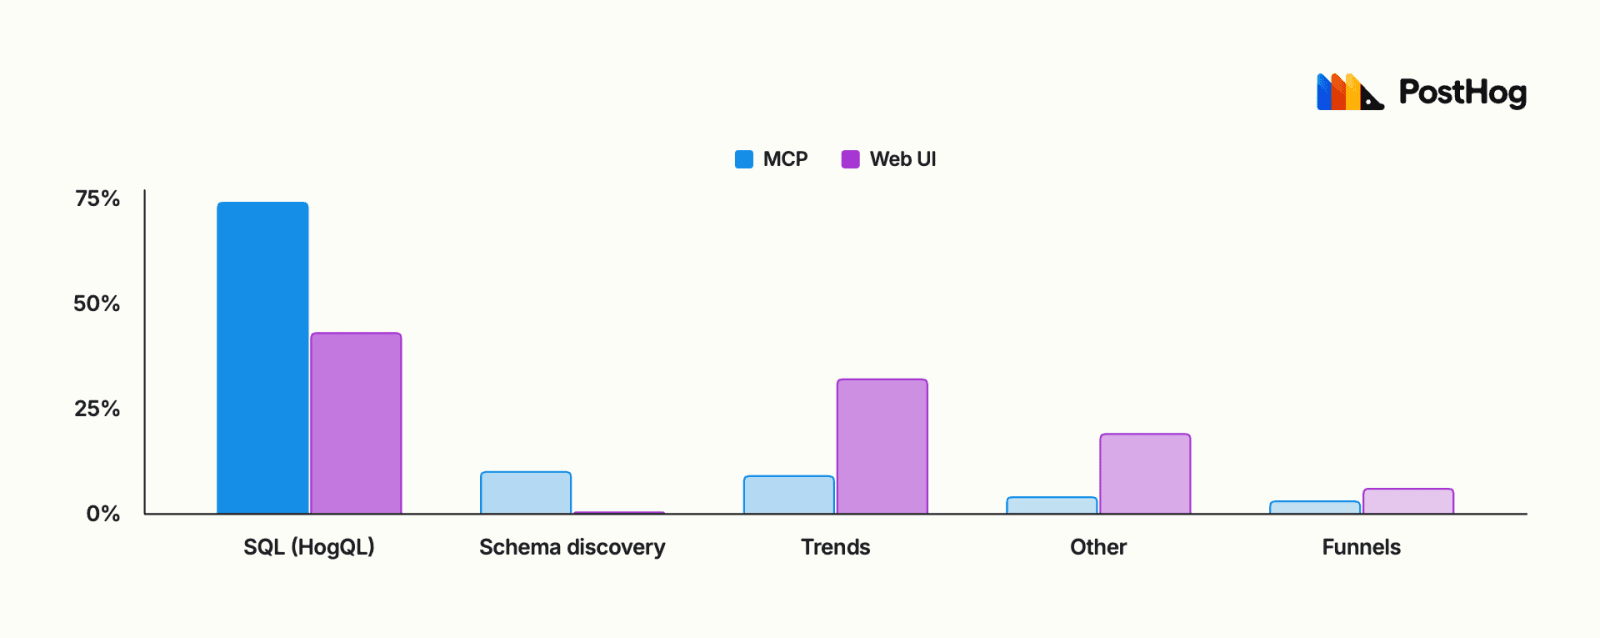
74% of MCP queries are SQL (as opposed to trend, funnel, or schema queries), while in the UI only 43% are. Overall, execute-sql is our most popular MCP tool at 52.3% of all tool calls. It's used 4x more than any other tool.
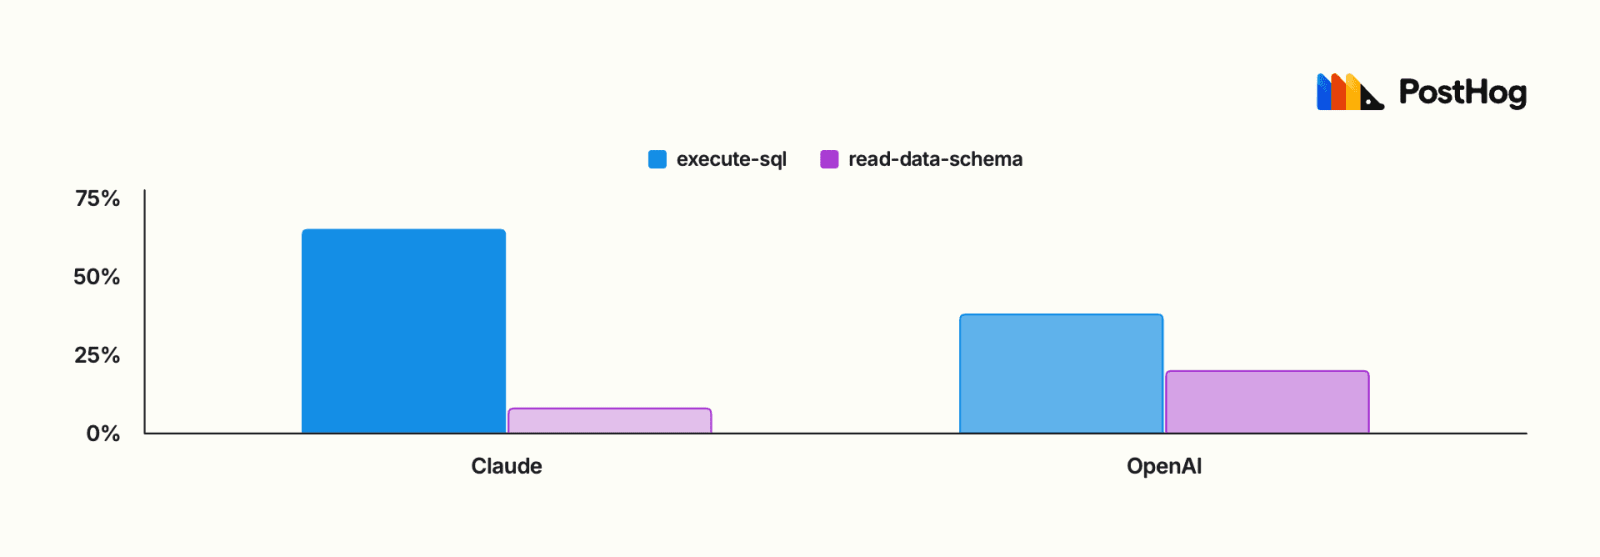
Interestingly, across people who use both, Claude calls execute-sql a lot more than Codex (66% to 38%). Codex relies more on schema lookups (21% to 8%), while Claude is willing to fail and try again.
5.2% of Claude's SQL calls fail compared to only 3.6% of Codex's.
Agents and humans prefer different products
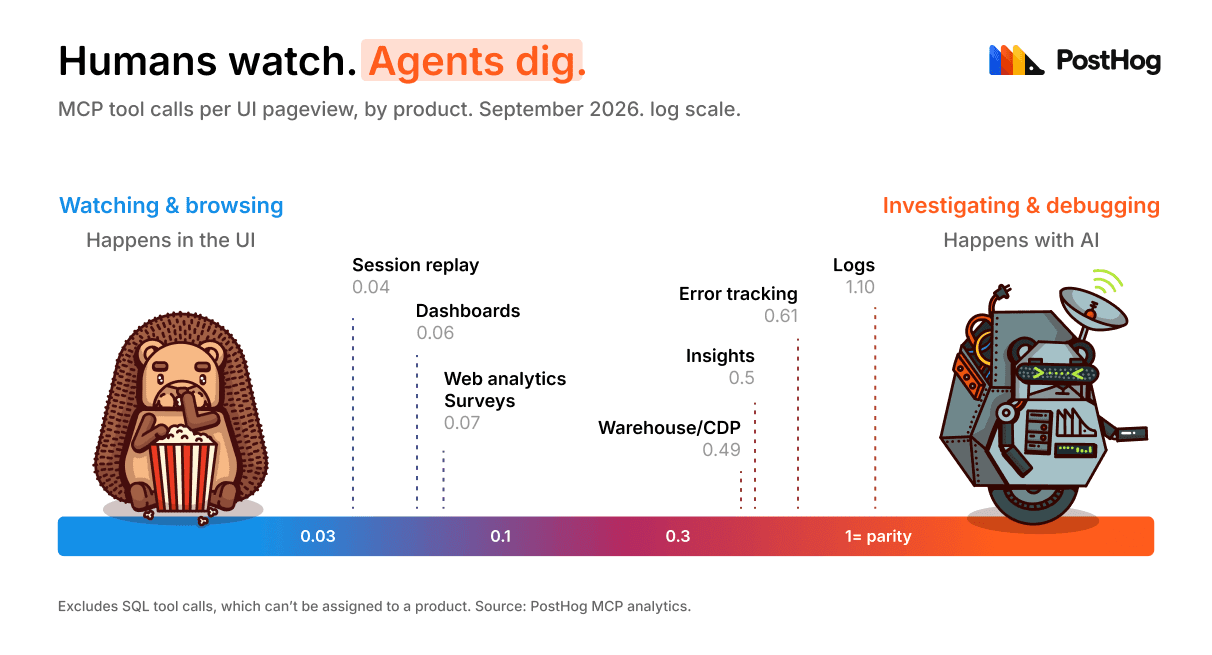
If you compare MCP tool calls with UI pageviews, you get a sense of what products are more used by one or the other.
- UI-dominant products include: replay (0.04 MCP tool calls per UI pageview), dashboards (0.06), web analytics (0.07), and surveys (0.07).
- Agent-heavy products include logs (1.10), error tracking (0.61), insights (0.50), and warehouse/CDP (0.49).
Although this undercounts unassignable SQL tool calls, the split is clear: watching and browsing happens in the UI; investigating and debugging happen with AI.
The surface shapes the work
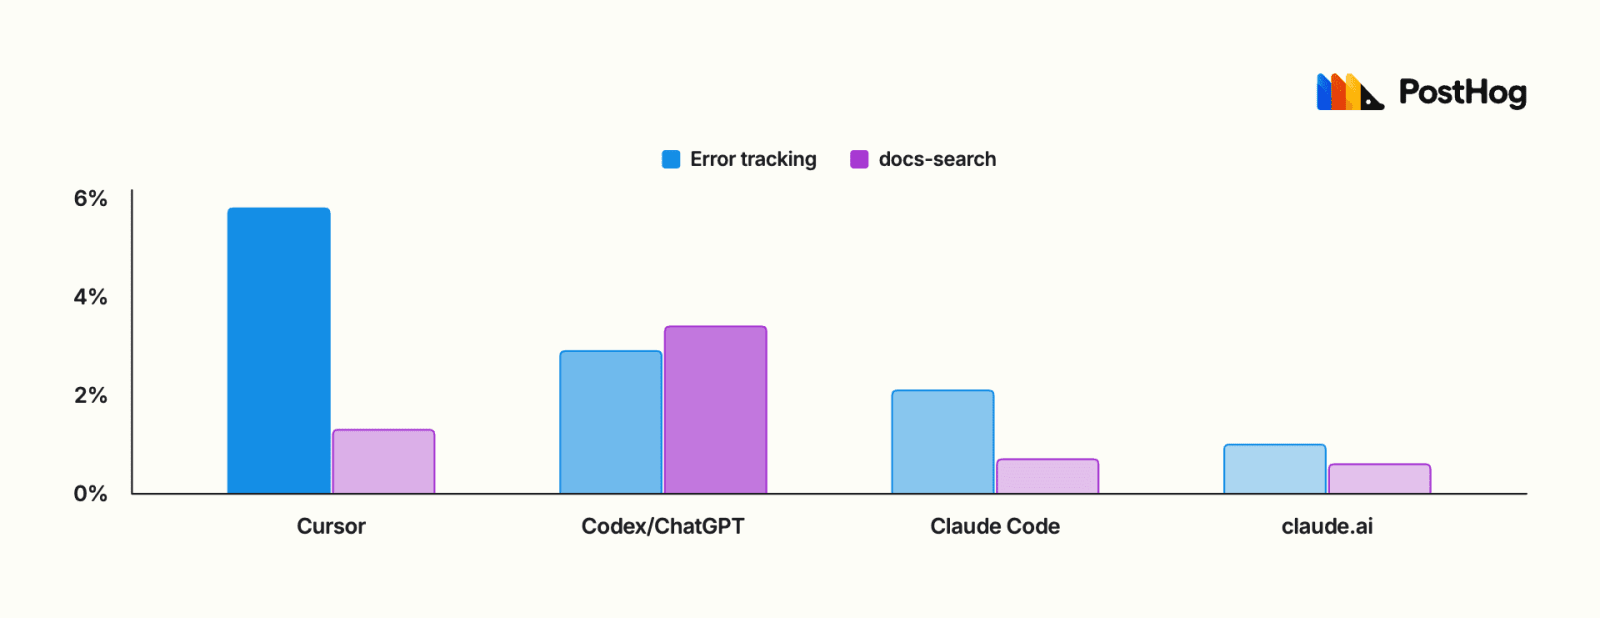
- Cursor is a leader for error tracking usage. 5.8% of its calls are related to error tracking, compared to 2.9% of Codex's and 2.1% of Claude's.
- OpenAI reads the docs.
docs-searchis 5.5% of Codex's calls, but only 0.7% of Claude Code's.
- The wizard is for setup. 64% of its tool calls are for writing (creating or updating objects), much higher than the next largest write source (WebMCP at 22%).
- Slack is almost the opposite: 78% is SQL and schema lookups, only 5% writes.
- The PostHog team makes our 11x more Slack calls per user than our customers. Our team made 39% of all Slack app calls.
AI users adopt and use PostHog more
AI is drives adoption. Our AI installation wizard is the first way that happens. 14.2% of orgs who use it to install PostHog convert to paid against 2.6% for manual installs. They adopt an average 0.88 extra products in their second month against 0.36 for manual installs.
Our MCP also helps. After the first month of using it, 28–37% of orgs added a product within two months, against 4–8% of non-adopting controls, depending on their start month and size.
AI users expand beyond product analytics more often into products like session replay, feature flags, error tracking, and logs. For orgs with over 1M events:
| Org type | Extra products in use | Orgs with 3+ extra products |
|---|---|---|
| No AI | 1.33 | 14% |
| 100+ MCP calls | 3.46 | 68% |
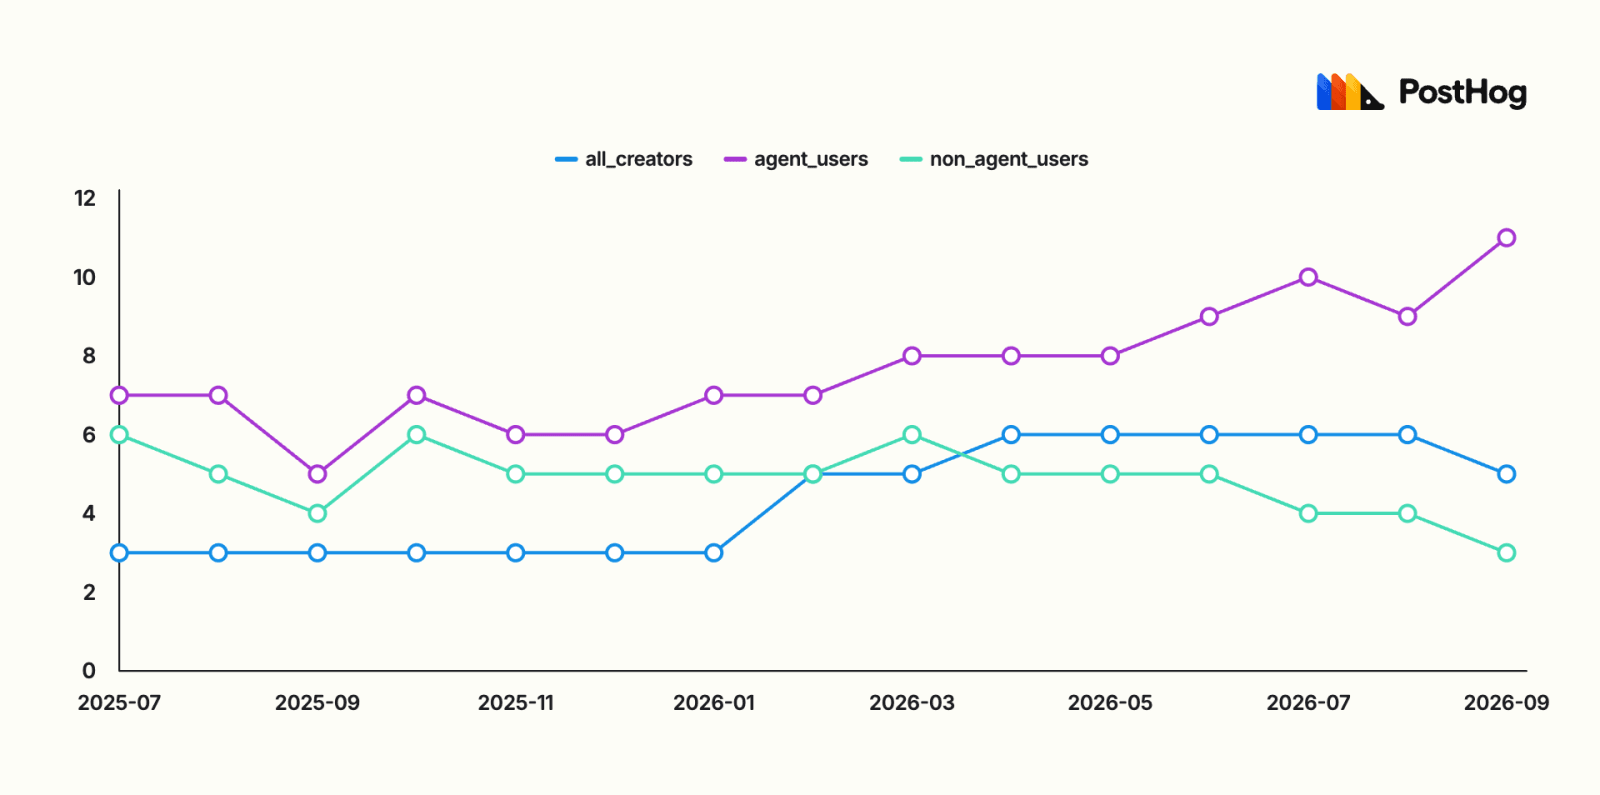
At an individual level, usage across PostHog is up too. Between July 2025 and September 2026, the median PostHog creator went from 3 objects a month to 6. AI is a big part of what's driving it. Among people who created something in both September 2025 and September 2026, those who started using agents went from a median of 5 objects created to 11. Those who didn't went from 4 to 3.
Most free orgs don't use AI. Most paying orgs do
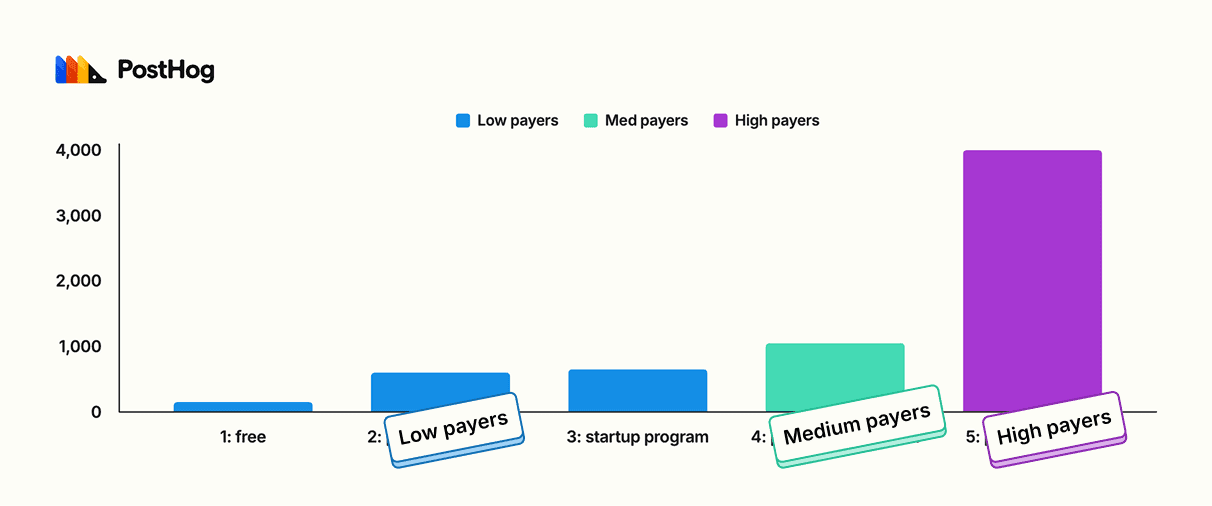
77.6% of free organizations don't use AI, but that's only 22.3% for paying orgs.
86% of Enterprise, Scale, and Teams orgs used AI. Only 9% of "big spenders" used no AI, making an average of 4,004 calls per month. Free orgs that use the MCP average 136 calls a month, but most free orgs make zero.
Our new ICP of "AI-pilled software teams" is looking pretty good right about now.
What does this means for PostHog?
Agent experience matters a lot and we're focusing on getting it right.
First, our CLI has made big jumps. In June, it only had error tracking and source map support, but since then we've matched its functionality with the MCP server. It went from 113k calls in July to 707k calls in September.
On the MCP side, tool count is up 6x since April and as of September covers 68 features from AI observability to business knowledge to access controls to billing.
| Date | MCP tools | Features covered |
|---|---|---|
| Apr 1 | 151 | 29 |
| Jun 1 | 433 | 44 |
| Jul 1 | 658 | 57 |
| Sep 1 | 909 | 68 |
For tools other than execute-sql, error rate has dropped significantly between August and September from 2.8% to 1.7%.
We're also building more UI for humans to work with AI. Notebooks were rewritten on markdown, gained AI-generated widgets you can pin to dashboards, and now show what's changed since last visit. We're also building a dedicated business intelligence product with pivots, drill-downs, and period comparisons.
Each of these are steps towards PostHog as 2030-shaped software.
PostHog is your product's context layer. With a full suite of developer tools – AI observability, product analytics, session replay, feature flags, experiments, error tracking, logs, and more – PostHog ingests and stores all the data agents need to diagnose problems, uncover opportunities, and ship fixes. A data warehouse and CDP tie it all together, unifying that context into one source agents can read across. You can steer it all from Slack, the web app, the desktop (PostHog Desktop), or your own editor via the MCP.