


MCP Analytics
Contents
@posthog/mcp instruments Model Context Protocol (MCP) servers with PostHog analytics. It's published on npm as a 0.x release while we build it in public, so the API, event names, properties, and tracing behavior may change before the SDK reaches 1.0 – pin a version and don't depend on it for production reporting yet. Both TypeScript and Python servers are supported.
PostHog also has a purpose-built MCP Analytics view – a dashboard, a sessions explorer, per-tool quality breakdowns, and intent clustering – all built on the $mcp_* events the SDK sends. It's in beta behind a feature preview: enable the MCP Analytics feature preview to turn it on. You don't have to wait for it, though – because every signal is a normal PostHog event, you can query and visualize the same data today through Product Analytics, the SQL editor, Dashboards, and Error Tracking.
MCP Analytics helps you understand how AI agents actually use the MCP server you ship: which tools get called, how often, what intent the agent had, where calls are failing, what tools the agent asked for but you don't offer yet, and how individual sessions flow end to end.
The SDK wraps your existing MCP server and emits PostHog events on every tool call, resource read, prompt fetch, and initialize handshake – no additional ingestion plumbing required.
What you can answer
- Which tools is each MCP client calling, and how often?
- What is the agent actually trying to do (
$mcp_intent)? - Which tools are advertised in
tools/listresponses but never get called? - What's the error rate and p95 latency of a given tool?
- Did an agent hit
get_more_toolsbecause the right capability didn't exist? - How does a single MCP session unfold across tool calls?
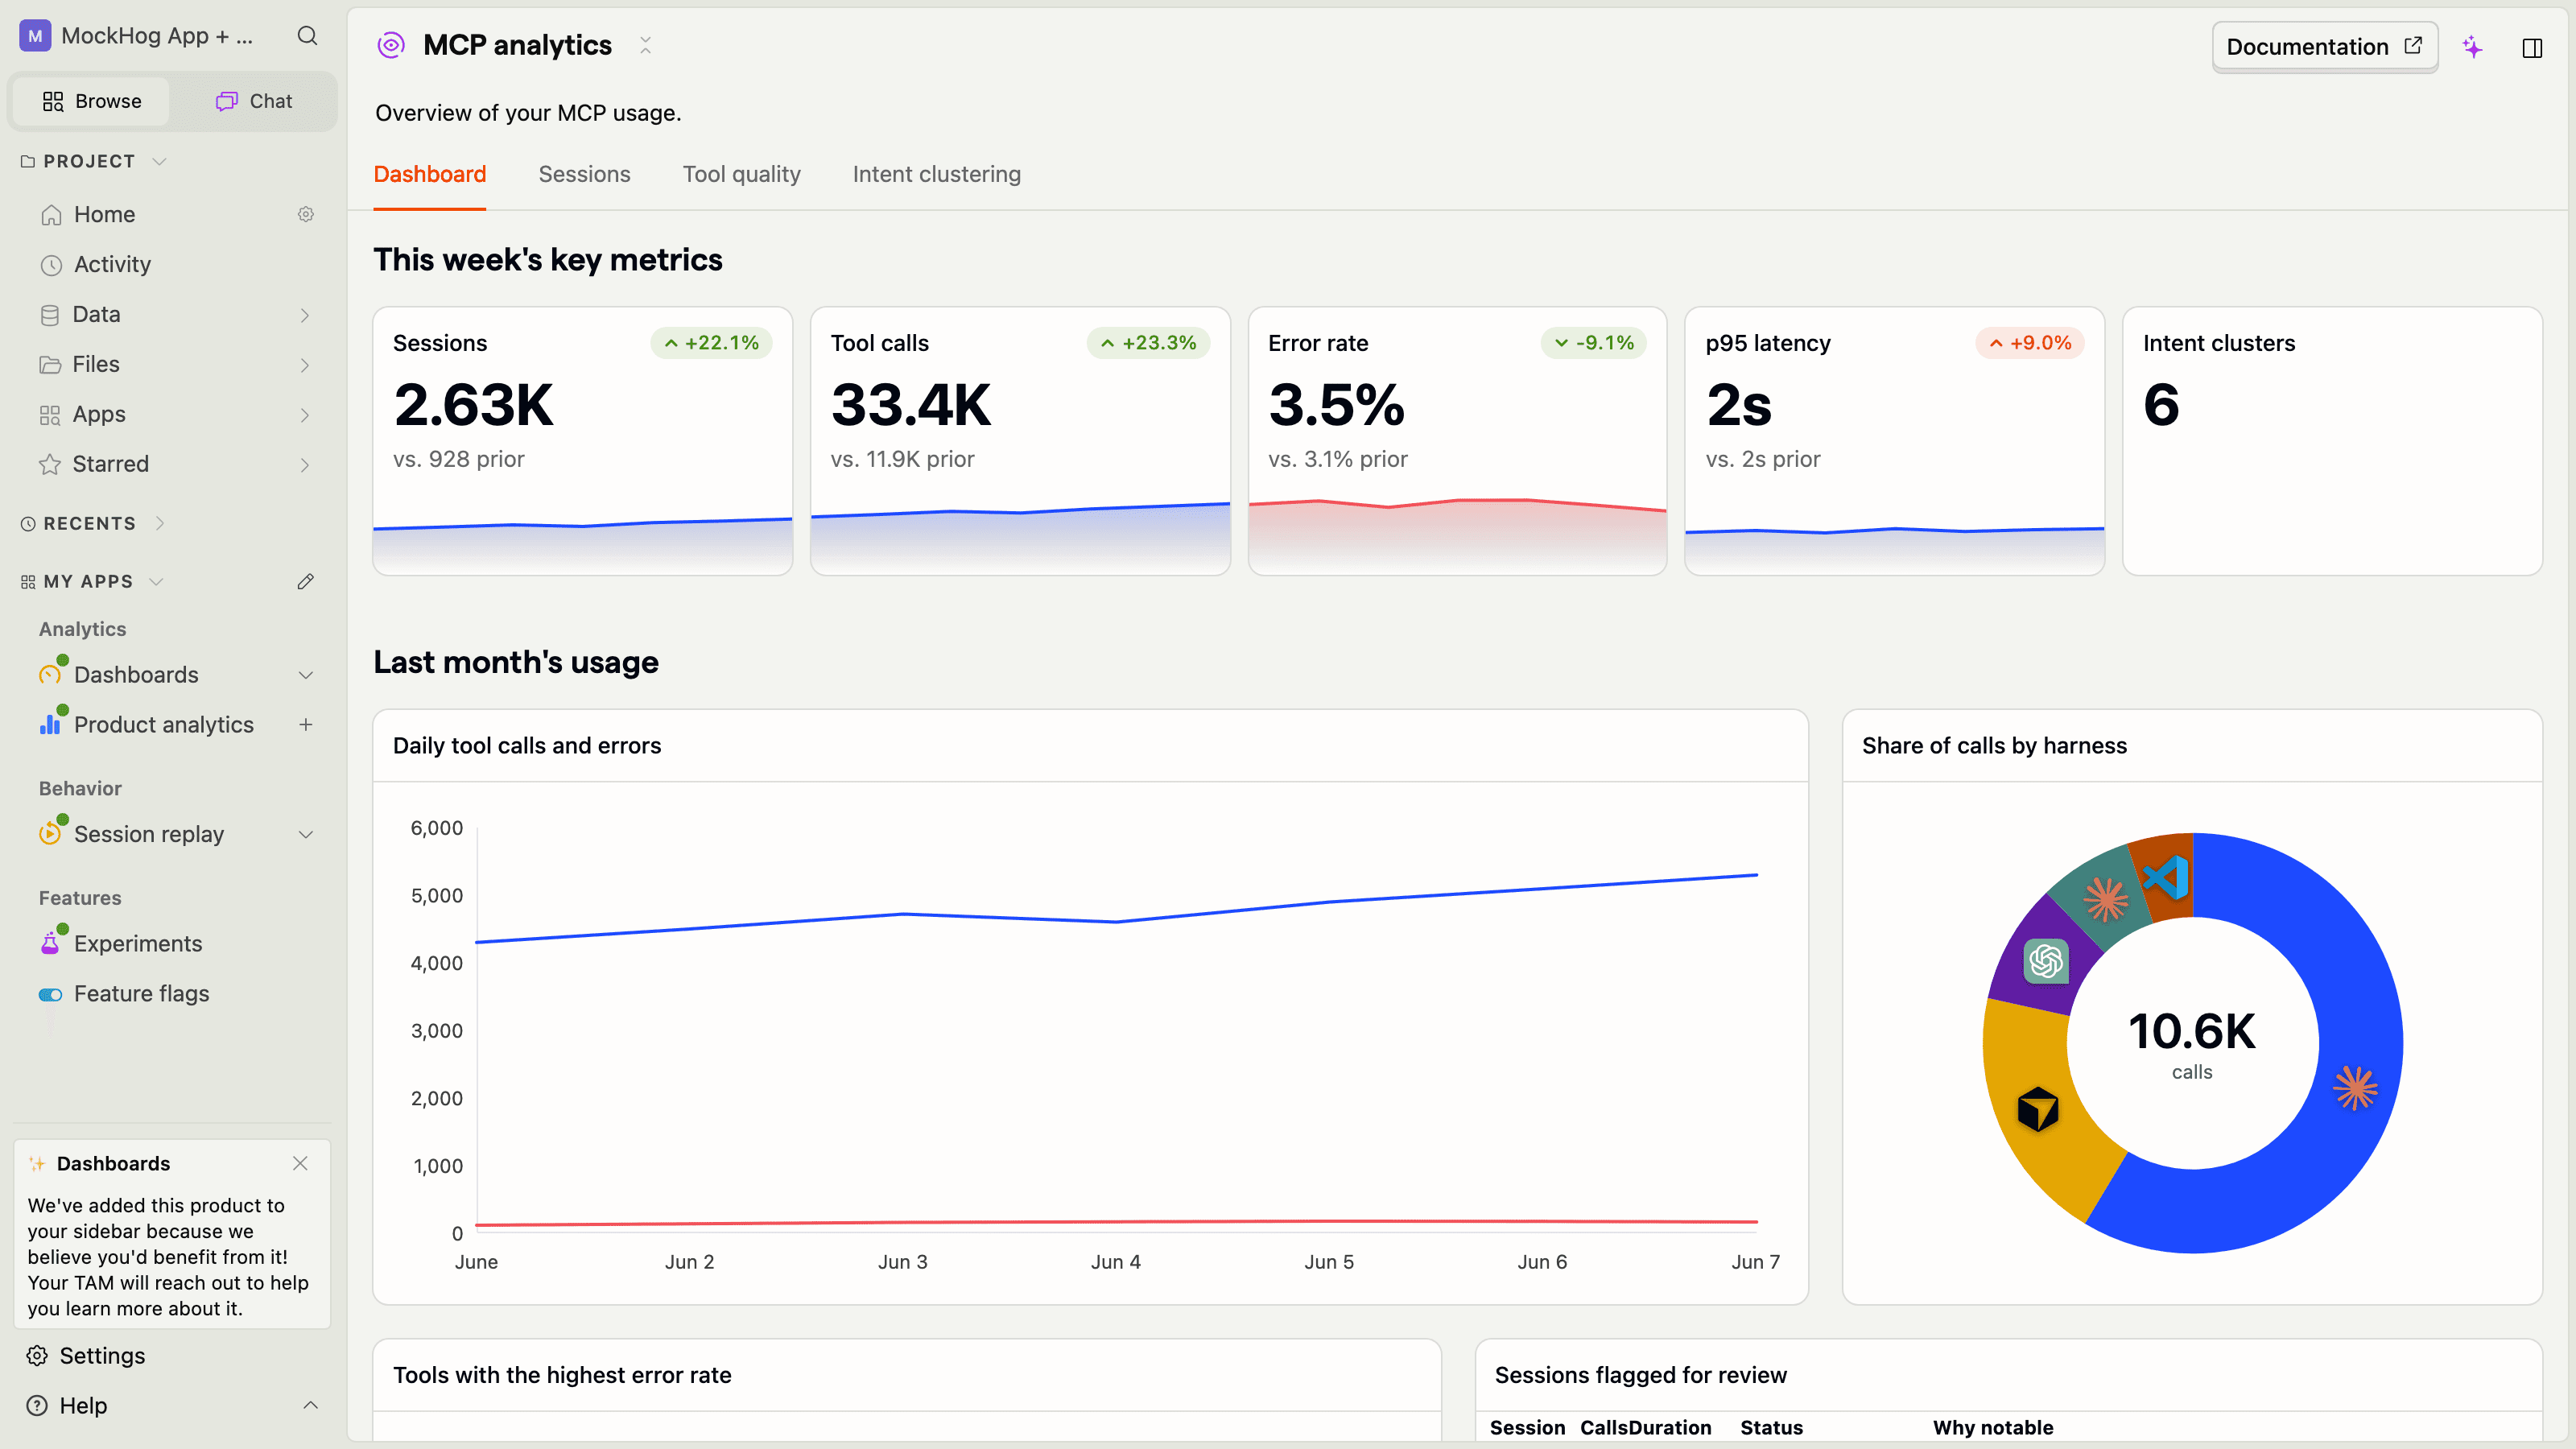
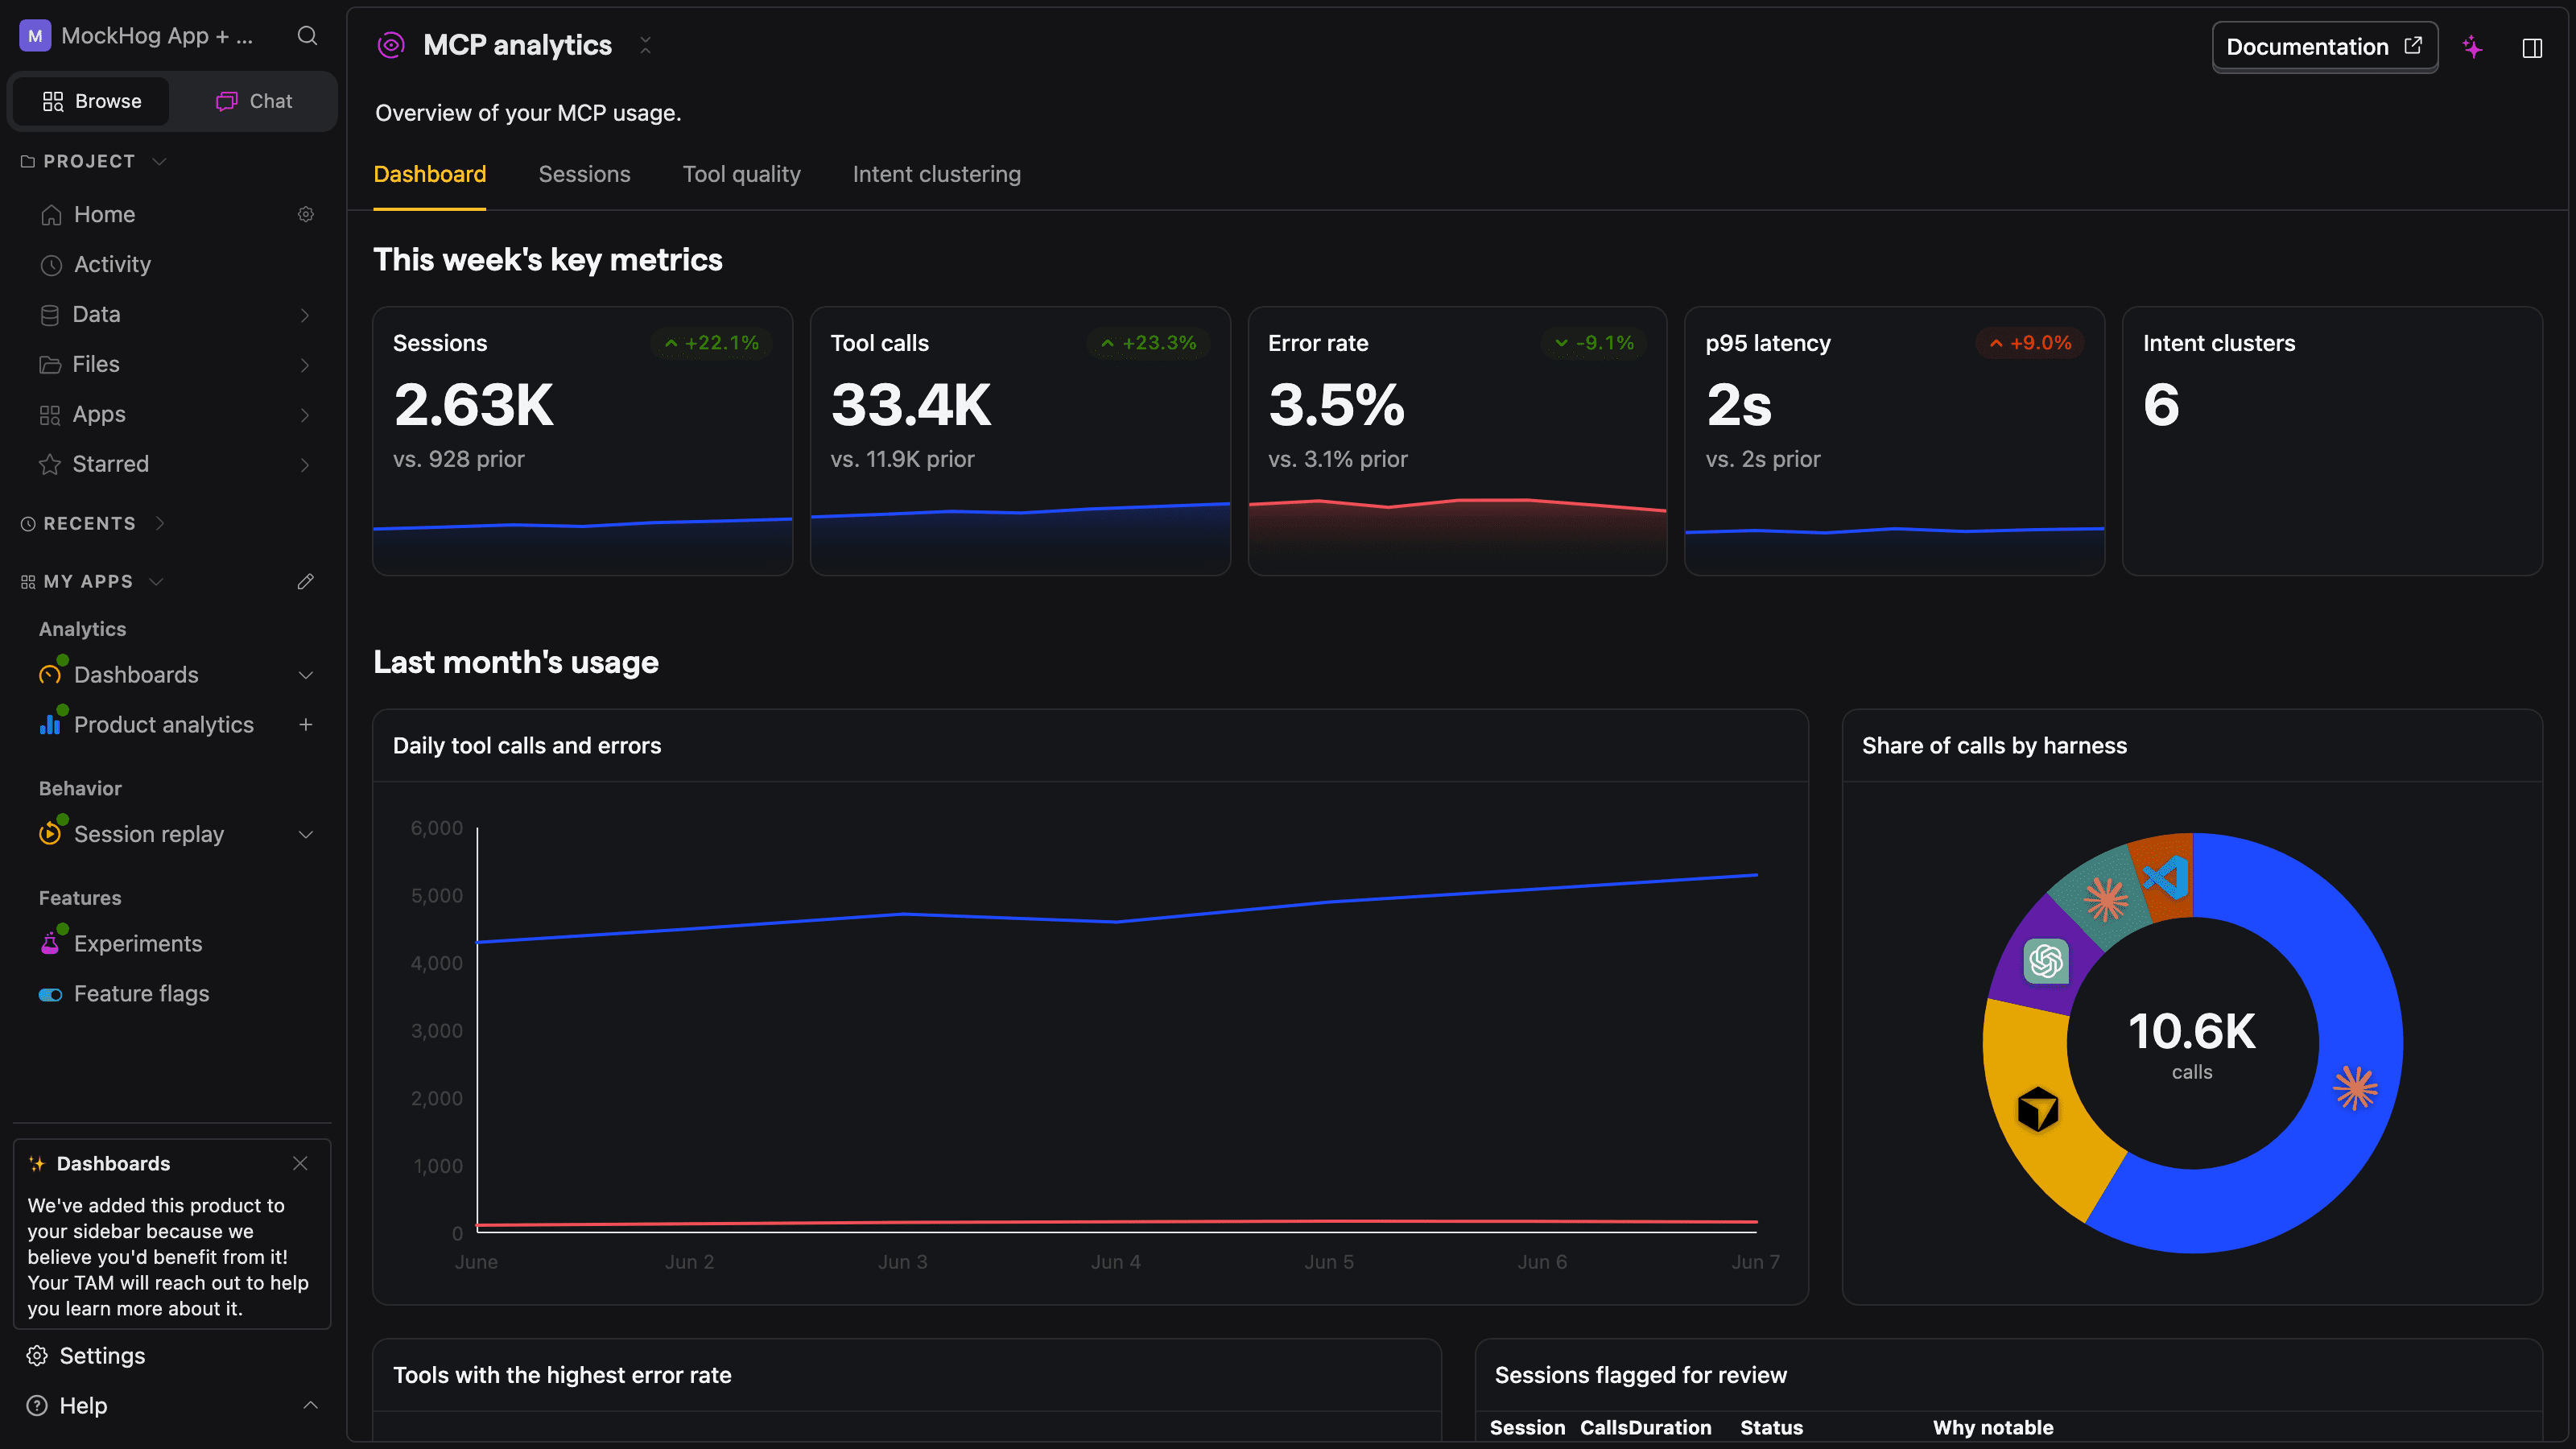
The MCP Analytics dashboard answers most of these at a glance – tool call volume, error rate, p95 latency, and the share of traffic per client:
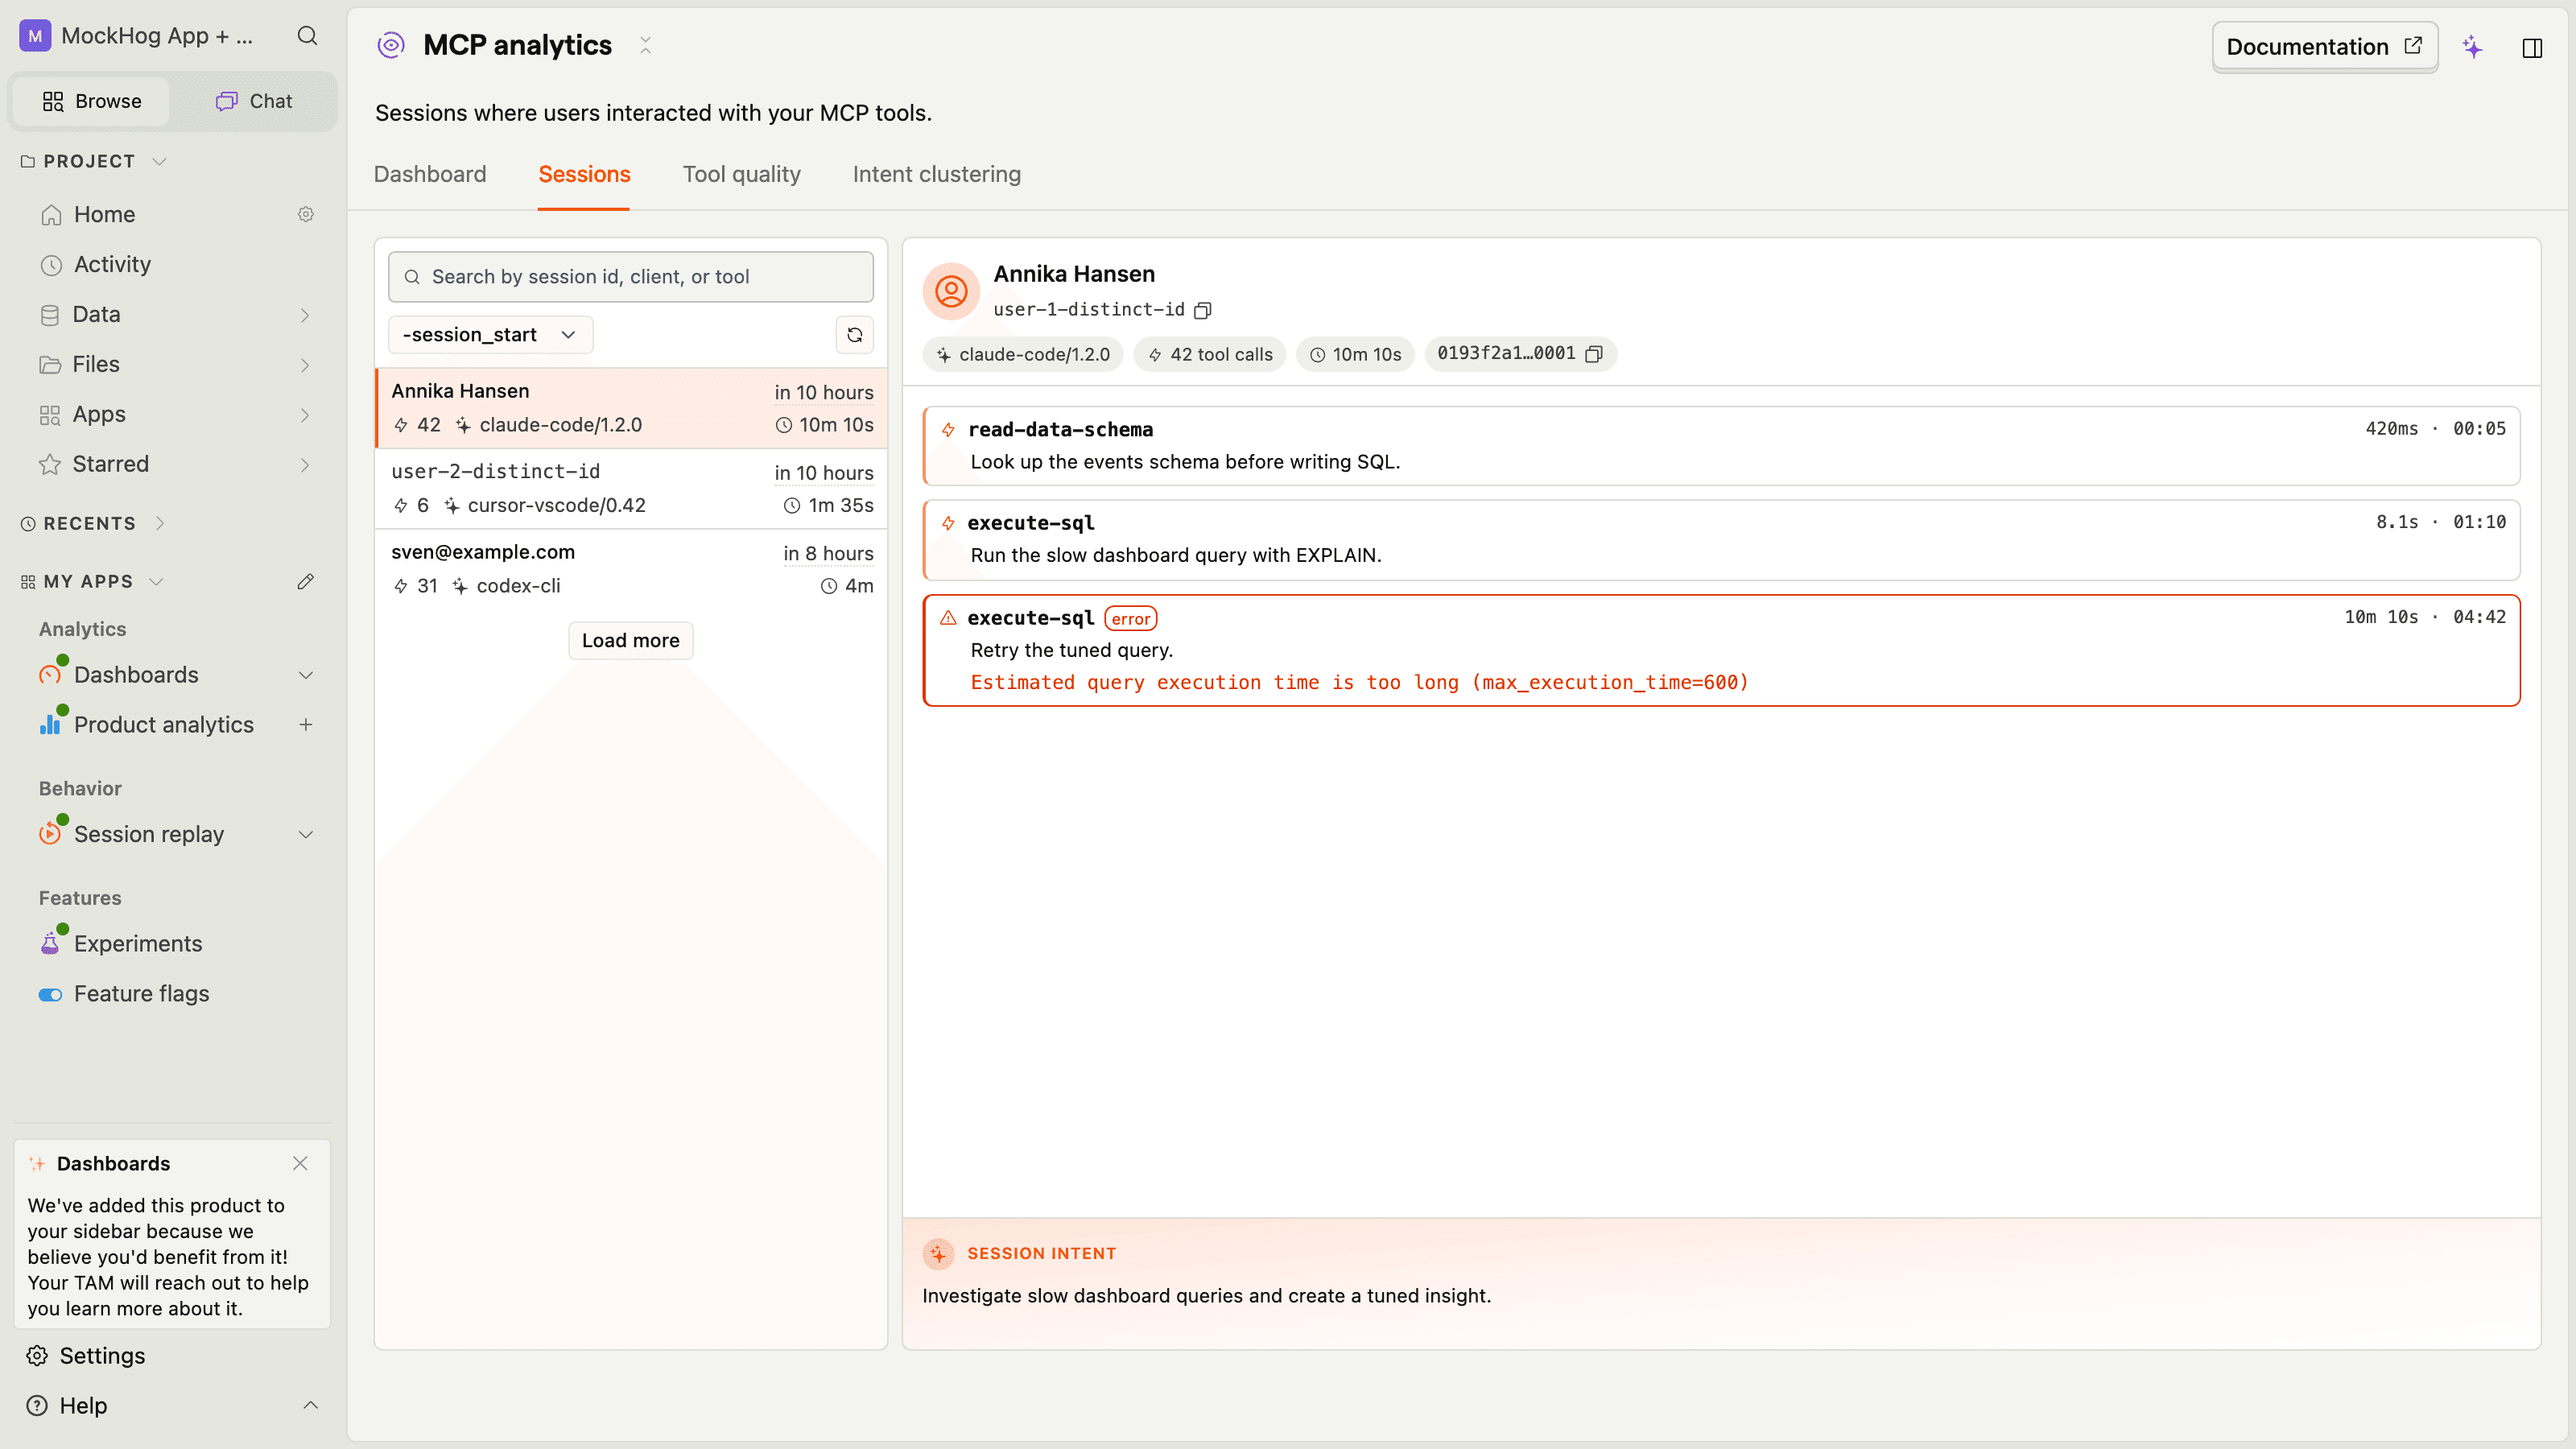
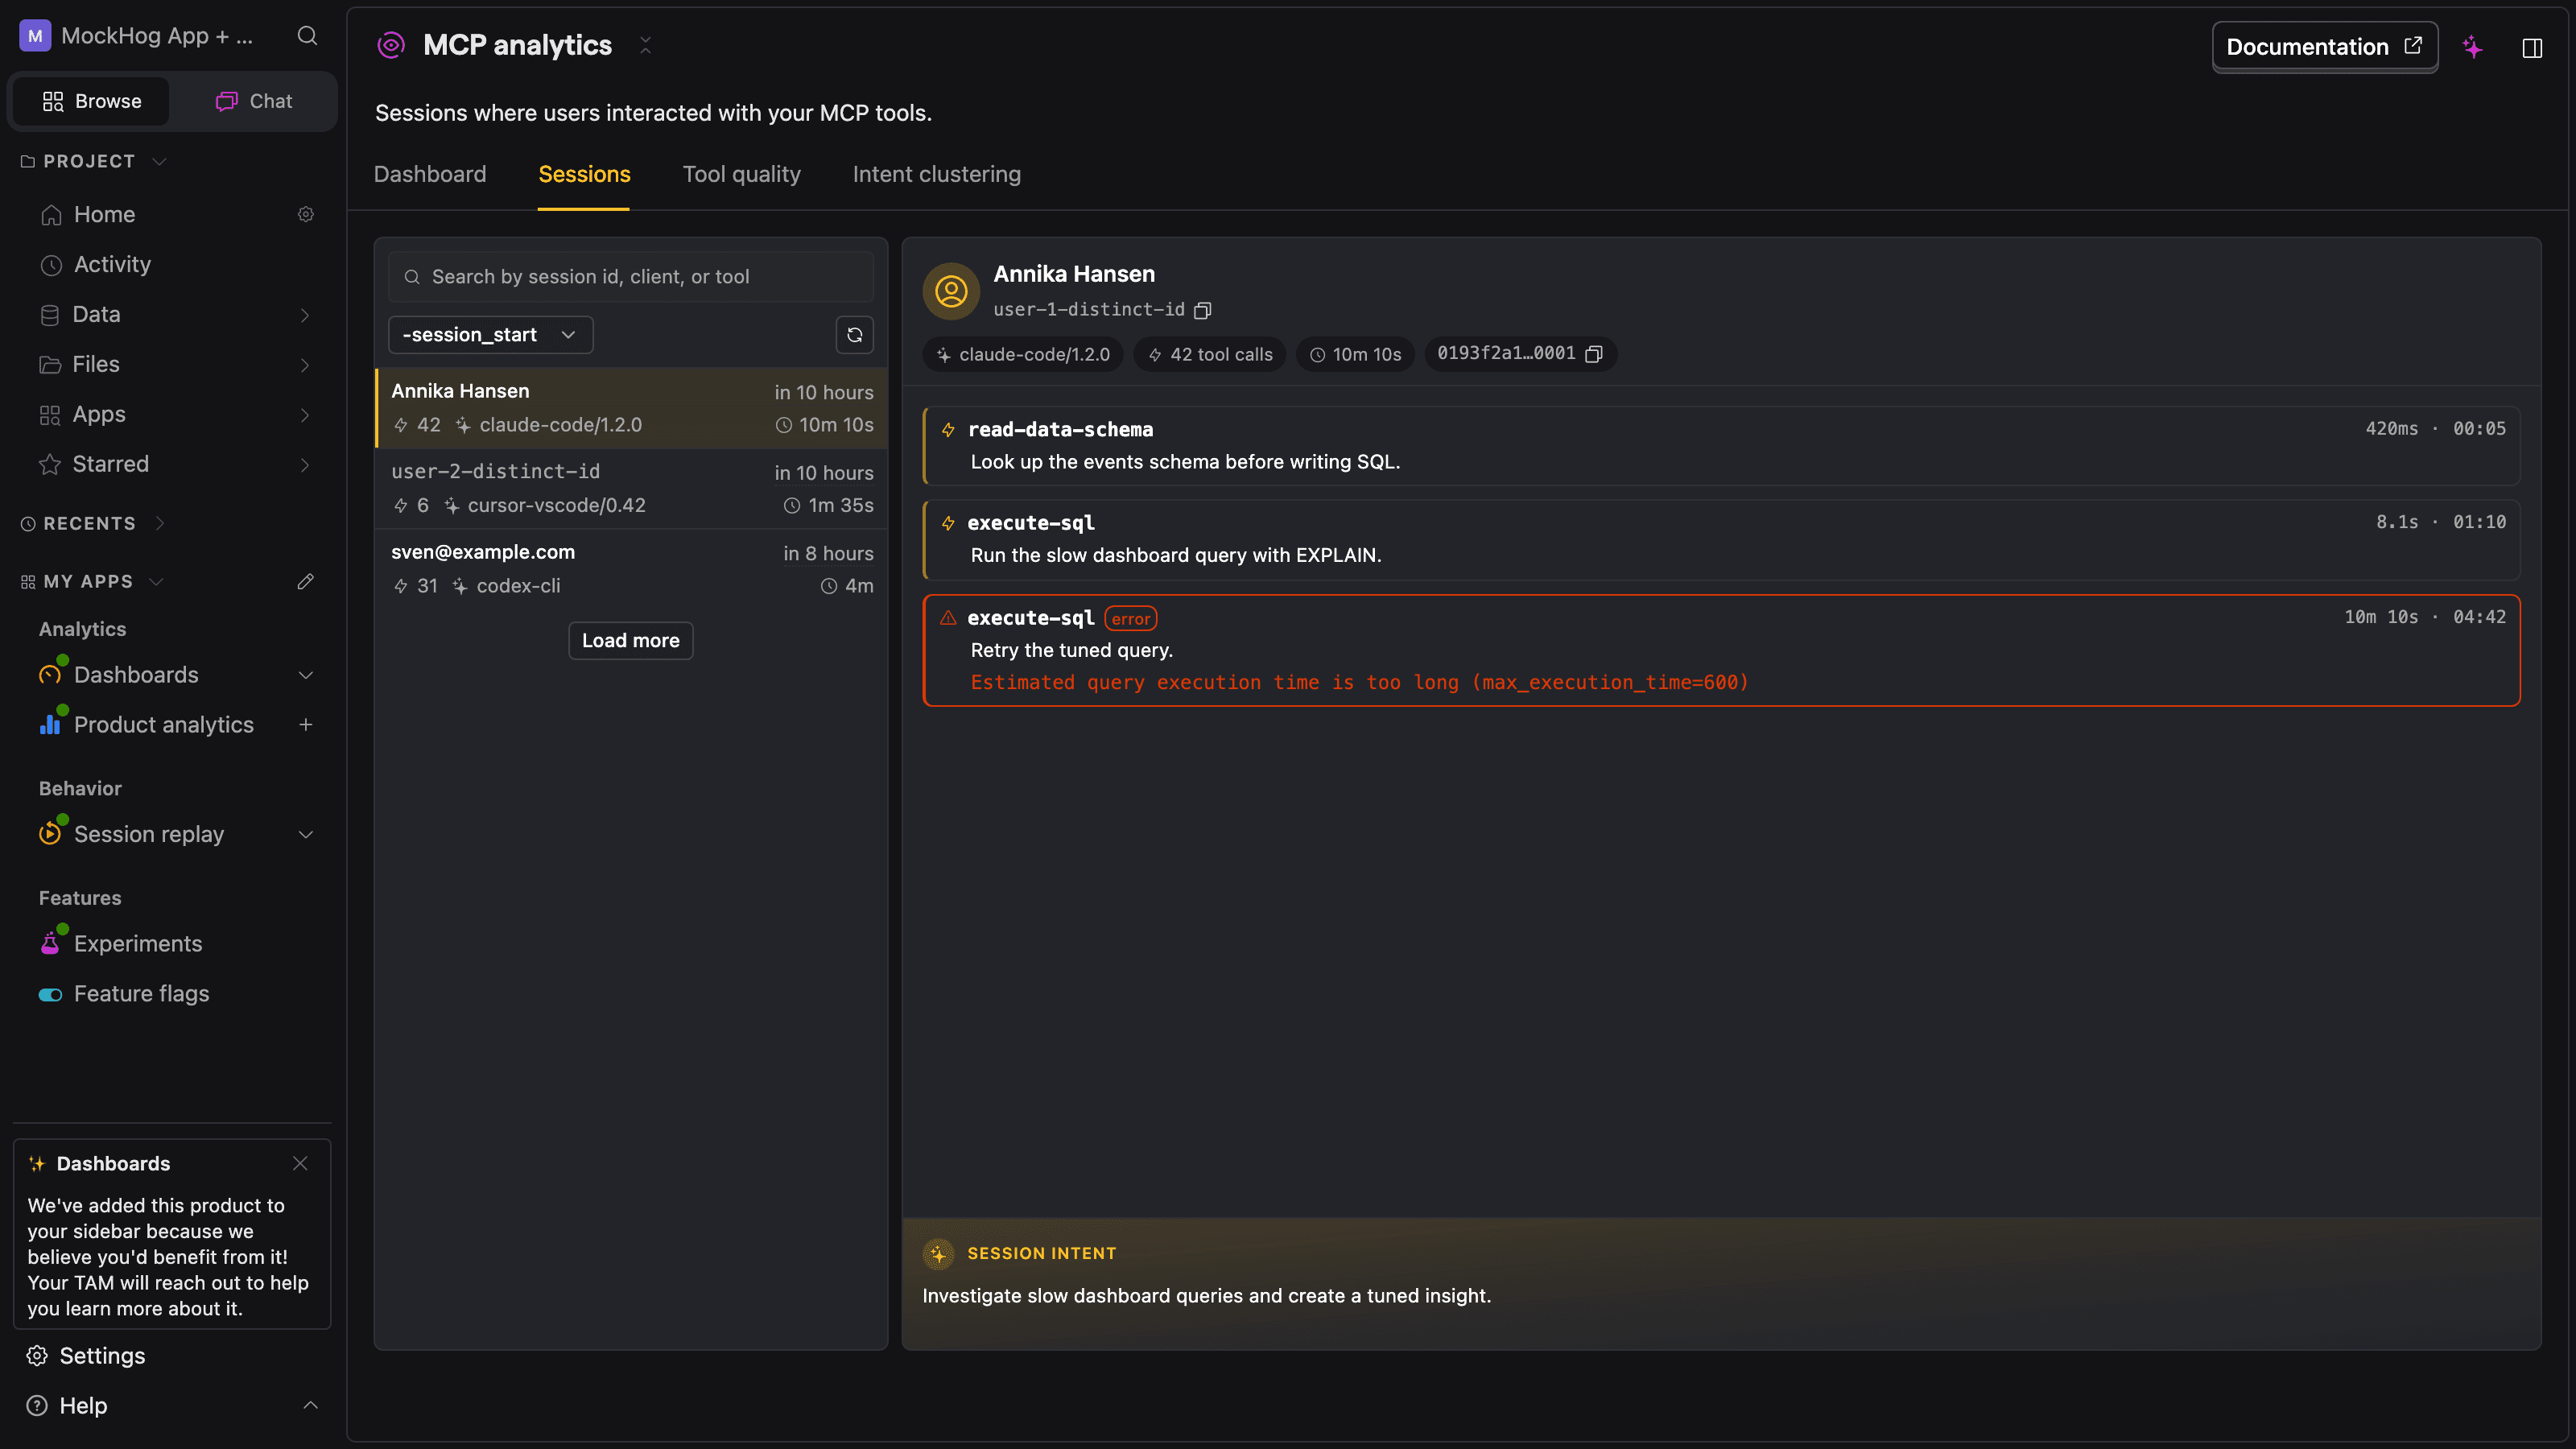
Drill into any single MCP session to step through its tool calls, intents, and errors in order:
How it works
instrument(server, posthog, options?) patches your MCP server's request handlers and returns an analytics handle. The posthog client (a posthog-node instance) is a required positional argument. When the agent calls a tool, the SDK:
- Builds a structured event with the tool name, parameters, response, duration, and error state.
- Runs the payload through sanitization (image/audio/binary stubs, sensitive-key masking), truncation, and your optional
beforeSendhook. - Sends it to PostHog via the
posthog-nodeclient you pass in, batched and flushed by that client.
Your tool handlers are untouched. The only payload change the agent sees is an optional injected context argument (see Capturing agent intent) and an optional injected conversation_id argument (see Conversation IDs).
Quick install
That's the minimum. With this in place, every tools/call, tools/list, initialize, resources/read, and prompts/get request emits a PostHog event prefixed with $mcp_*.
Where to go next
- Getting started – the guided onboarding flow
- Installation – full setup, server type variants, BYO PostHog client
- Custom servers –
PostHogMCPfor Hono/edge dispatchers with no server object to wrap - Capturing agent intent – the
contextargument andintentFallback - Conversation IDs – stitching multi-turn conversations together
- Identifying users – attaching events to your own users
- Missing capability tracking – the
get_more_toolsvirtual tool - Custom events and metadata –
analytics.capture()andeventProperties - Privacy and redaction – what's sanitized automatically, customer redaction hook
- Event and property reference – every event the SDK emits and what's on it
- Sample queries – HogQL recipes for the most common dashboards
Building in public
The SDK source lives in the posthog-js monorepo alongside the rest of PostHog's JavaScript and TypeScript SDKs. Issues, PRs, and feedback are welcome. We started from a duplicated copy of the MIT-licensed MCPcat TypeScript SDK – the event schema, identity model, and feature surface have since diverged.