





Find the span that broke, then fix it
Install with AI in a single prompt
Paste into your terminal or code editor and make AI do the work.
What does it do?
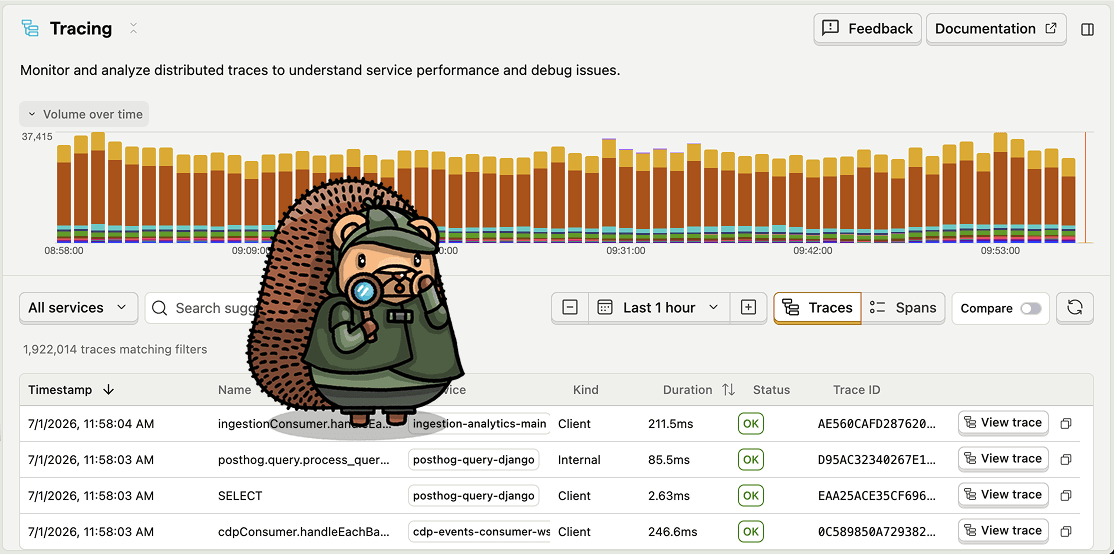
A trace times one request through every service it touches. Open the waterfall and there’s the slow query six services deep, or the async job a stack trace gives up on. Traces come in over the same OpenTelemetry setup as Logs, so one install covers both. Traces get you to where a request went wrong, and the logs from that span tell you why.
Who is it for?
How do I use it?
Read traces from your editor
The PostHog MCP server gives coding agents direct access to your spans. Ask your agent which service is slow, have it pull the trace behind a request, and fix the span it points at, without leaving your editor.
Top features
Every span of a request, in one waterfall
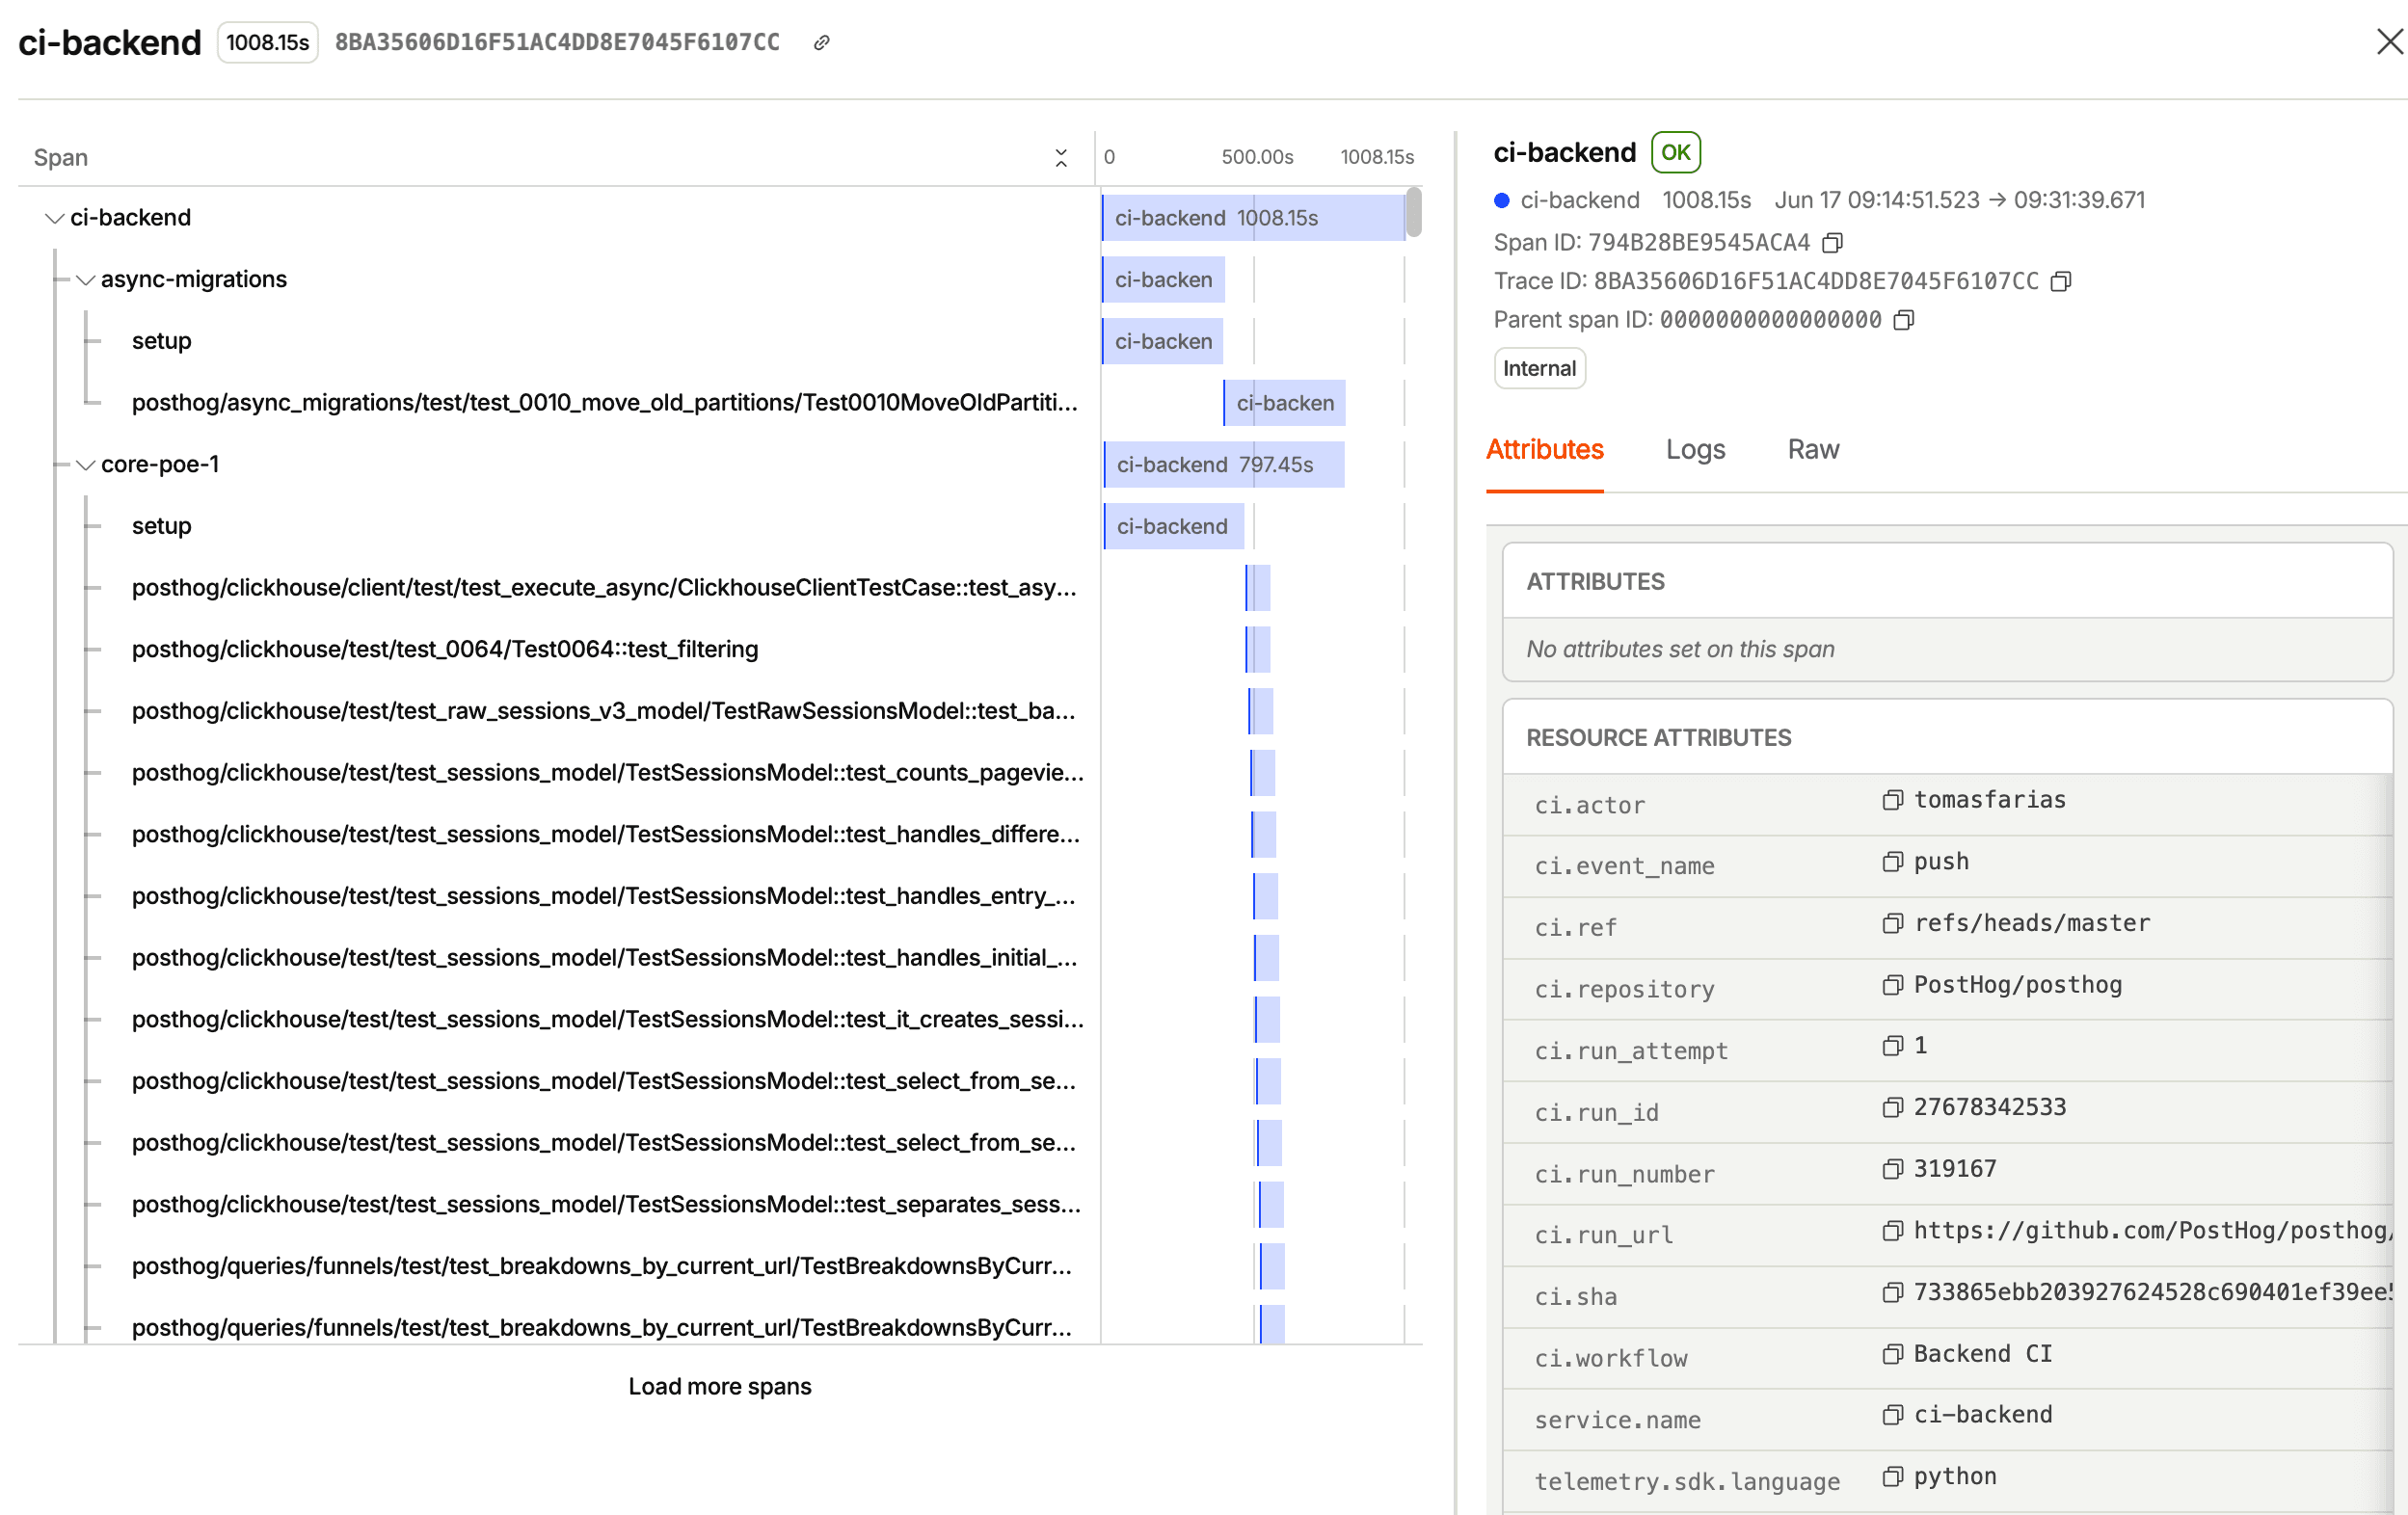
One request becomes a tree of spans across every service, queue, and third-party call it touches.
Follow the trace_id to see where the time went and which span actually broke, even across async boundaries, where stack traces give up.
AI prompts
Query spansquery-apm-spans
Read a traceapm-trace-get
Latency over timeapm-spans-latency-heatmap
Duration distributionapm-spans-duration-histogram
Call treeapm-spans-tree
Services and attributesapm-services-list
Install
Tracing is built on OpenTelemetry, so any OTLP-compatible exporter works. There are no PostHog-specific tracing packages to adopt. Point your existing OpenTelemetry setup at PostHog and spans start arriving.
Web frameworks
Popular



All





















Feature comparison
Works with other PostHog tools
Use Tracing with these other PostHog apps to maximize shareholder value.