Sample queries

Contents

Use these HogQL queries after you install the SDK and capture $mcp_tool_call events. See the event reference for property definitions.

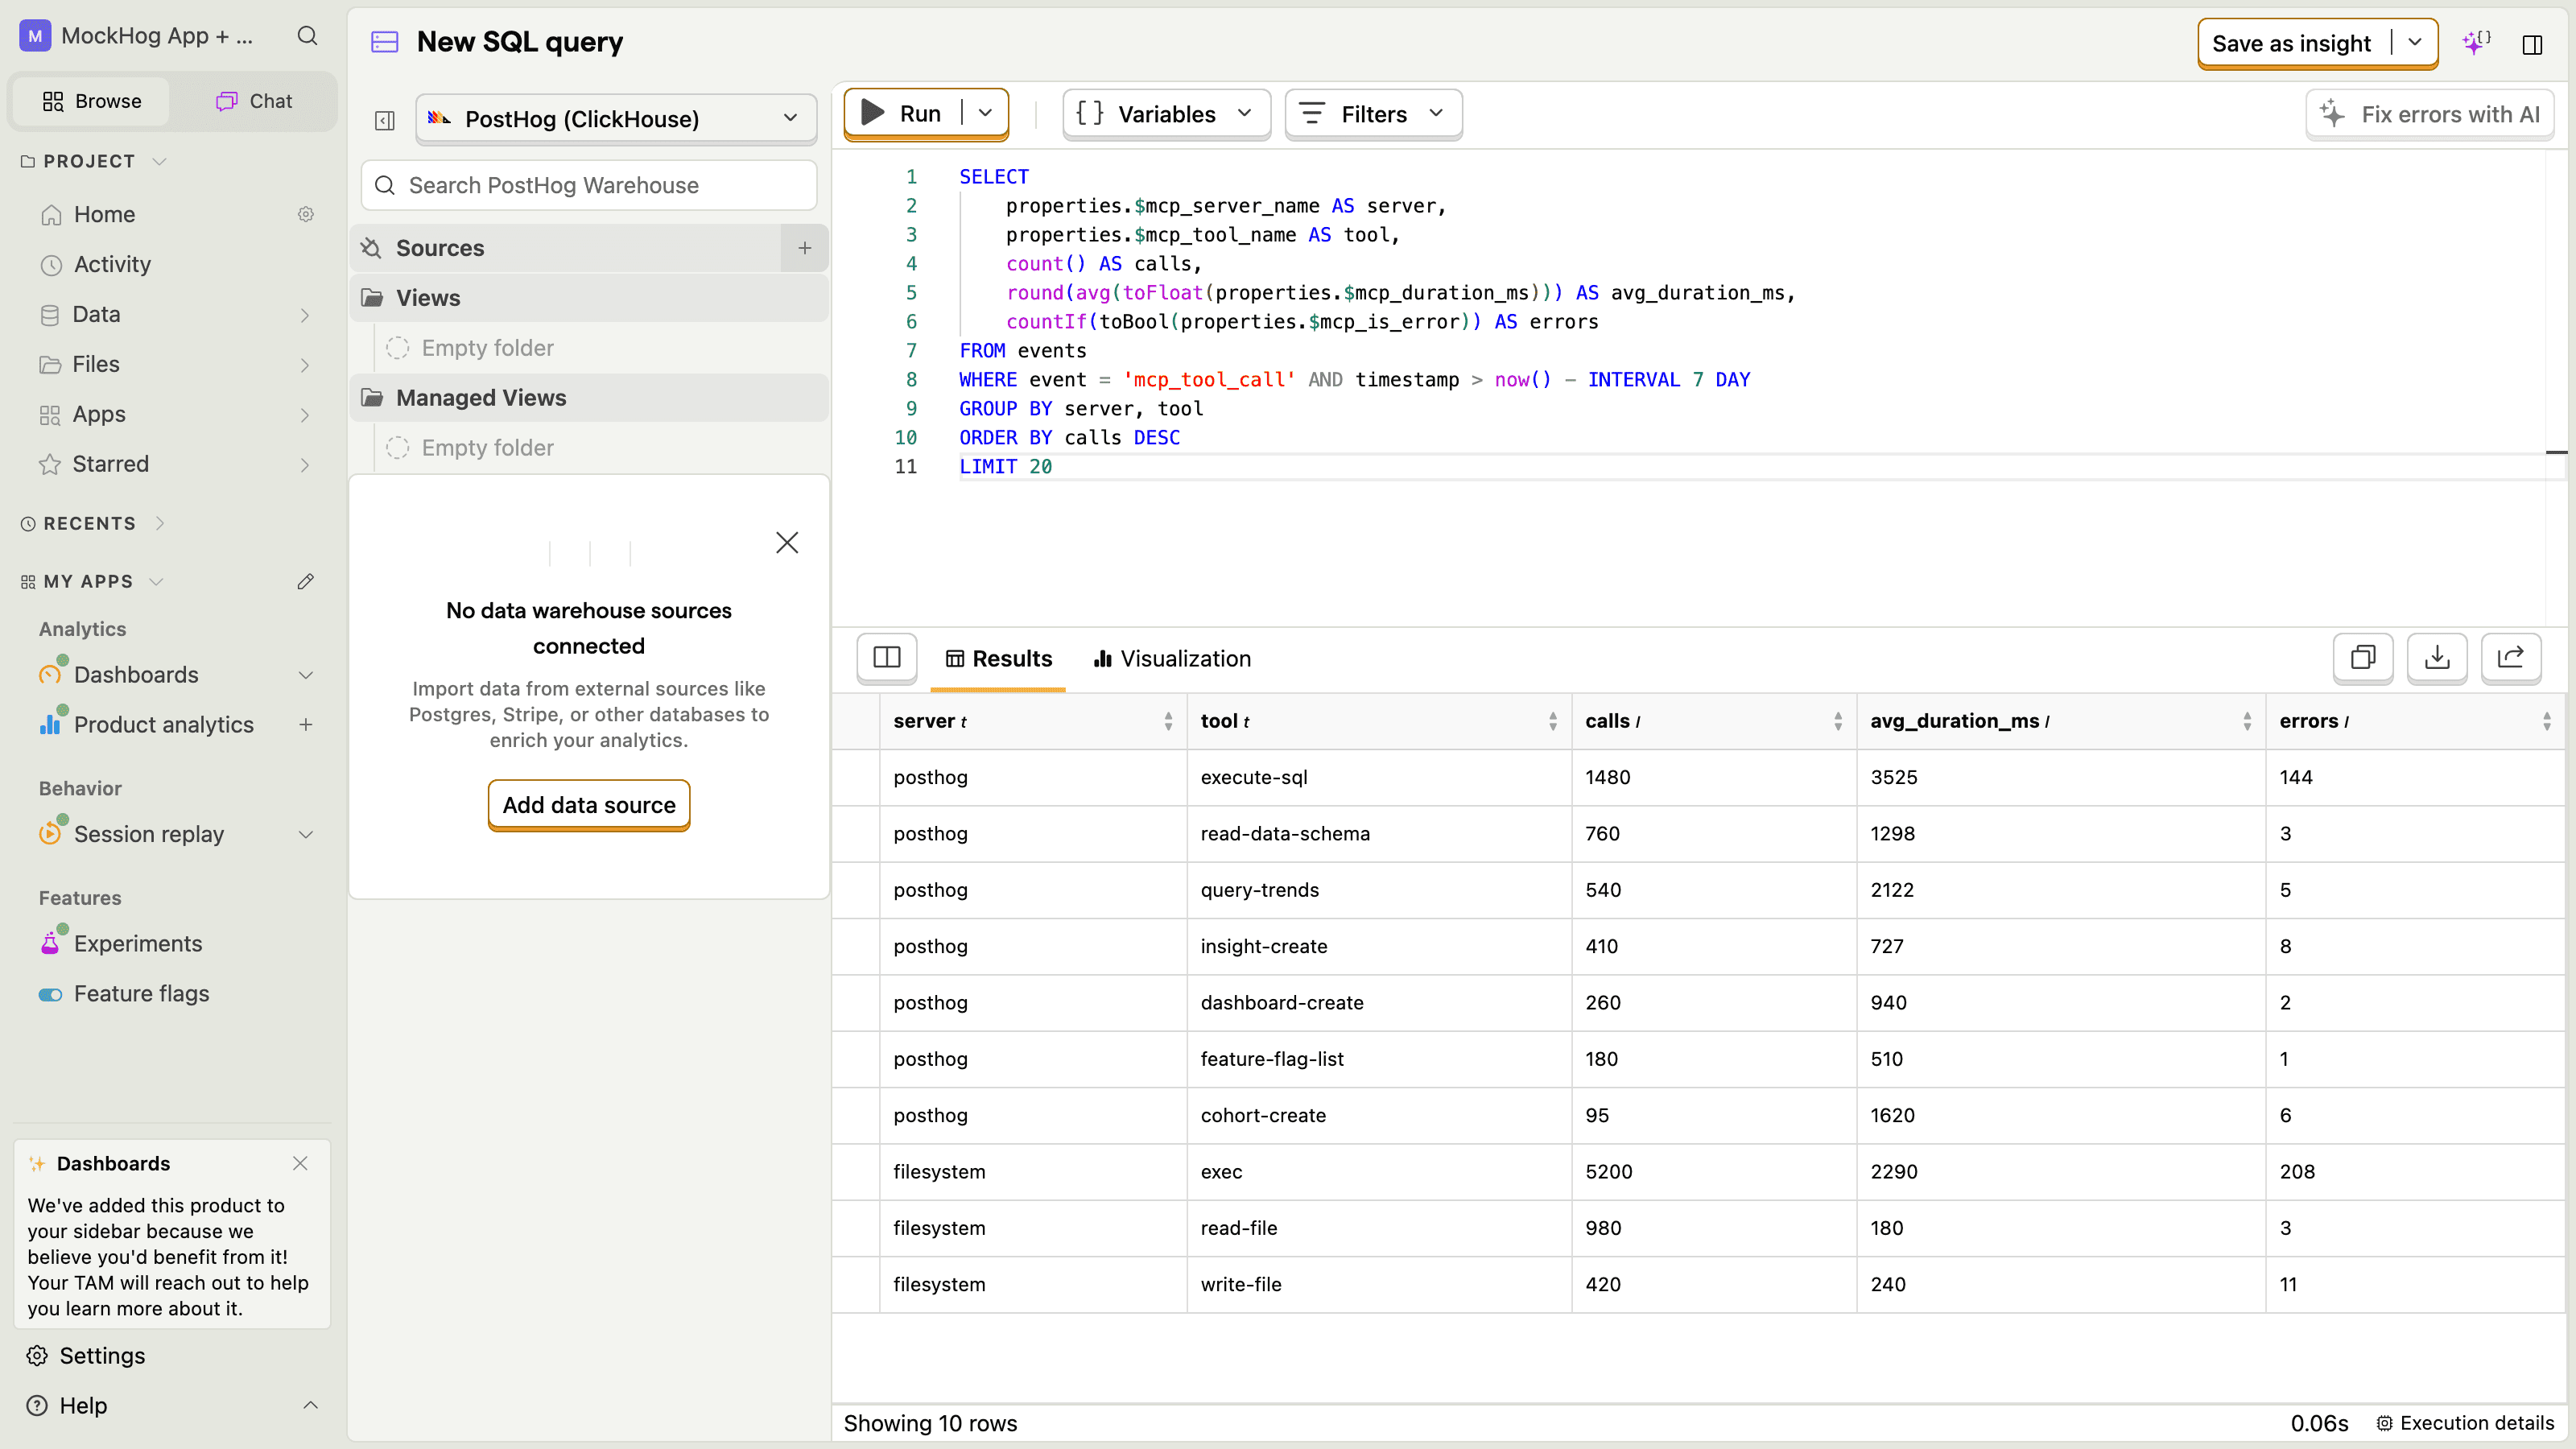
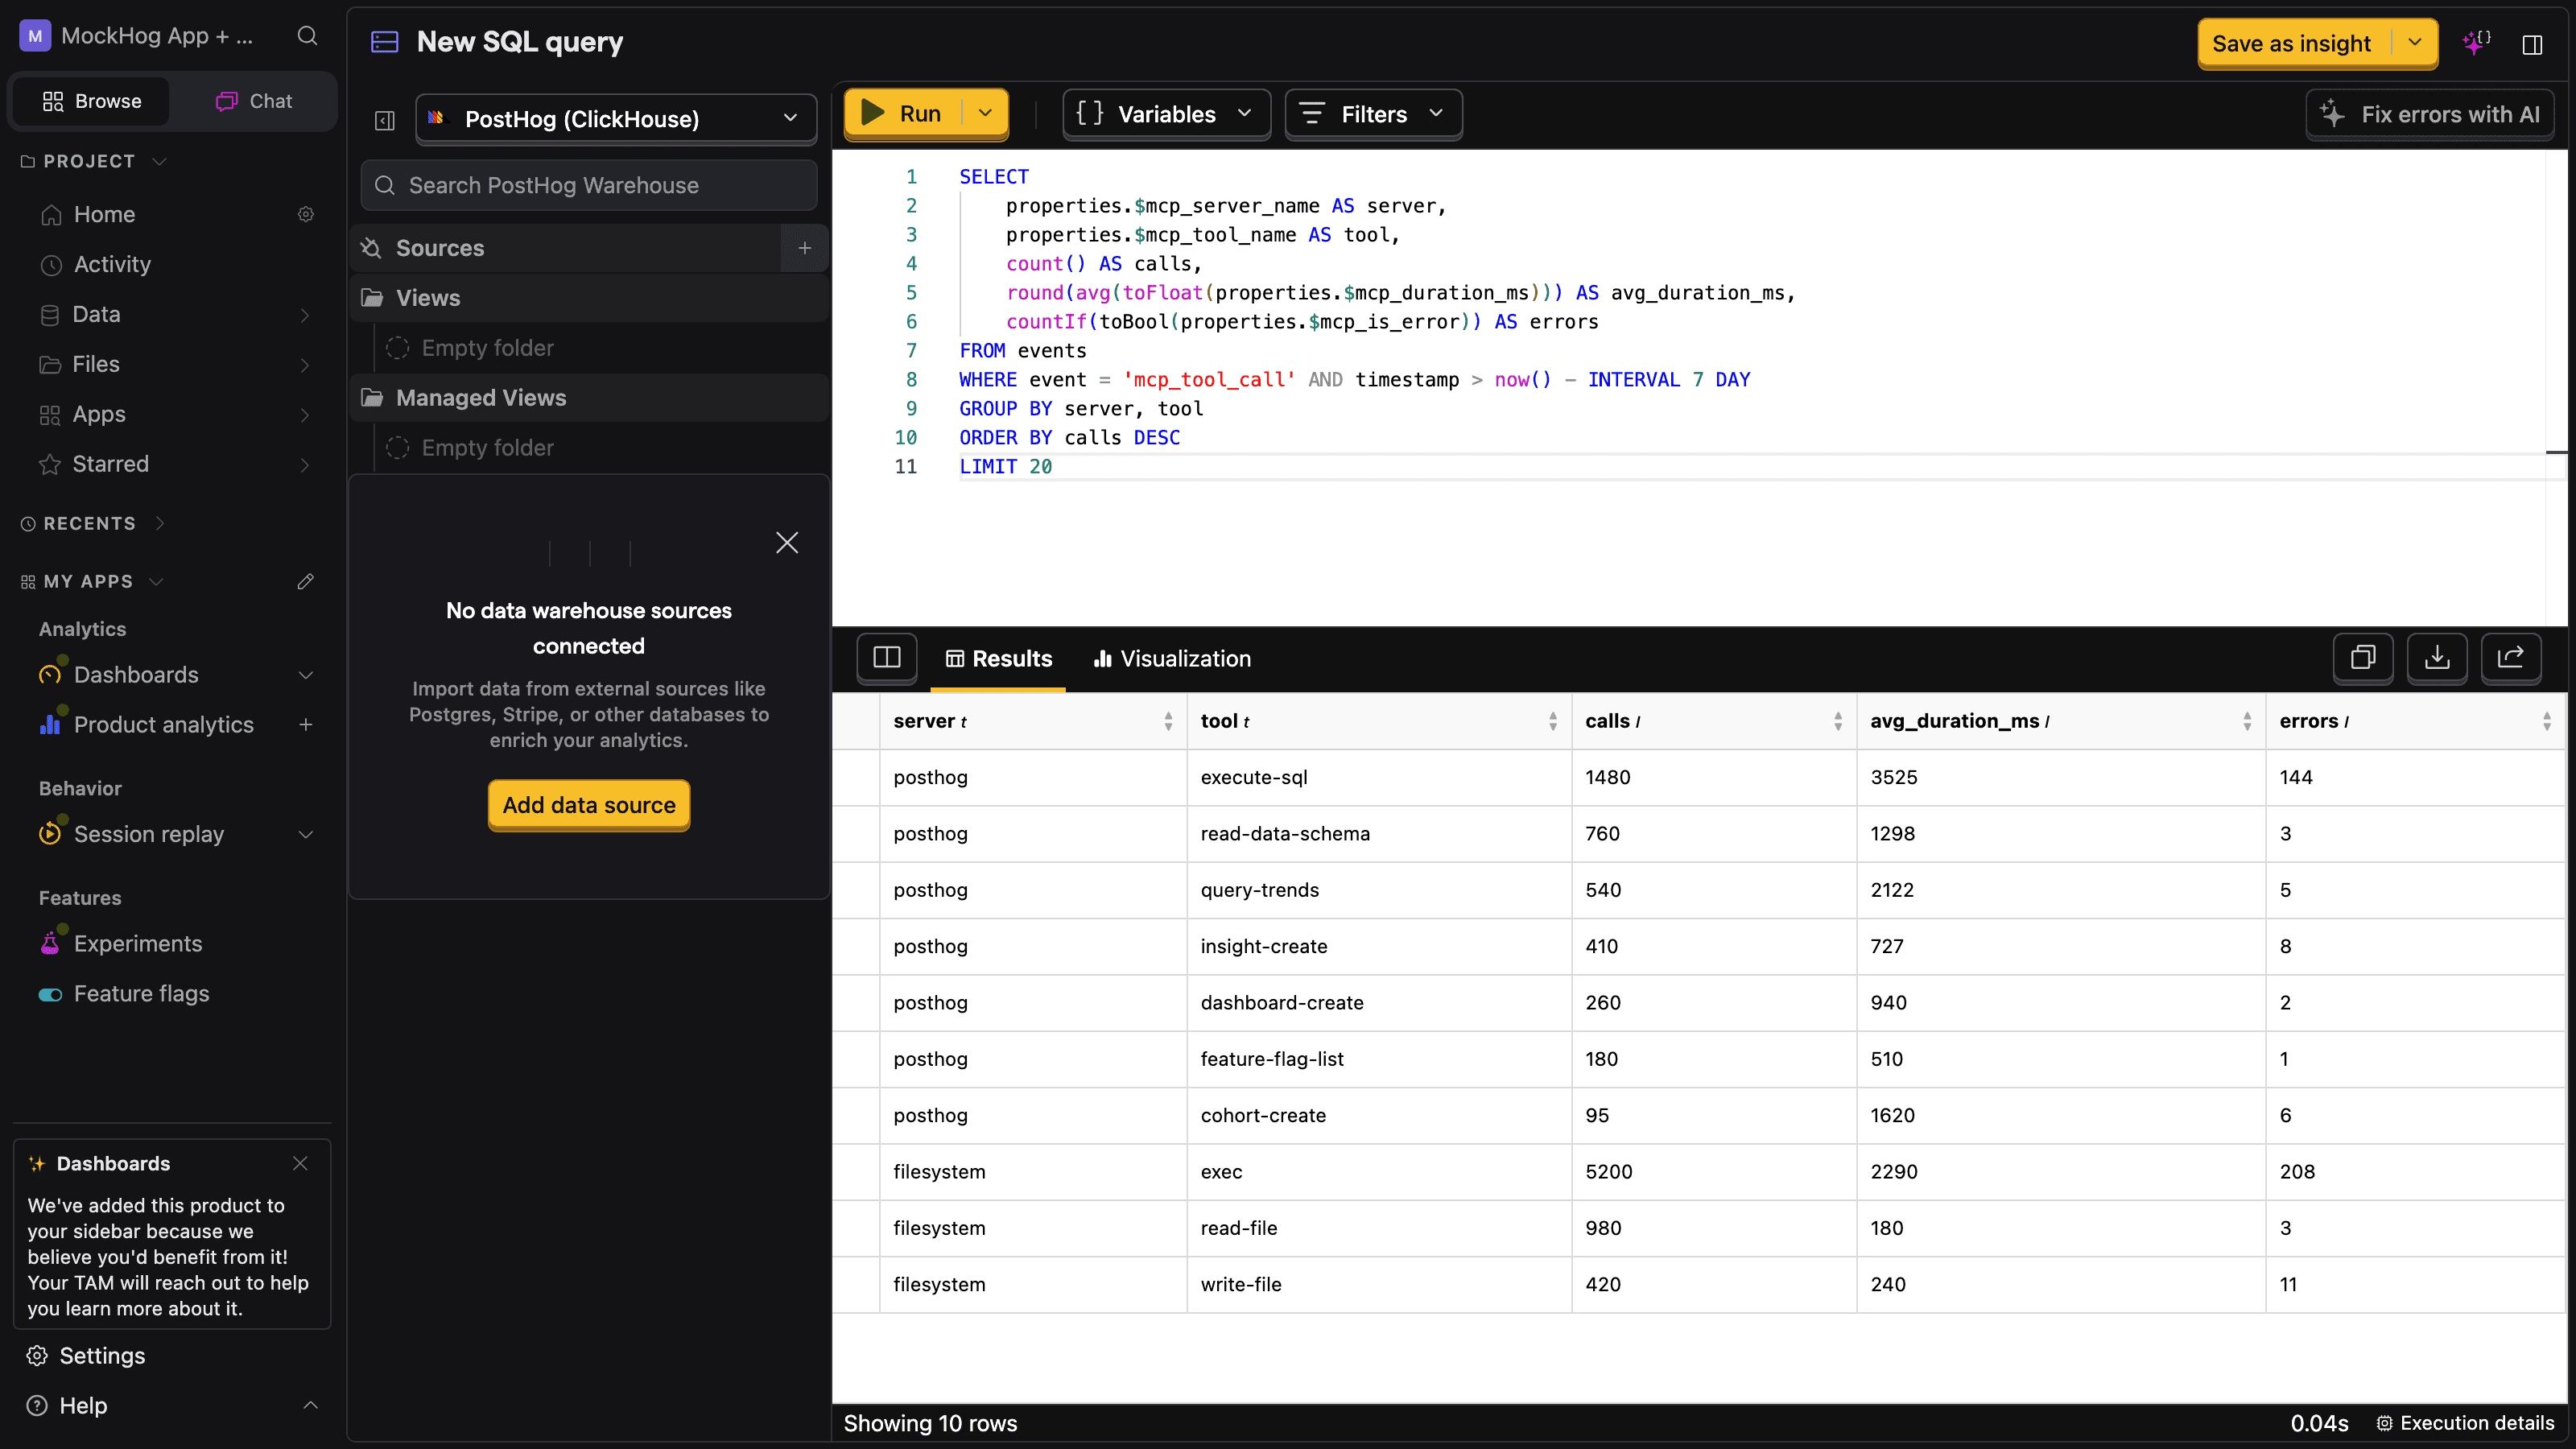
PostHog SQL editor running the top tools per server query against $mcp_tool_call events, with results grouped by server and tool

Top tools per server

SQL
SELECT
properties.$mcp_server_name AS server,
properties.$mcp_tool_name AS tool,
count() AS calls
FROM events
WHERE event = '$mcp_tool_call'
AND timestamp > now() - INTERVAL 7 DAY
GROUP BY server, tool
ORDER BY calls DESC
LIMIT 50

Error rate per tool

SQL
SELECT
properties.$mcp_tool_name AS tool,
countIf(properties.$mcp_is_error) AS errors,
count() AS total,
countIf(properties.$mcp_is_error) / count() AS error_rate
FROM events
WHERE event = '$mcp_tool_call'
AND timestamp > now() - INTERVAL 7 DAY
GROUP BY tool
ORDER BY total DESC

P95 latency per tool

SQL
SELECT
properties.$mcp_tool_name AS tool,
quantile(0.95)(toFloat(properties.$mcp_duration_ms)) AS p95_ms
FROM events
WHERE event = '$mcp_tool_call'
AND timestamp > now() - INTERVAL 7 DAY
GROUP BY tool
ORDER BY p95_ms DESC

Intent samples split by source

How much of your traffic is supplying explicit context vs falling back to your intentFallback callback?

SQL
SELECT
properties.$mcp_intent_source AS source,
properties.$mcp_tool_name AS tool,
any(properties.$mcp_intent) AS sample_intent,
count() AS calls
FROM events
WHERE event = '$mcp_tool_call'
AND timestamp > now() - INTERVAL 24 HOUR
GROUP BY source, tool
ORDER BY calls DESC

Active sessions per client

Conversation IDs are on by default, but clients must echo the handle to group calls across requests. Clients that ignore it can inflate the session count.

SQL
SELECT
properties.$mcp_client_name AS client,
uniq(properties.$session_id) AS sessions
FROM events
WHERE event IN ('$mcp_initialize', '$mcp_tool_call')
AND timestamp > now() - INTERVAL 7 DAY
GROUP BY client
ORDER BY sessions DESC

Advertised tools that never get called

This query finds tools in tools/list responses that agents never called.

SQL
WITH listed AS (
SELECT DISTINCT arrayJoin(properties.$mcp_listed_tool_names) AS tool_name
FROM events
WHERE event = '$mcp_tools_list'
AND timestamp > now() - INTERVAL 30 DAY
),
called AS (
SELECT DISTINCT properties.$mcp_tool_name AS tool_name
FROM events
WHERE event = '$mcp_tool_call'
AND timestamp > now() - INTERVAL 30 DAY
)
SELECT tool_name AS zombie_tool
FROM listed
WHERE tool_name NOT IN (SELECT tool_name FROM called)
ORDER BY tool_name

Unmet user requests (requires reportMissing: true)

What were users trying to do that your tools couldn't satisfy?

SQL
SELECT
properties.$mcp_intent AS unmet_request,
properties.$mcp_client_name AS client,
count() AS times_asked
FROM events
WHERE event = '$mcp_missing_capability'
AND timestamp > now() - INTERVAL 30 DAY
GROUP BY unmet_request, client
ORDER BY times_asked DESC
LIMIT 50

Tool call volume by client and tool, daily

Use this query to show daily call volume on a dashboard.

SQL
SELECT
toDate(timestamp) AS day,
properties.$mcp_client_name AS client,
properties.$mcp_tool_name AS tool,
count() AS calls
FROM events
WHERE event = '$mcp_tool_call'
AND timestamp > now() - INTERVAL 30 DAY
GROUP BY day, client, tool
ORDER BY day DESC, calls DESC

Still have questions?

Was this page useful?