


Getting started with MCP Analytics
@posthog/mcp is published as a 0.1.x release on npm. We're building it in public – the event shape, options, and tracing behavior may still change before 1.0. Pin a specific version and don't depend on it for production reporting yet.
Add @posthog/mcp to your MCP server
MCP Analytics gives you visibility into how AI agents actually use the MCP server you ship. With one wrapper call you can track:
- 🛠️ Every tool call (parameters, response, duration, errors)
- 🎯 Agent intent – the why behind each call, not just the what
- 🧭 Every
tools/listso you can compare advertised vs called - 🪪 The MCP client name and version
- 🧵 The full session, end to end
- 🚧 Capabilities the agent wished existed (with
reportMissing)
The SDK supports any TypeScript MCP server built on @modelcontextprotocol/sdk. The fastest way to get set up is our wizard, which installs the package and wires up instrument() for you (it also works for LLM coding agents like Cursor and Bolt):
Prefer to do it by hand? Install it from npm and call instrument() once at startup. You pass your posthog-node client as the required second argument:
See your first events
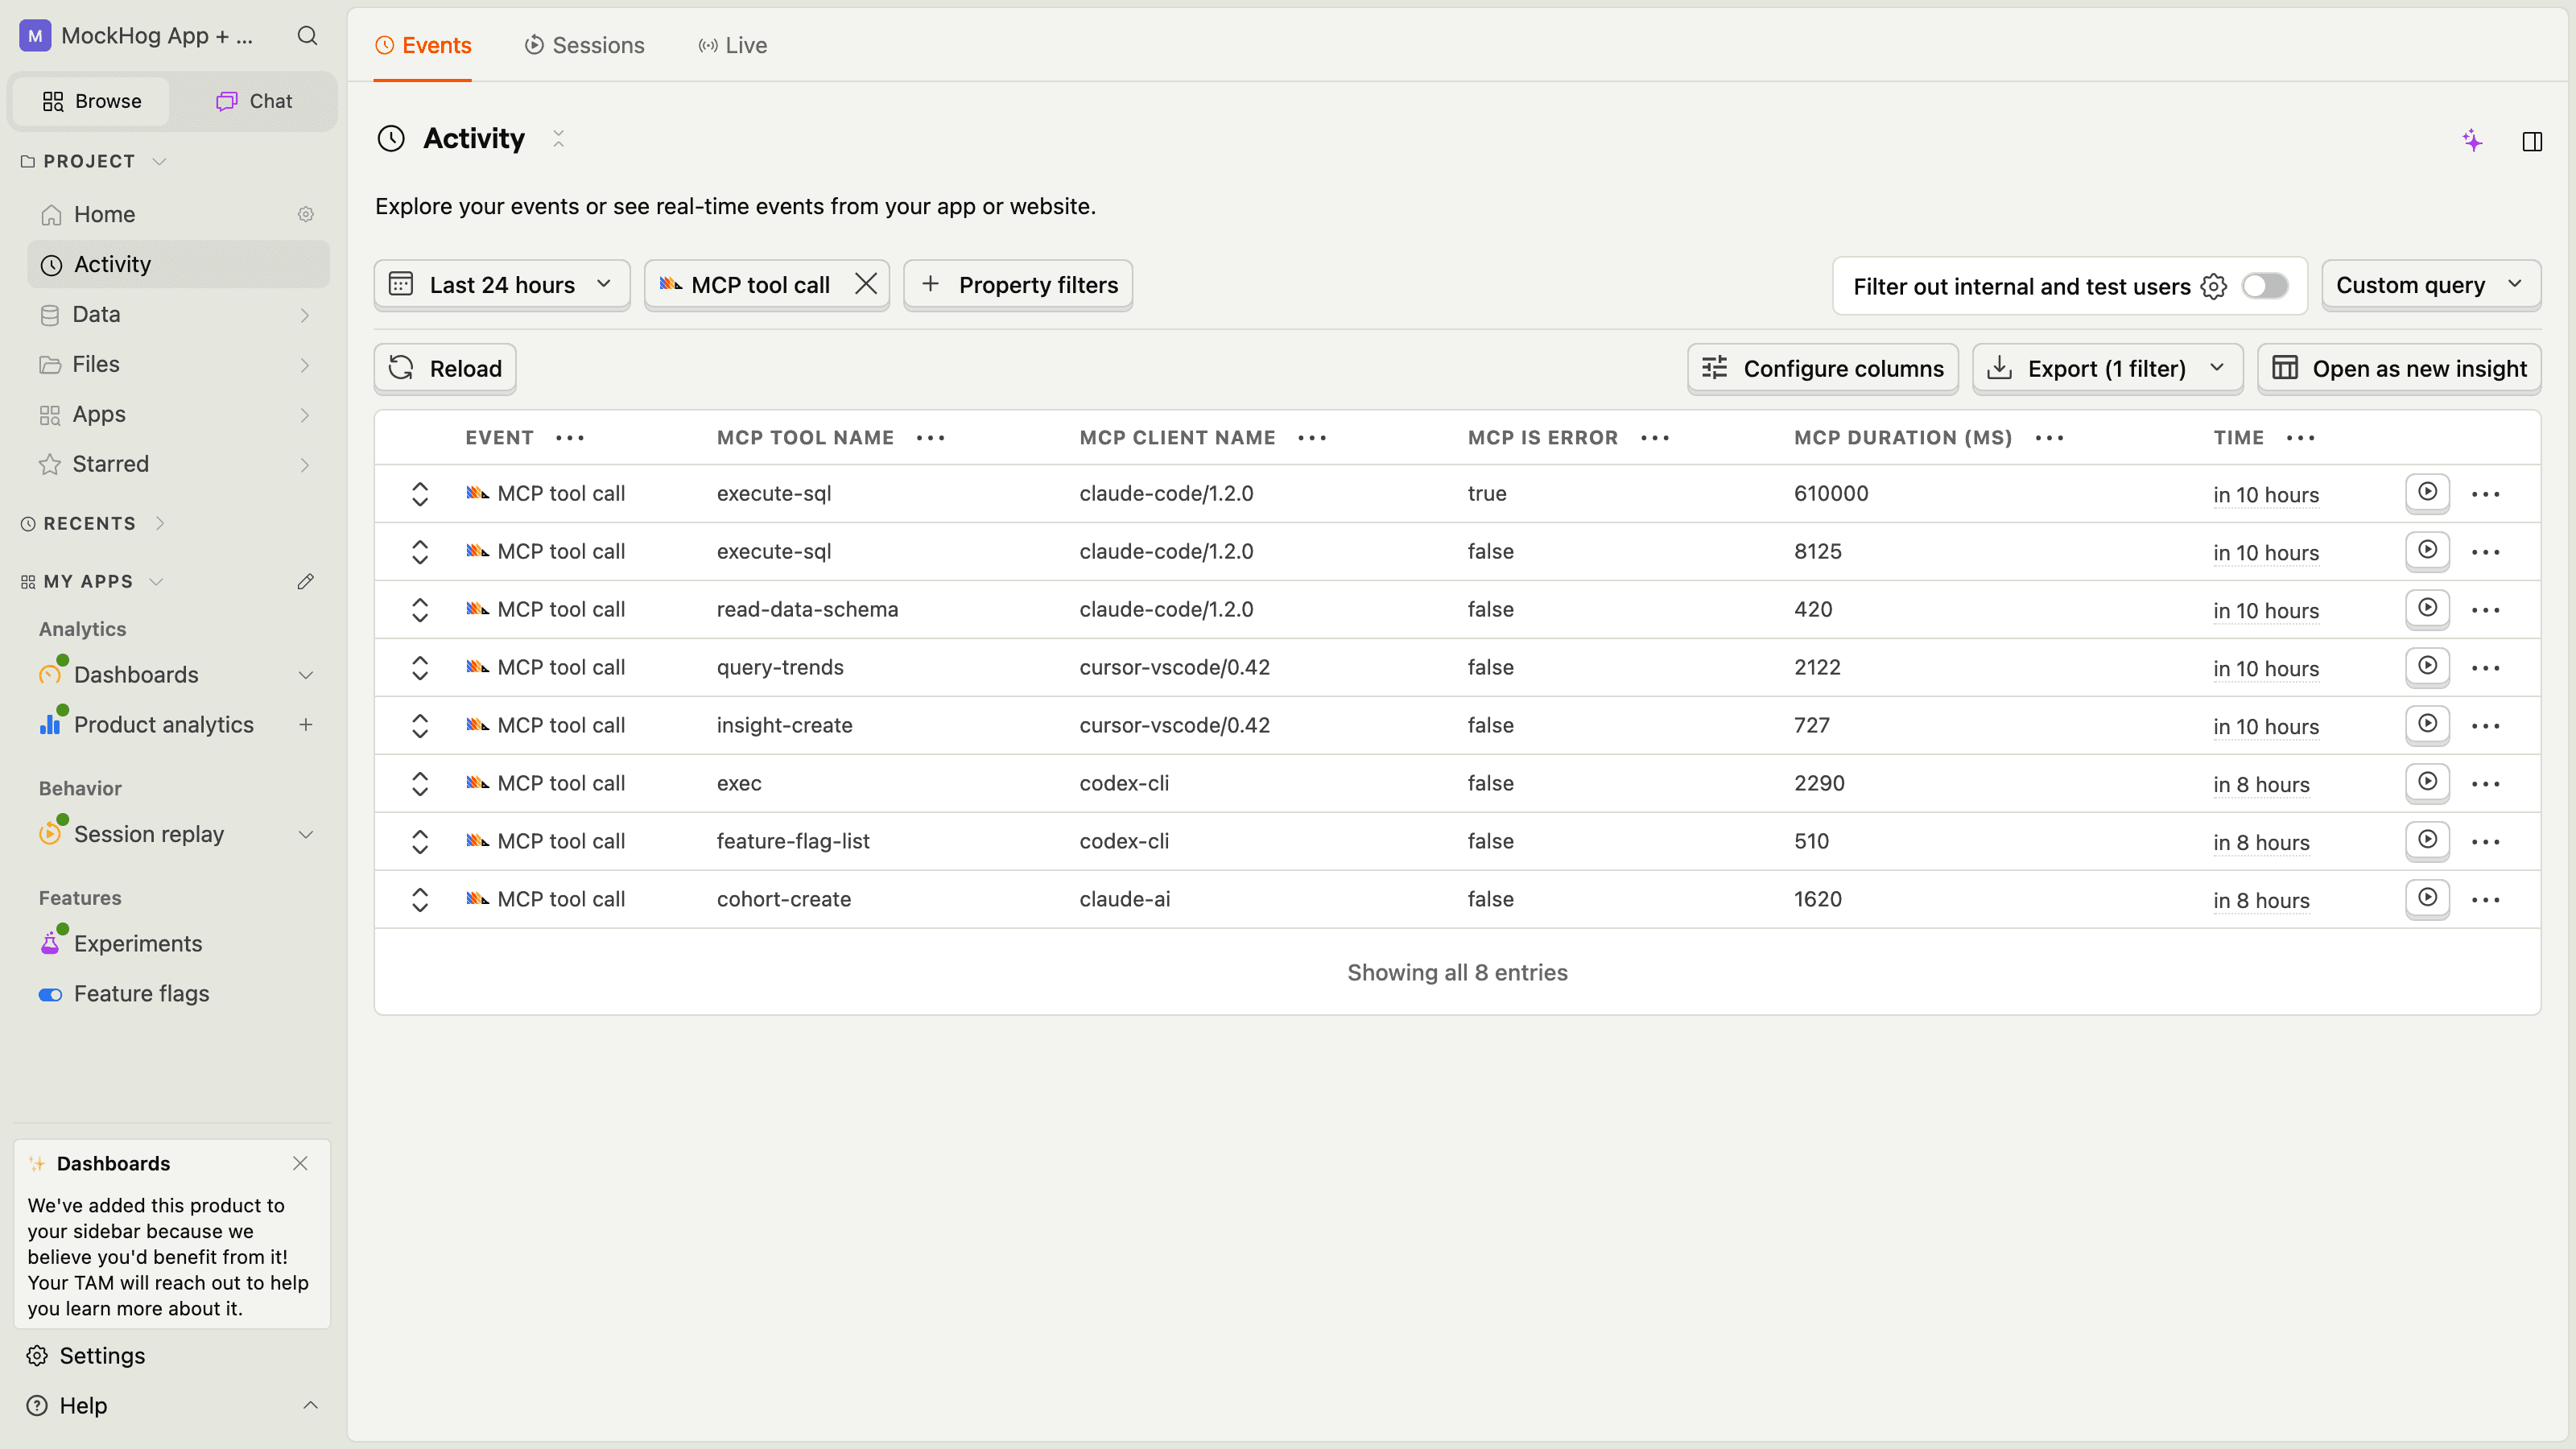
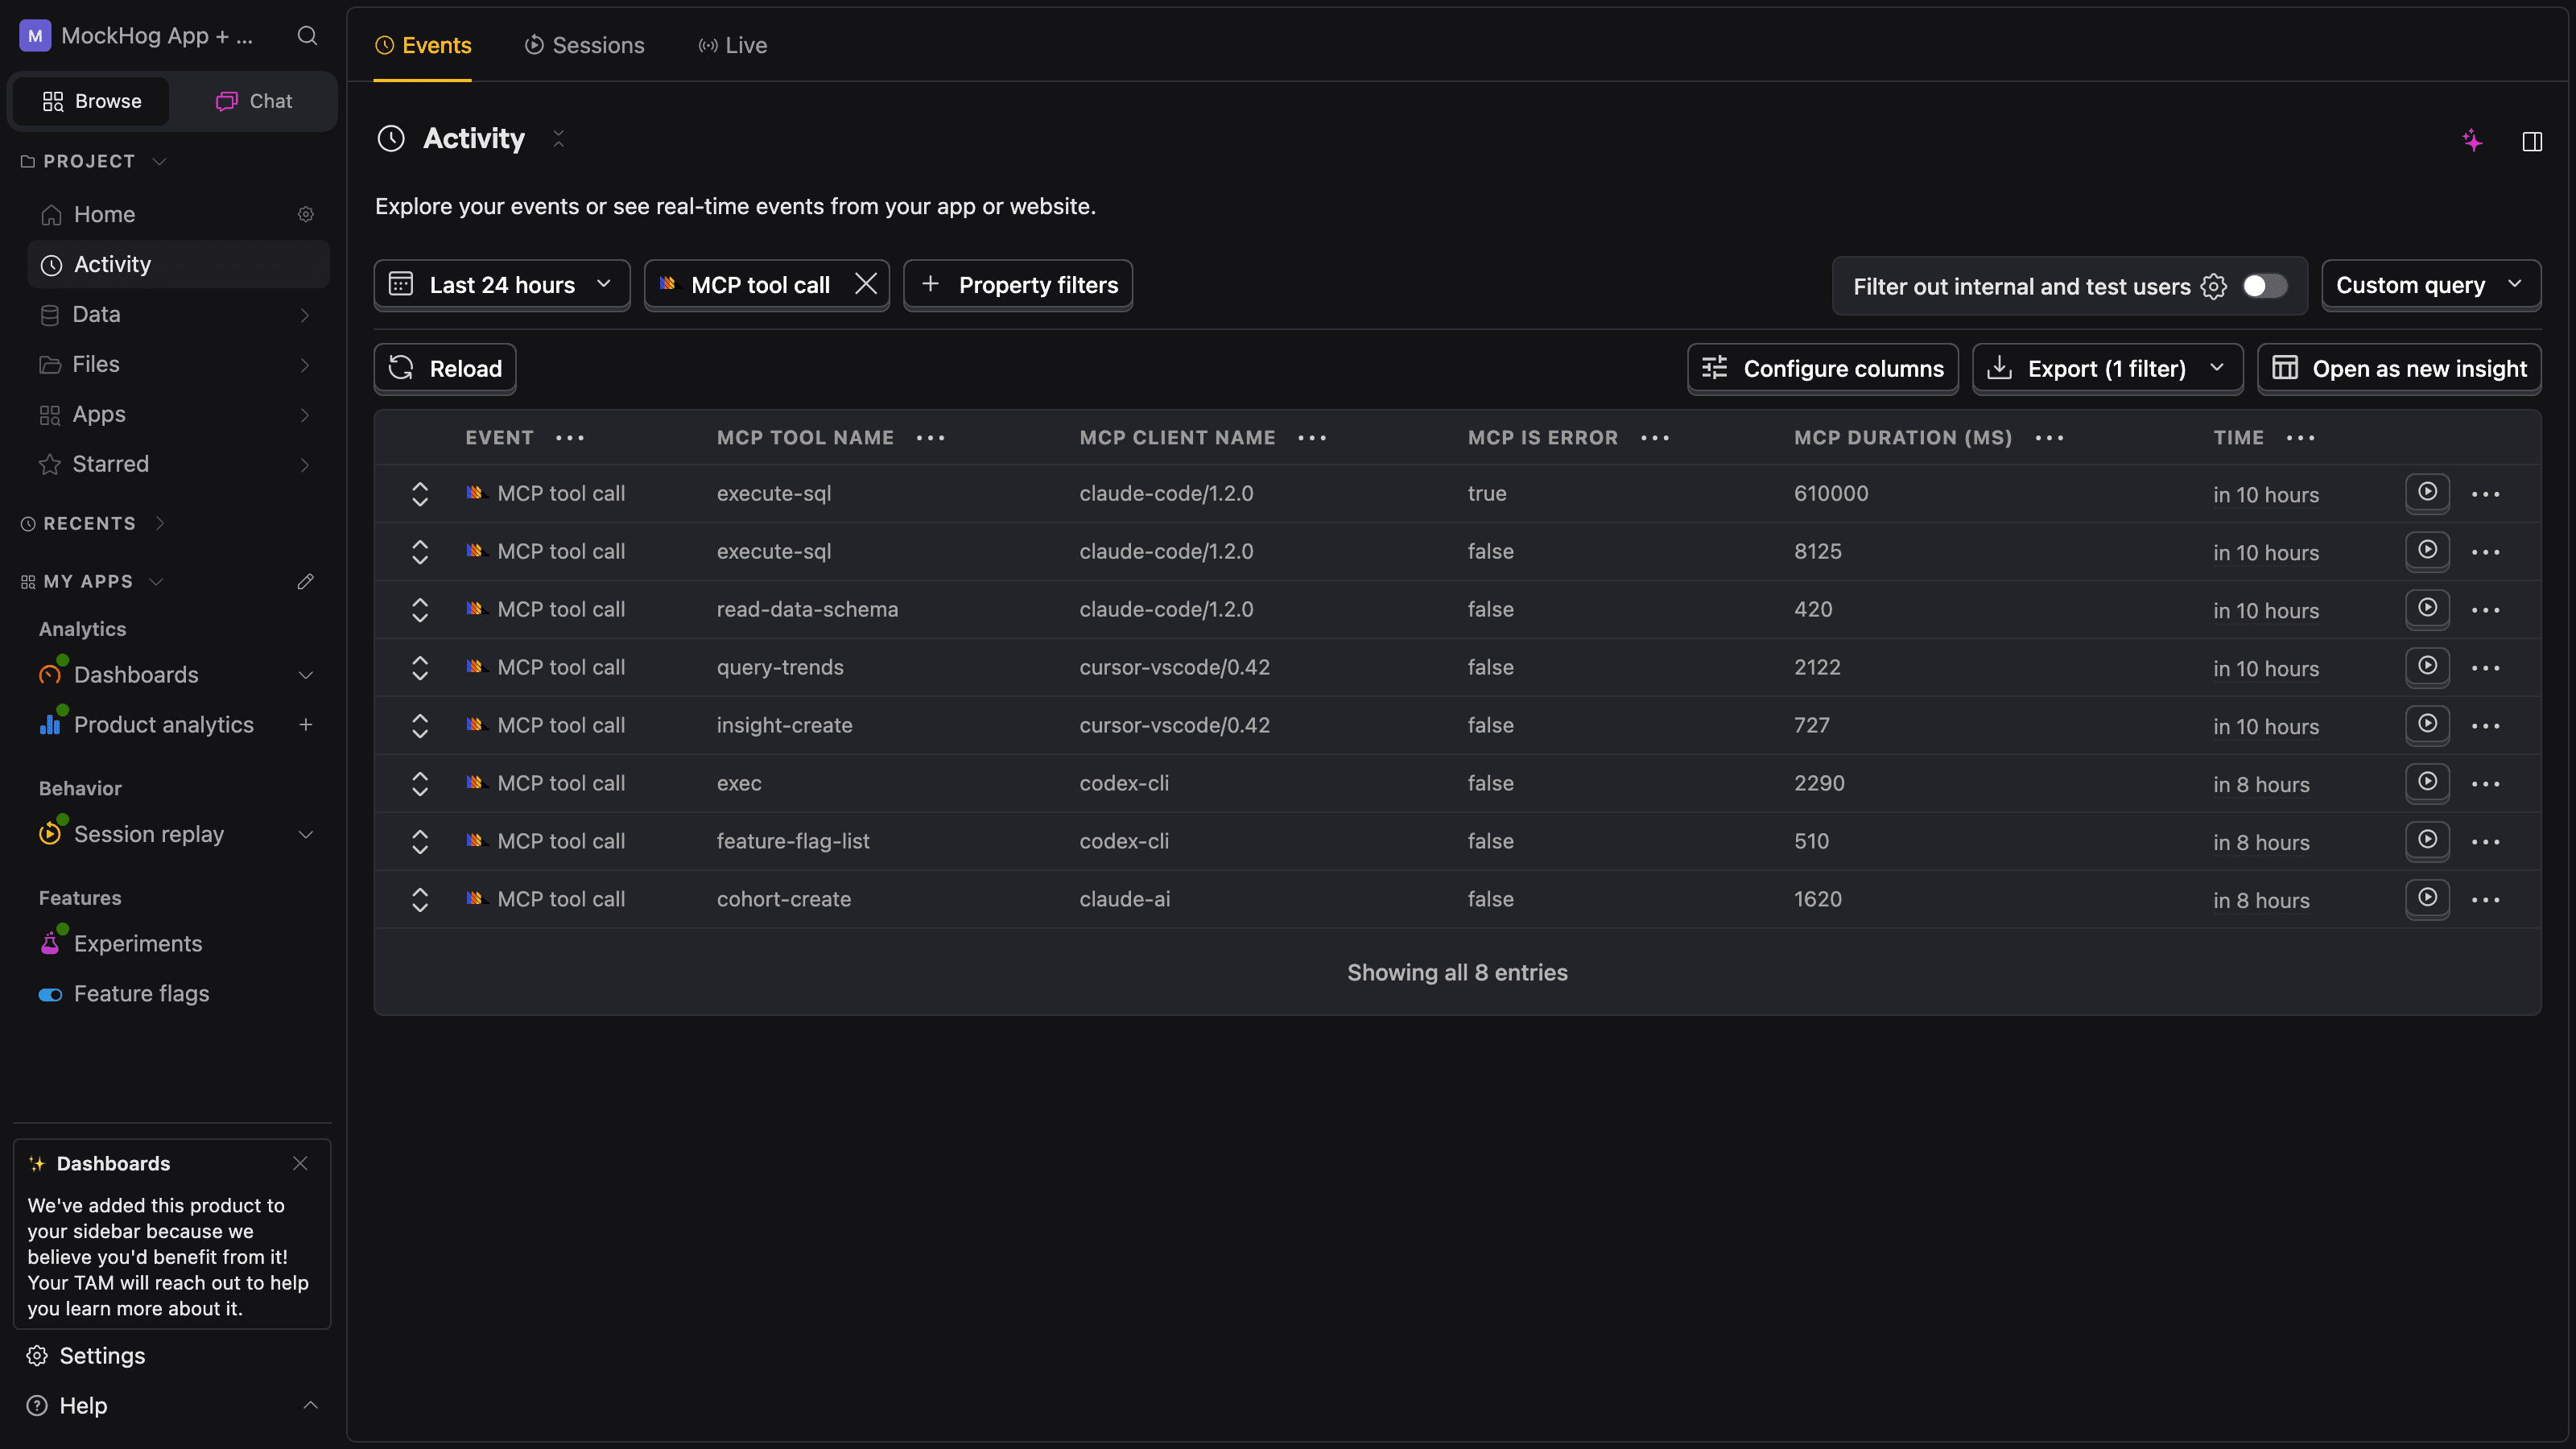
Run your MCP server and connect an agent to it (Claude Desktop, Cursor, Codex, or your own). Within seconds of the first tool call, PostHog will receive $mcp_tool_call, $mcp_tools_list, and $mcp_initialize events – all prefixed with $mcp_* so they never collide with anything else in your project.
Open the activity feed and filter for event = $mcp_tool_call. You should see one row per agent tool invocation, each with $mcp_tool_name, $mcp_parameters, $mcp_response, $mcp_duration_ms, and $mcp_is_error.
Capture what the agent was trying to do
The single most useful signal in MCP Analytics is intent: the user goal that led the agent to call this tool. The SDK injects a required context argument into every tool's schema and captures it as $mcp_intent. Your tool implementation never sees it.
For agents that ignore the schema hint (raw cURL clients, schema-blind crawlers), supply an intentFallback. The SDK calls it whenever no context argument was passed:
Build your first dashboard
Every event is a normal PostHog event, so insights, dashboards, alerts, and SQL all work without further setup – and the MCP Analytics view (in beta – enable the feature preview) gives you the most useful cuts out of the box. The four queries we suggest building (or reading straight from the dashboard) first:
Top tools per server
Where is your agent traffic concentrated? Which tools earn their keep?
Error rate per tool
Which tools throw most often? Pair with
$exceptionevents to triage.Intent samples by source
How much of your traffic supplies explicit context vs falls back to
intentFallback?Advertised tools that never get called
Find dead surface area by joining
$mcp_tools_listagainst$mcp_tool_call.
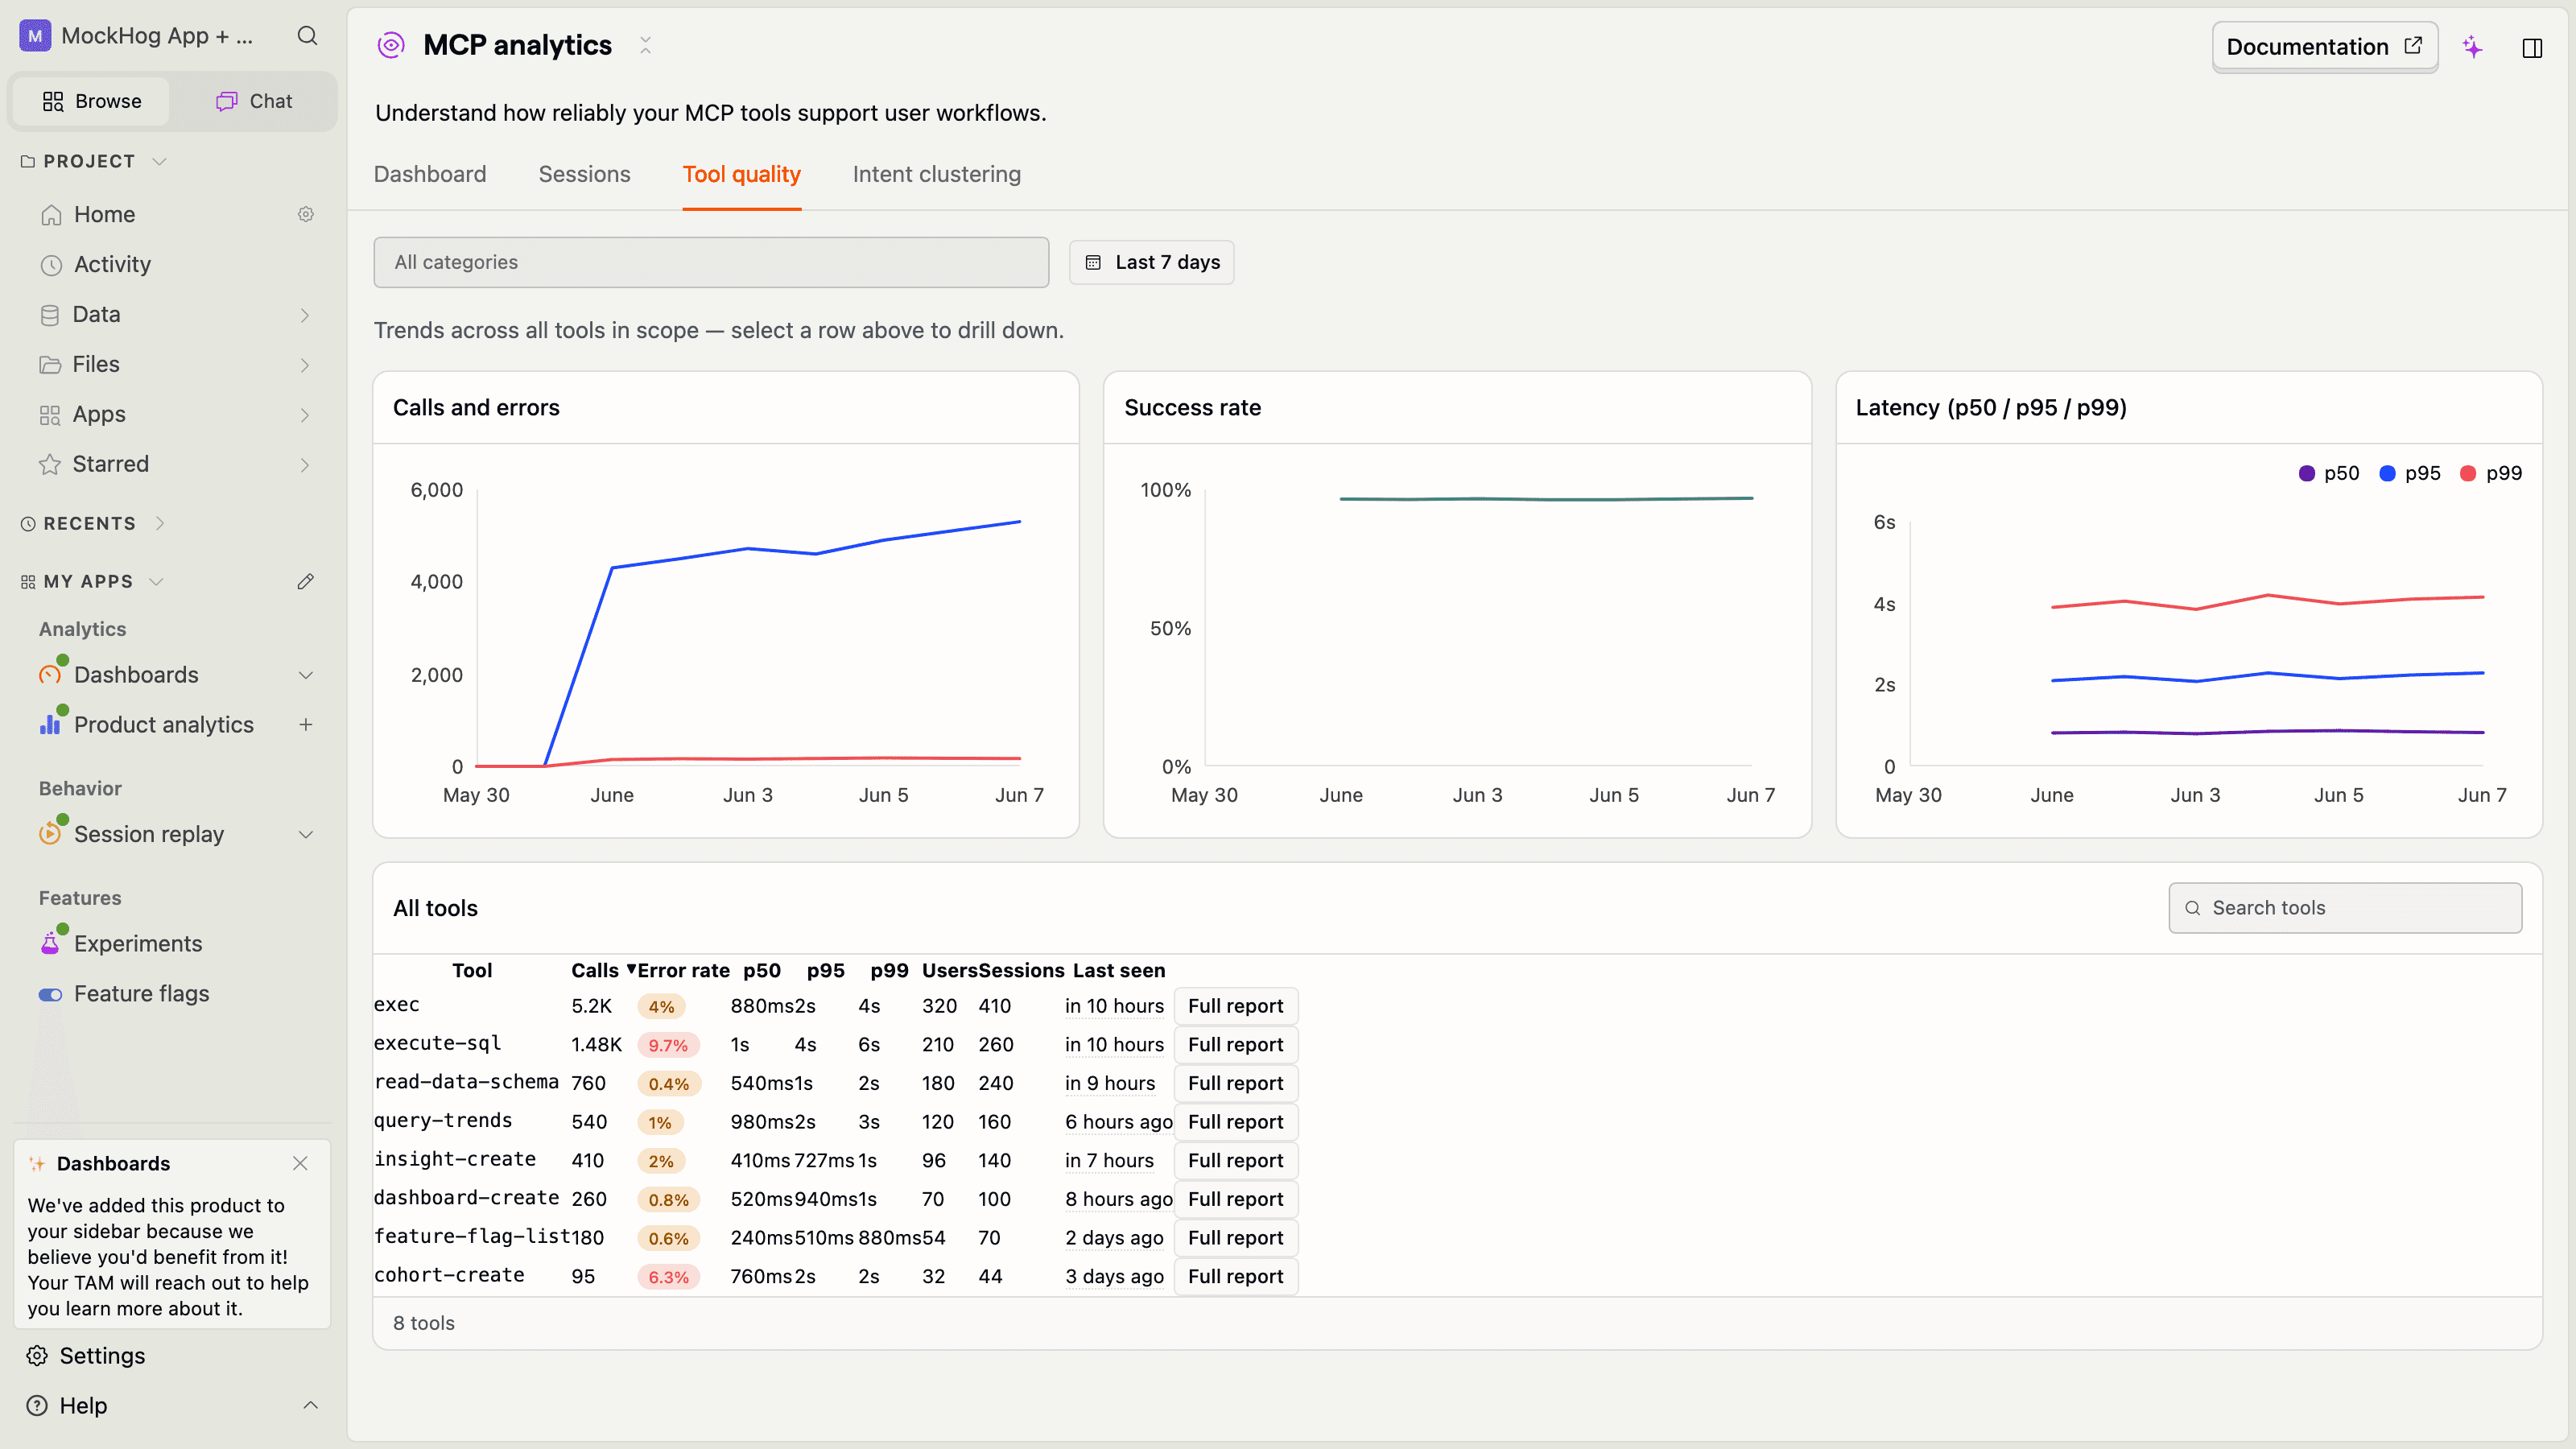
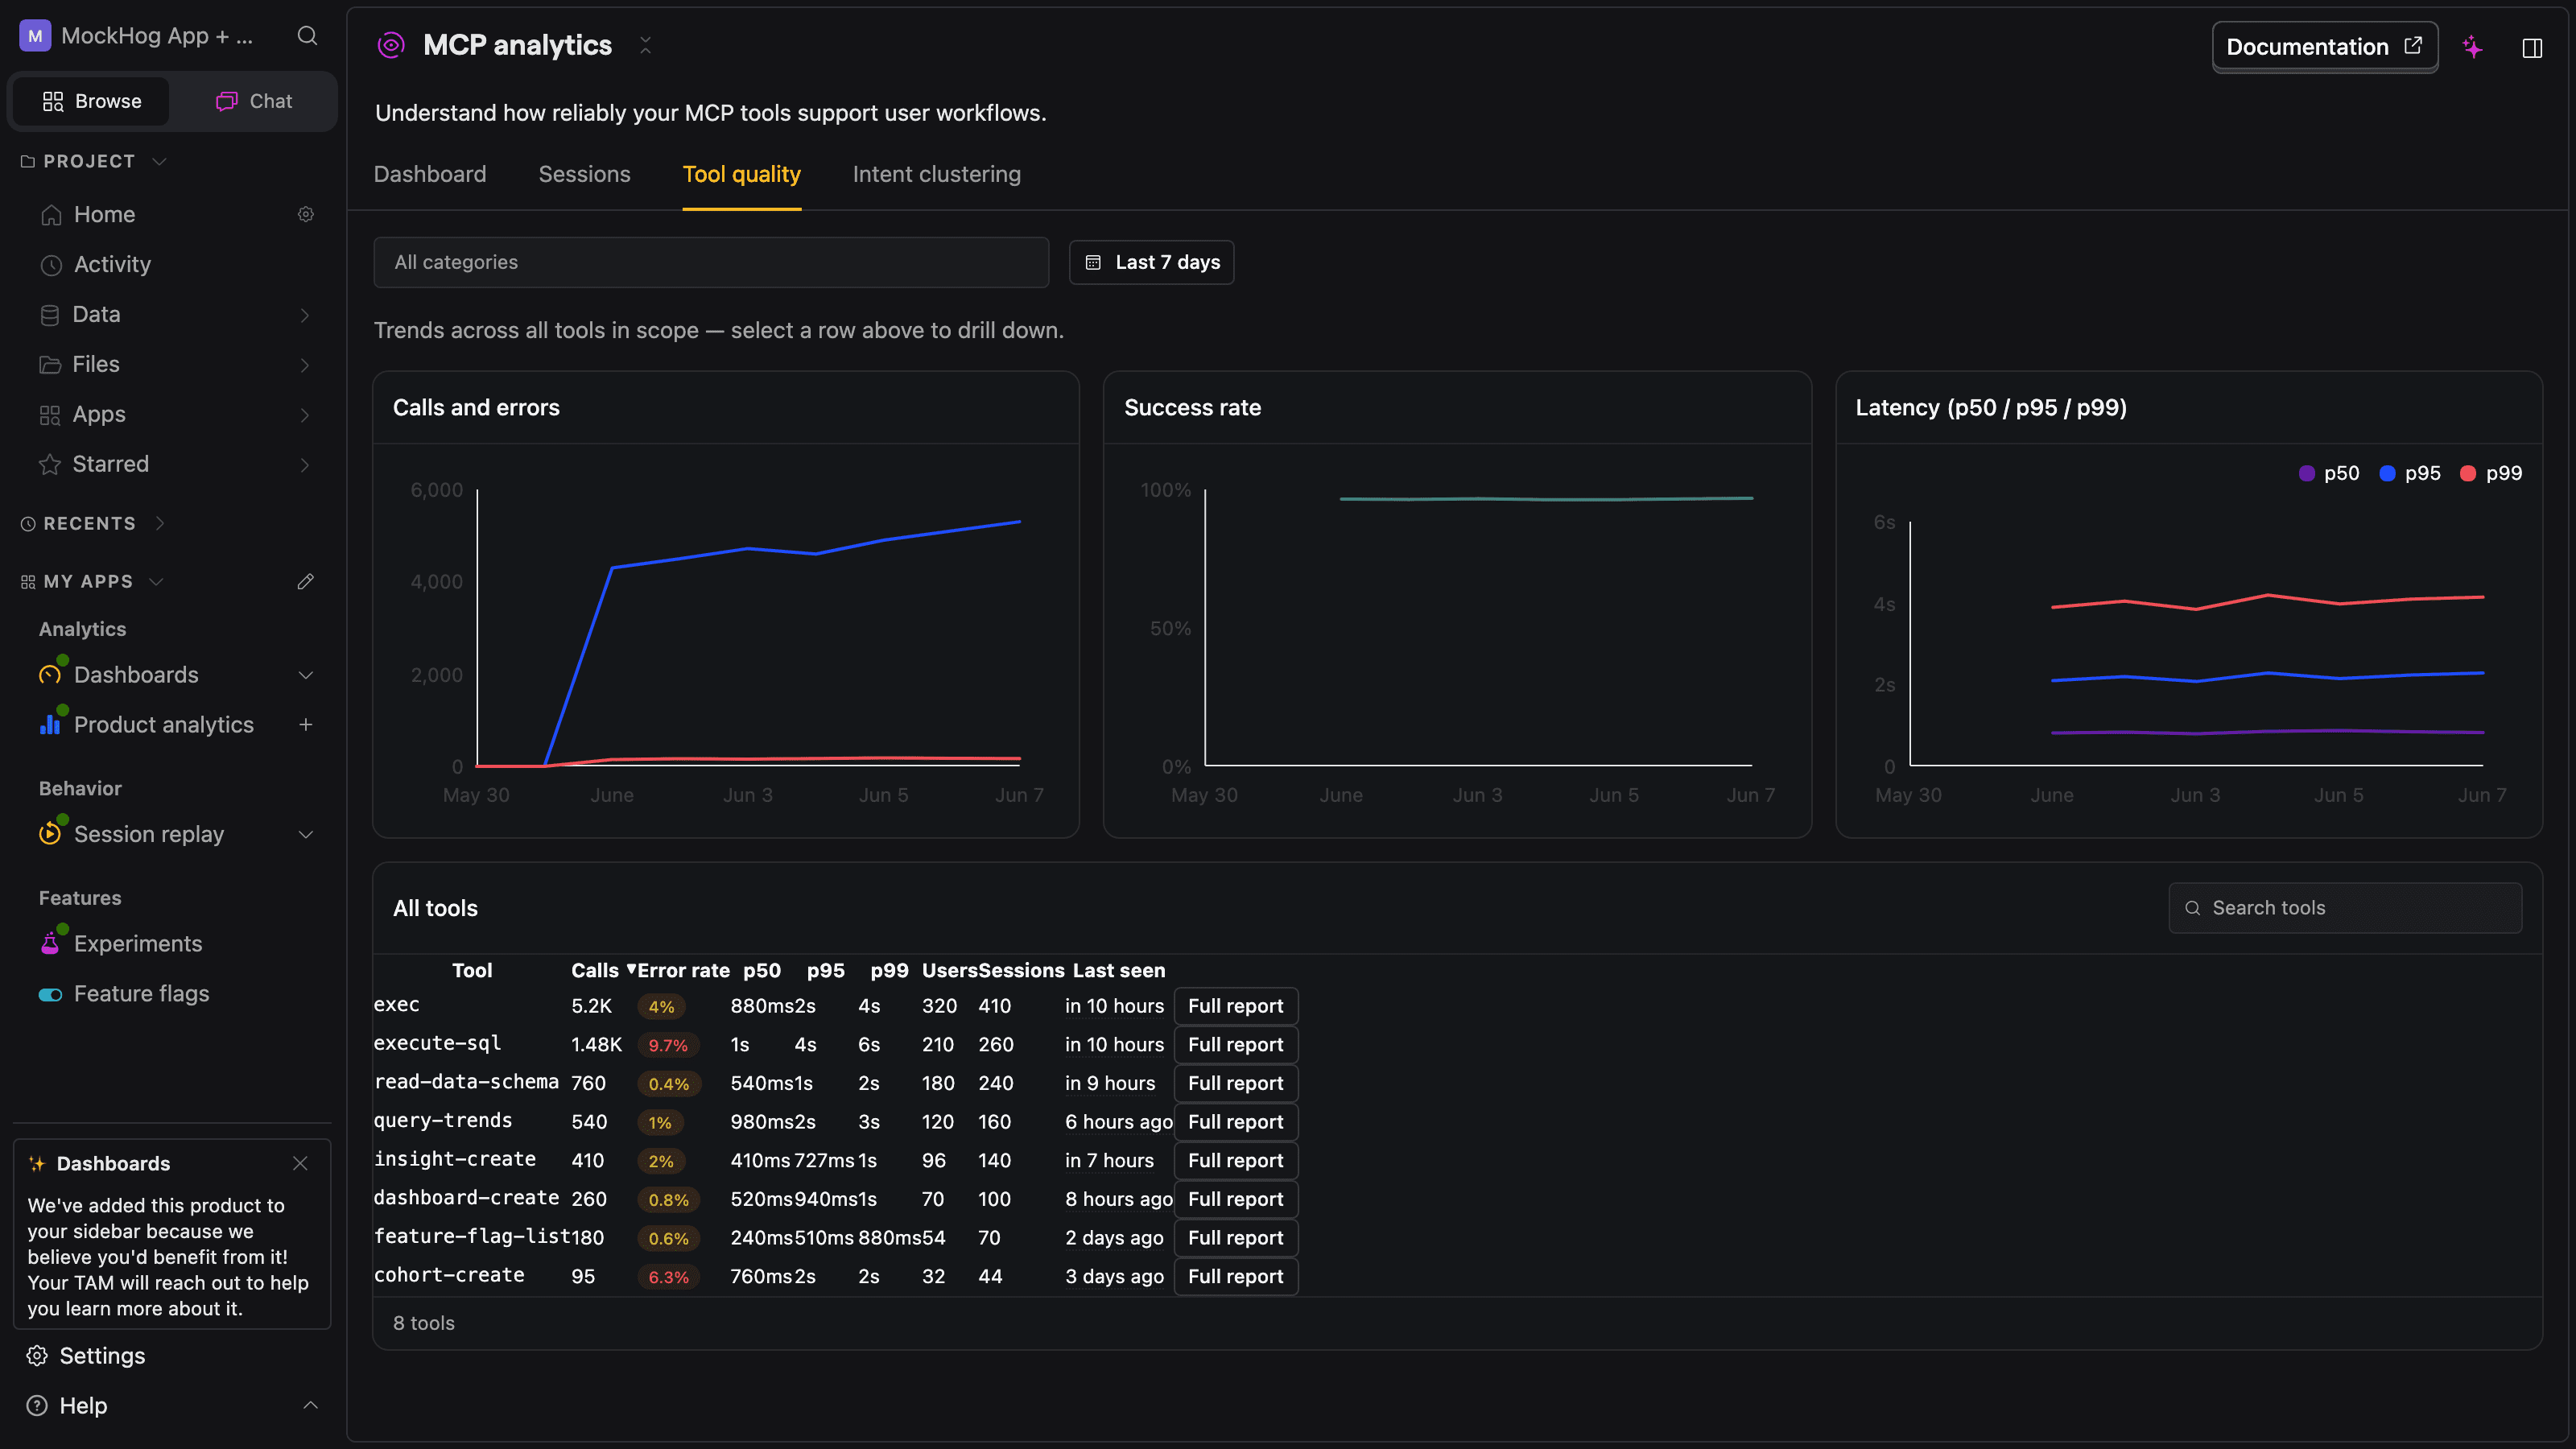
The tool quality tab surfaces error rate and latency percentiles per tool, with a row to drill into for any single tool:
Identify the user behind the agent
By default each event is attributed to the MCP connection's session ID. To attribute calls to a real user – for per-user retention, group analytics, and person properties – wire an identify callback:
The SDK emits a $identify event the first time it sees a new identity for a session, and PostHog's standard merge takes care of attributing prior anonymous activity.
Find capability gaps with `reportMissing`
The most actionable signal for an MCP server owner is the agent wanted to do something I don't support. Enable reportMissing: true and the SDK registers a get_more_tools virtual tool. When the agent invokes it, you get a queryable feed of unmet asks – straight into your roadmap.
Ship safely
The SDK runs every event through automatic sanitization (image/audio/binary stubs, sensitive-key masking like authorization, cookie, password, PostHog key patterns) and truncation to fit ingestion limits. For full control, add a beforeSend hook that runs on each built PostHog payload right before it's sent – mutate and return the event to send it, or return a nullish value to drop it.
That's it. You're ready to ship @posthog/mcp to production agents – within the beta caveats above.