





Getting started with AI Observability
Capture LLM data
AI Observability captures every call your product makes to an LLM and turns them into generations you can query, score, and get alerted on. You can:
- 🔍 Read full traces and sessions when you need to go detective mode
- ⚖️ Score response quality and sentiment with evals
- ⚠️ Get alerts on spikes in cost, latency, errors, or negative sentiment
- 💬 Get daily reports on how your LLM is used and performing
- 🧑 Combine LLM data with your existing customer data
- 🪄 Automagically turn these insights into PRs
New to AI observability? See core concepts for a primer on events, tokens, and traces.
The first step is to install a PostHog SDK to capture conversations, requests, and responses from an LLM provider. The fastest way is our wizard, which installs the SDK and instruments your LLM calls for you (it also works with LLM coding agents like Cursor and Bolt):
Prefer to do it by hand? Choose your platform below:






















Track AI generations
Once you've installed the SDK, every LLM call automatically becomes a generation – a detailed record of what went in and what came out. Each generation captures:
- Complete conversation context (inputs and outputs)
- Associated tool calls and their results
- Token counts and usage metrics
- Response latency and performance data
- Automatic cost calculation based on model pricing
PostHog's SDK wrappers handle all the heavy lifting. Use your LLM provider as normal and we'll capture everything automatically.
Evaluate AI quality
PostHog's evaluation suite scores your live generations as they happen, so you can monitor quality in production. Three evaluation types are supported:
- LLM-as-a-judge – an LLM scores each generation against a prompt you define
- Code-based (Hog) – deterministic checks written in code
- Sentiment analysis – classifies user sentiment as positive, neutral, or negative
Set up alerting
Since every LLM event is also a standard PostHog event, you can build insights on cost, latency, errors, or sentiment and set alerts to get notified when they spike.
Integrate customer data
Take advantage of PostHog's platform to integrate your customer data with AI Observability.
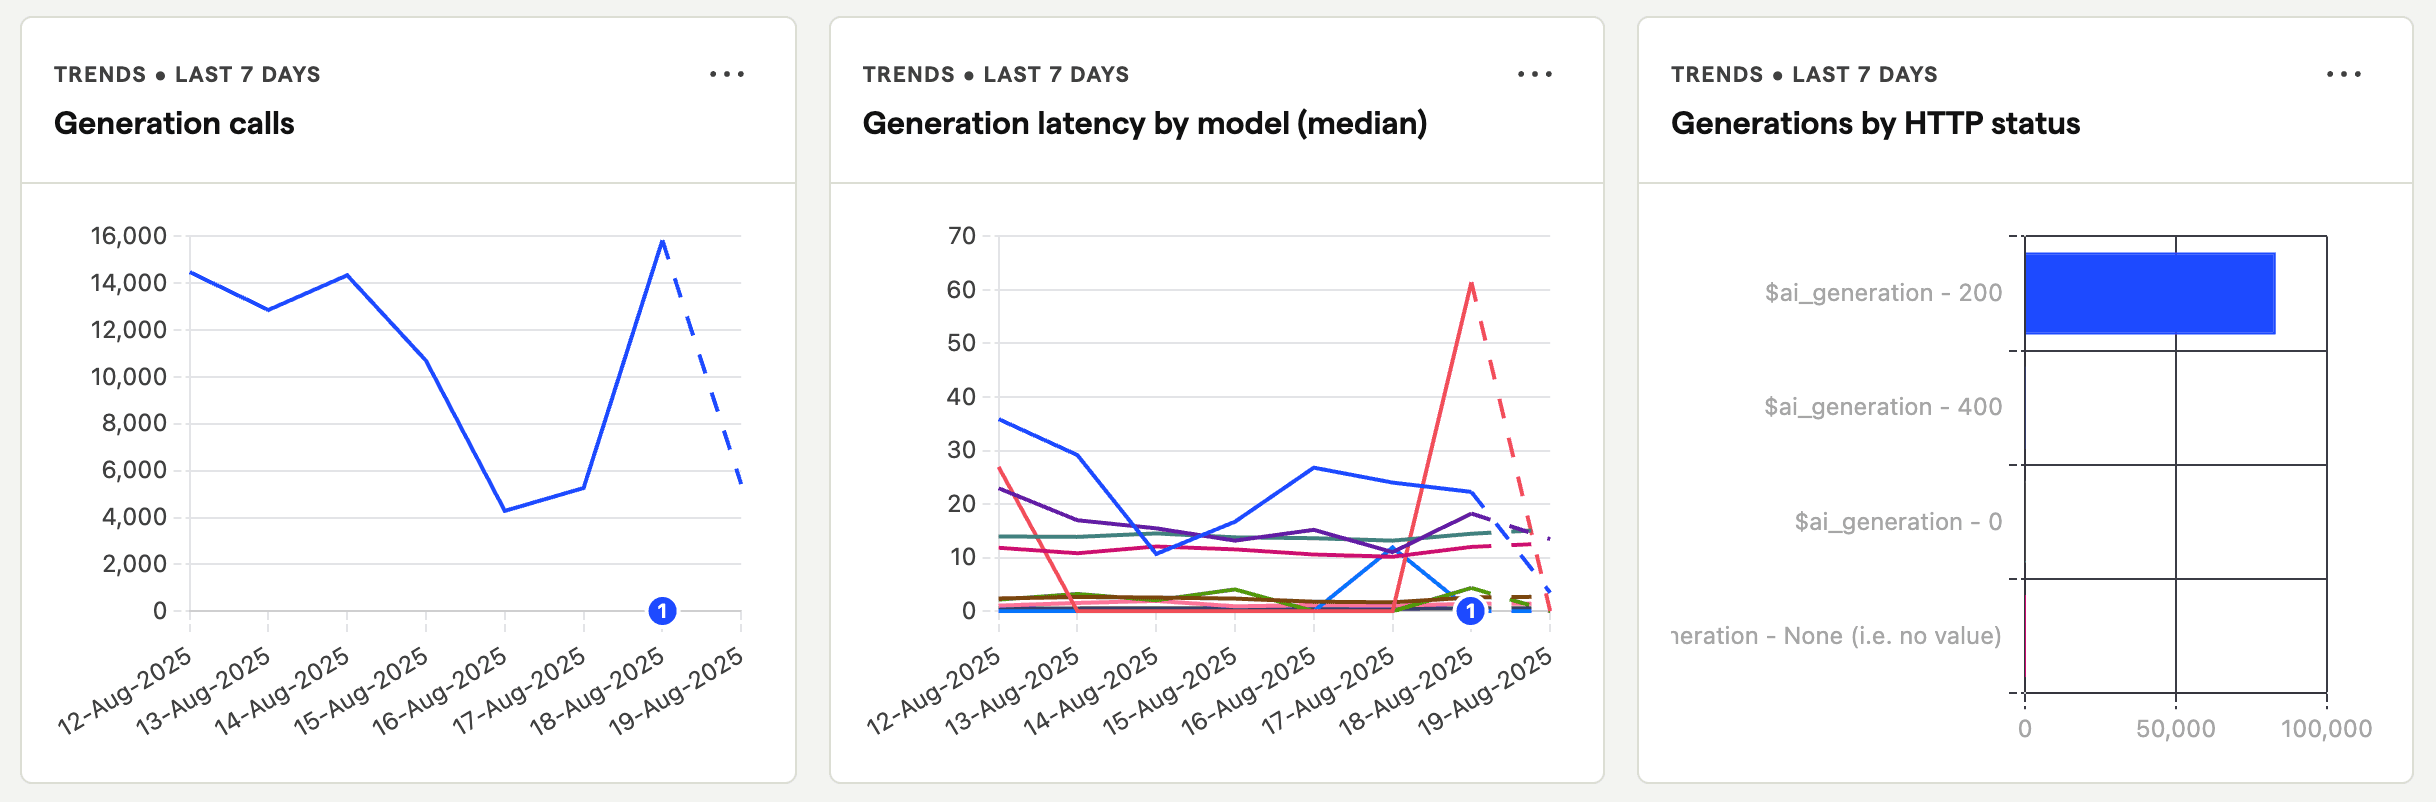
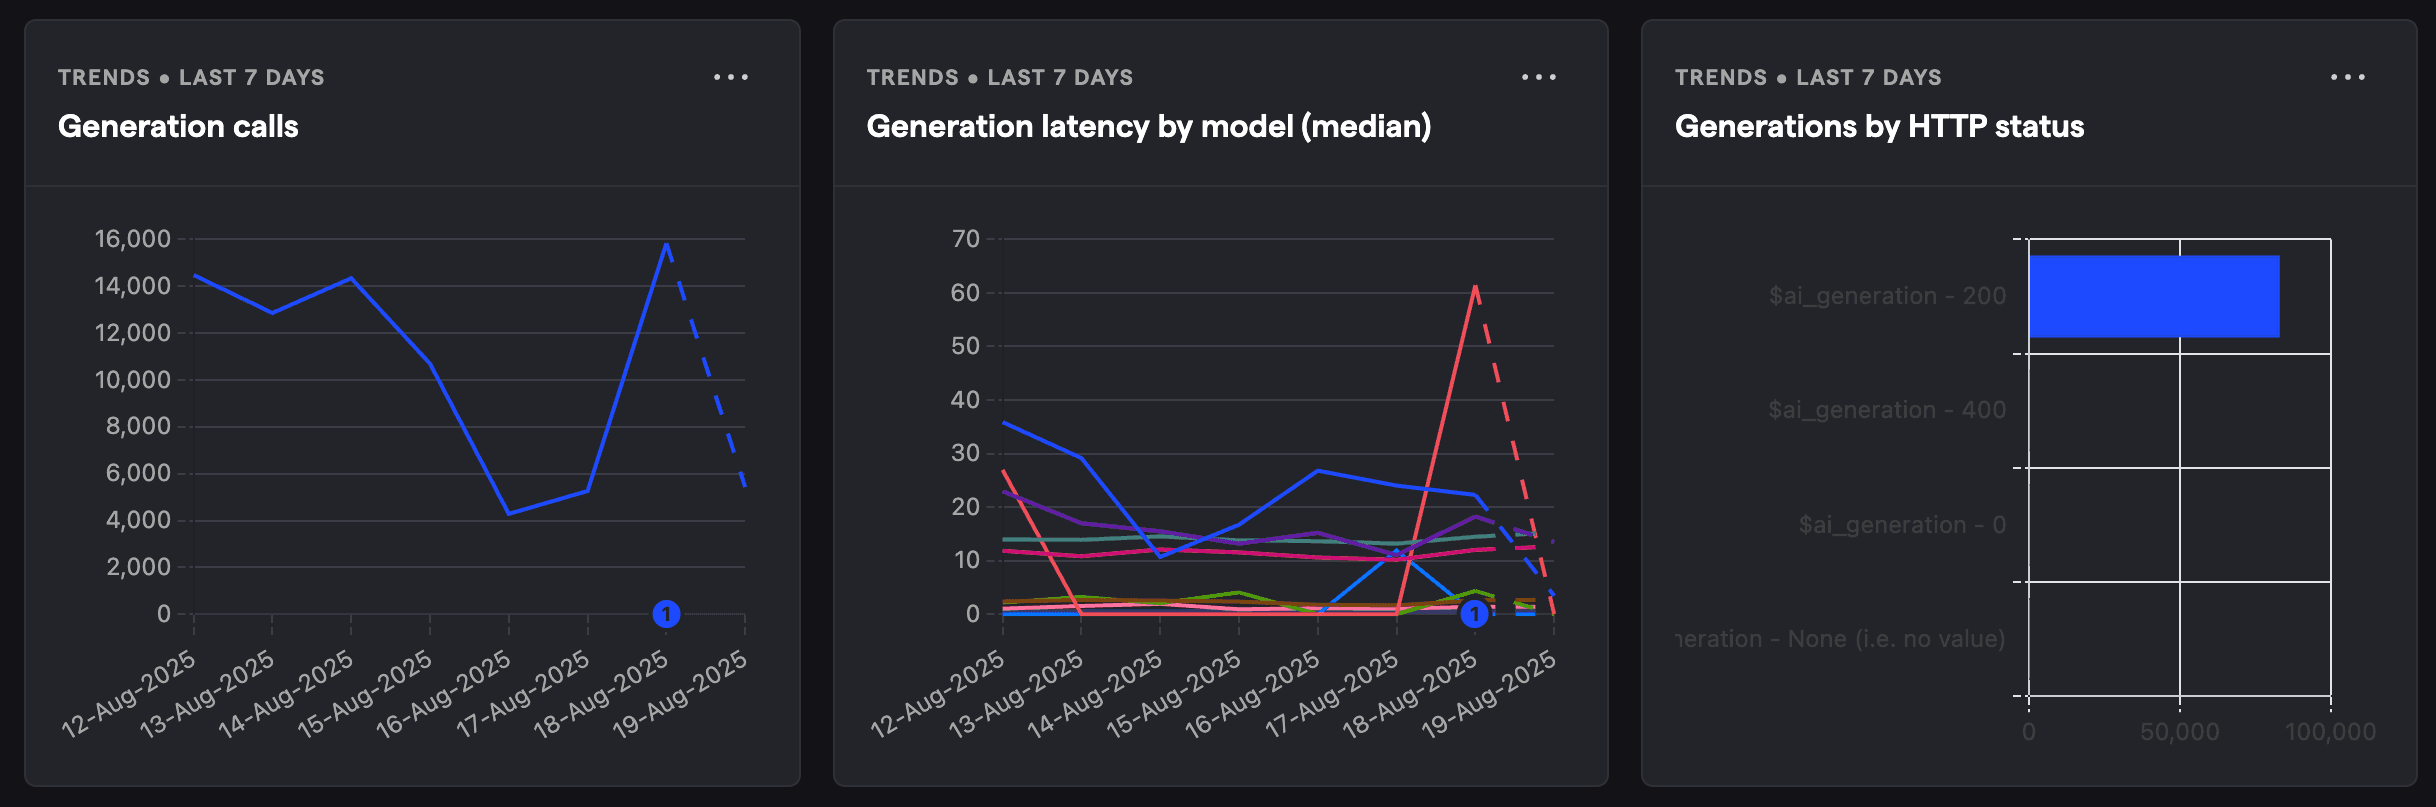
Product analytics
All AI Observability events are captured as standard PostHog events, which means you can create dashboards, trends, funnels, custom SQL queries, alerts, and more.
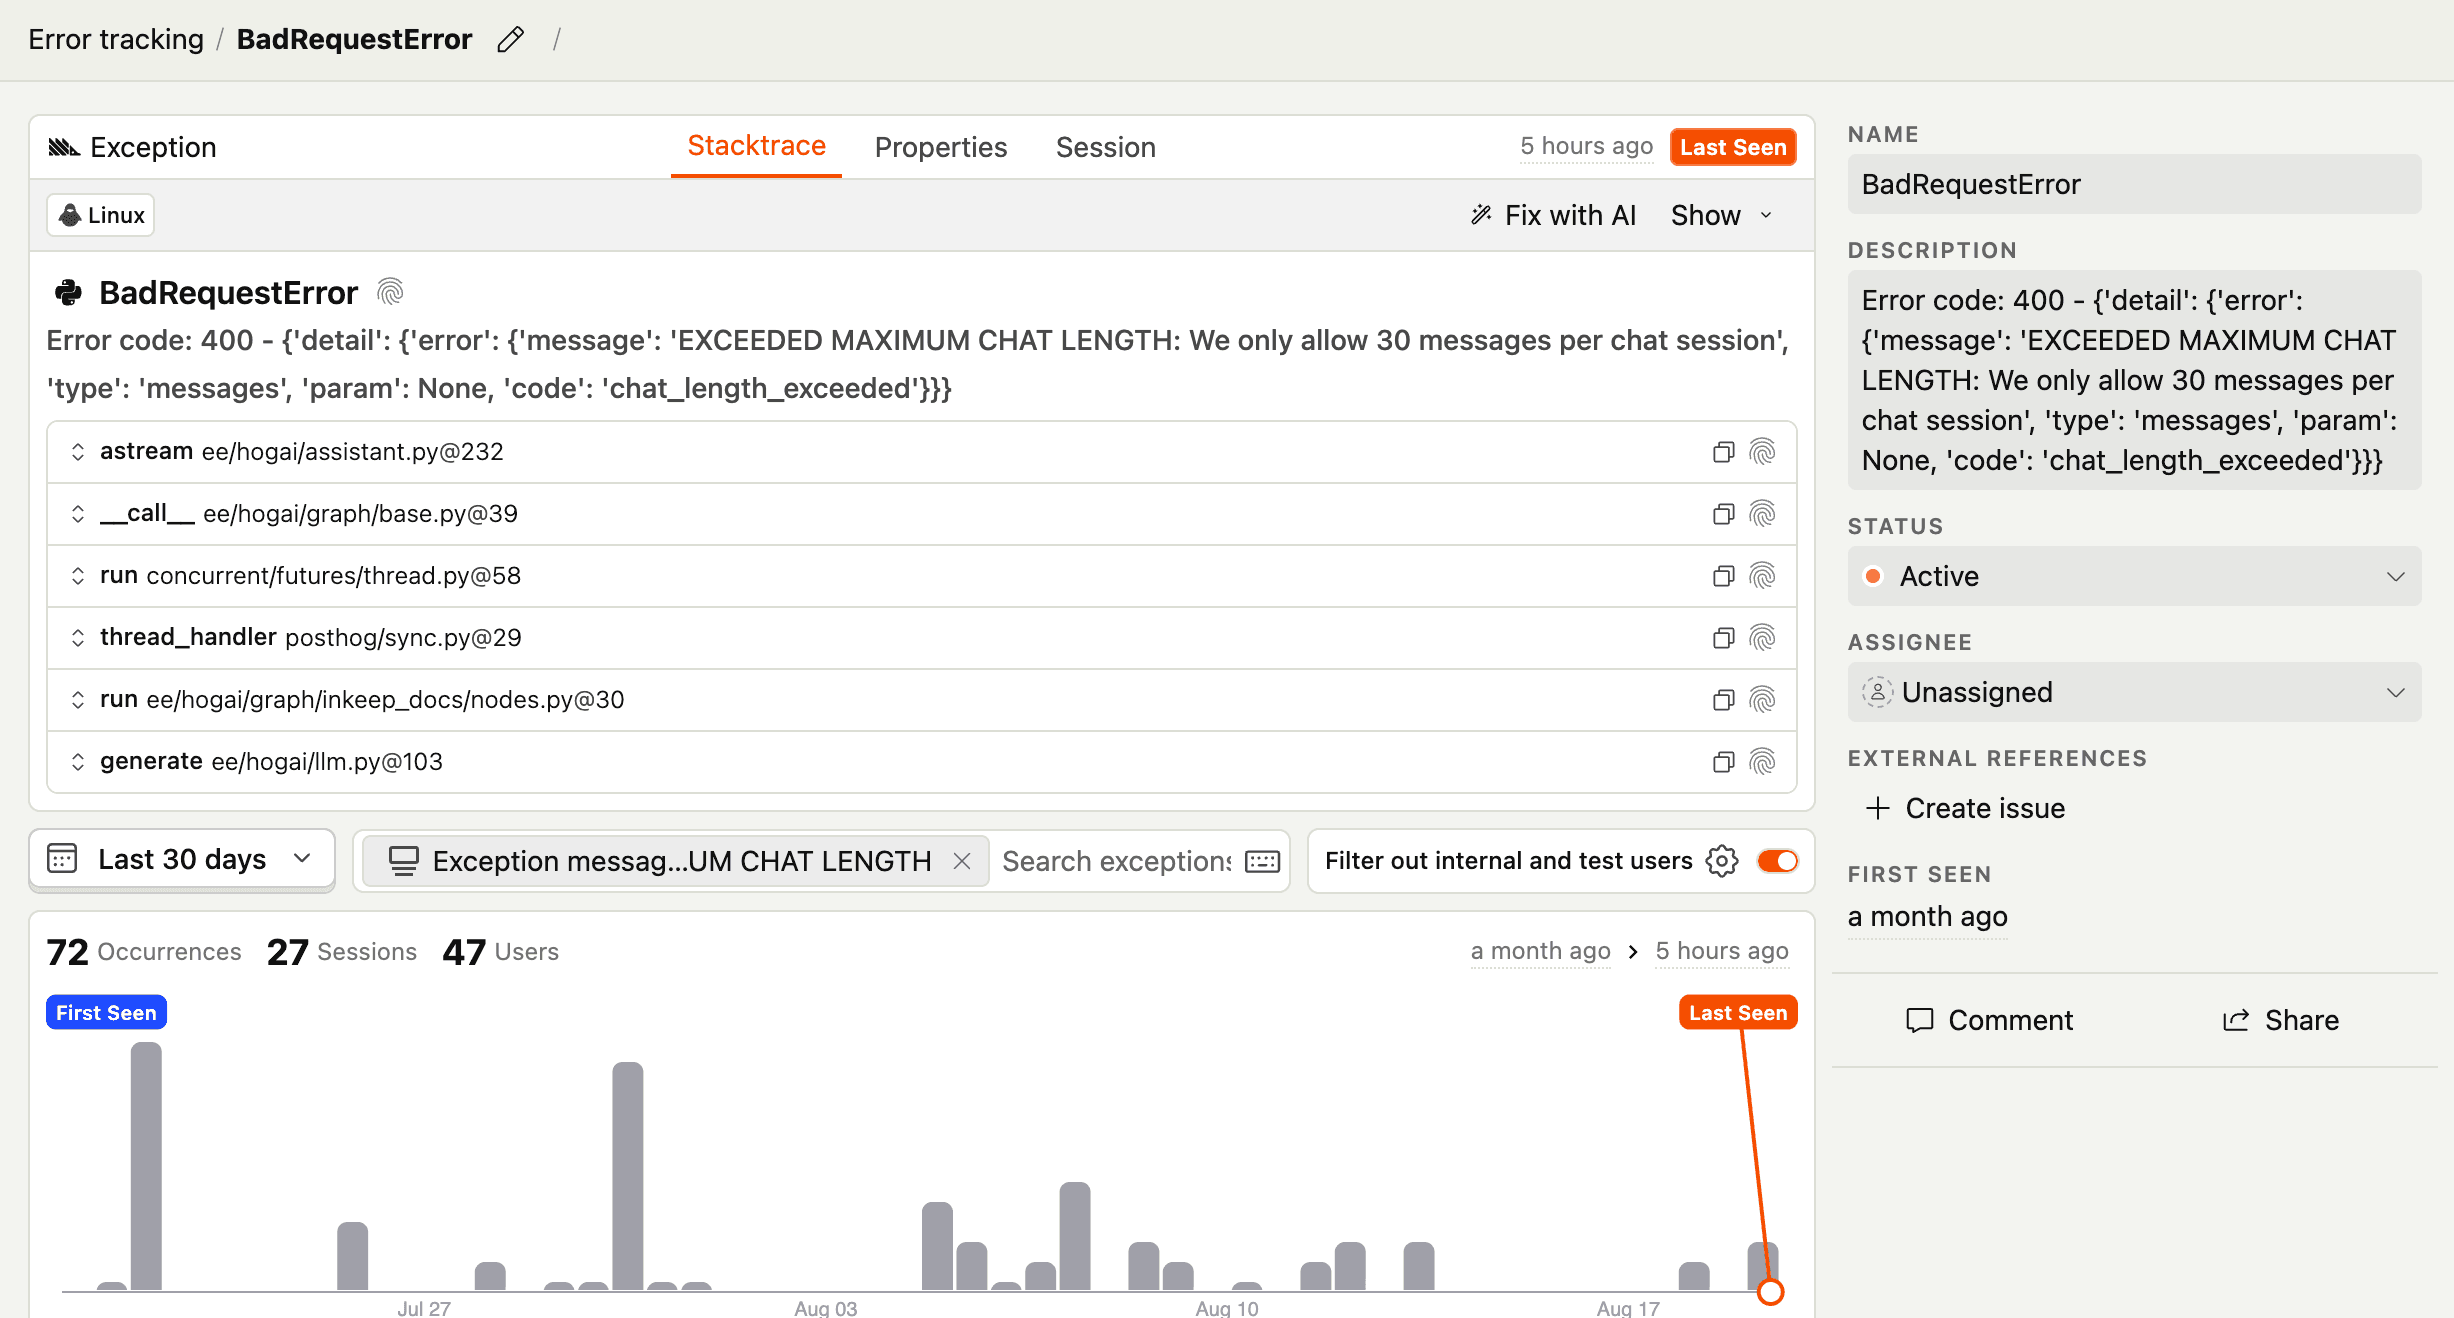
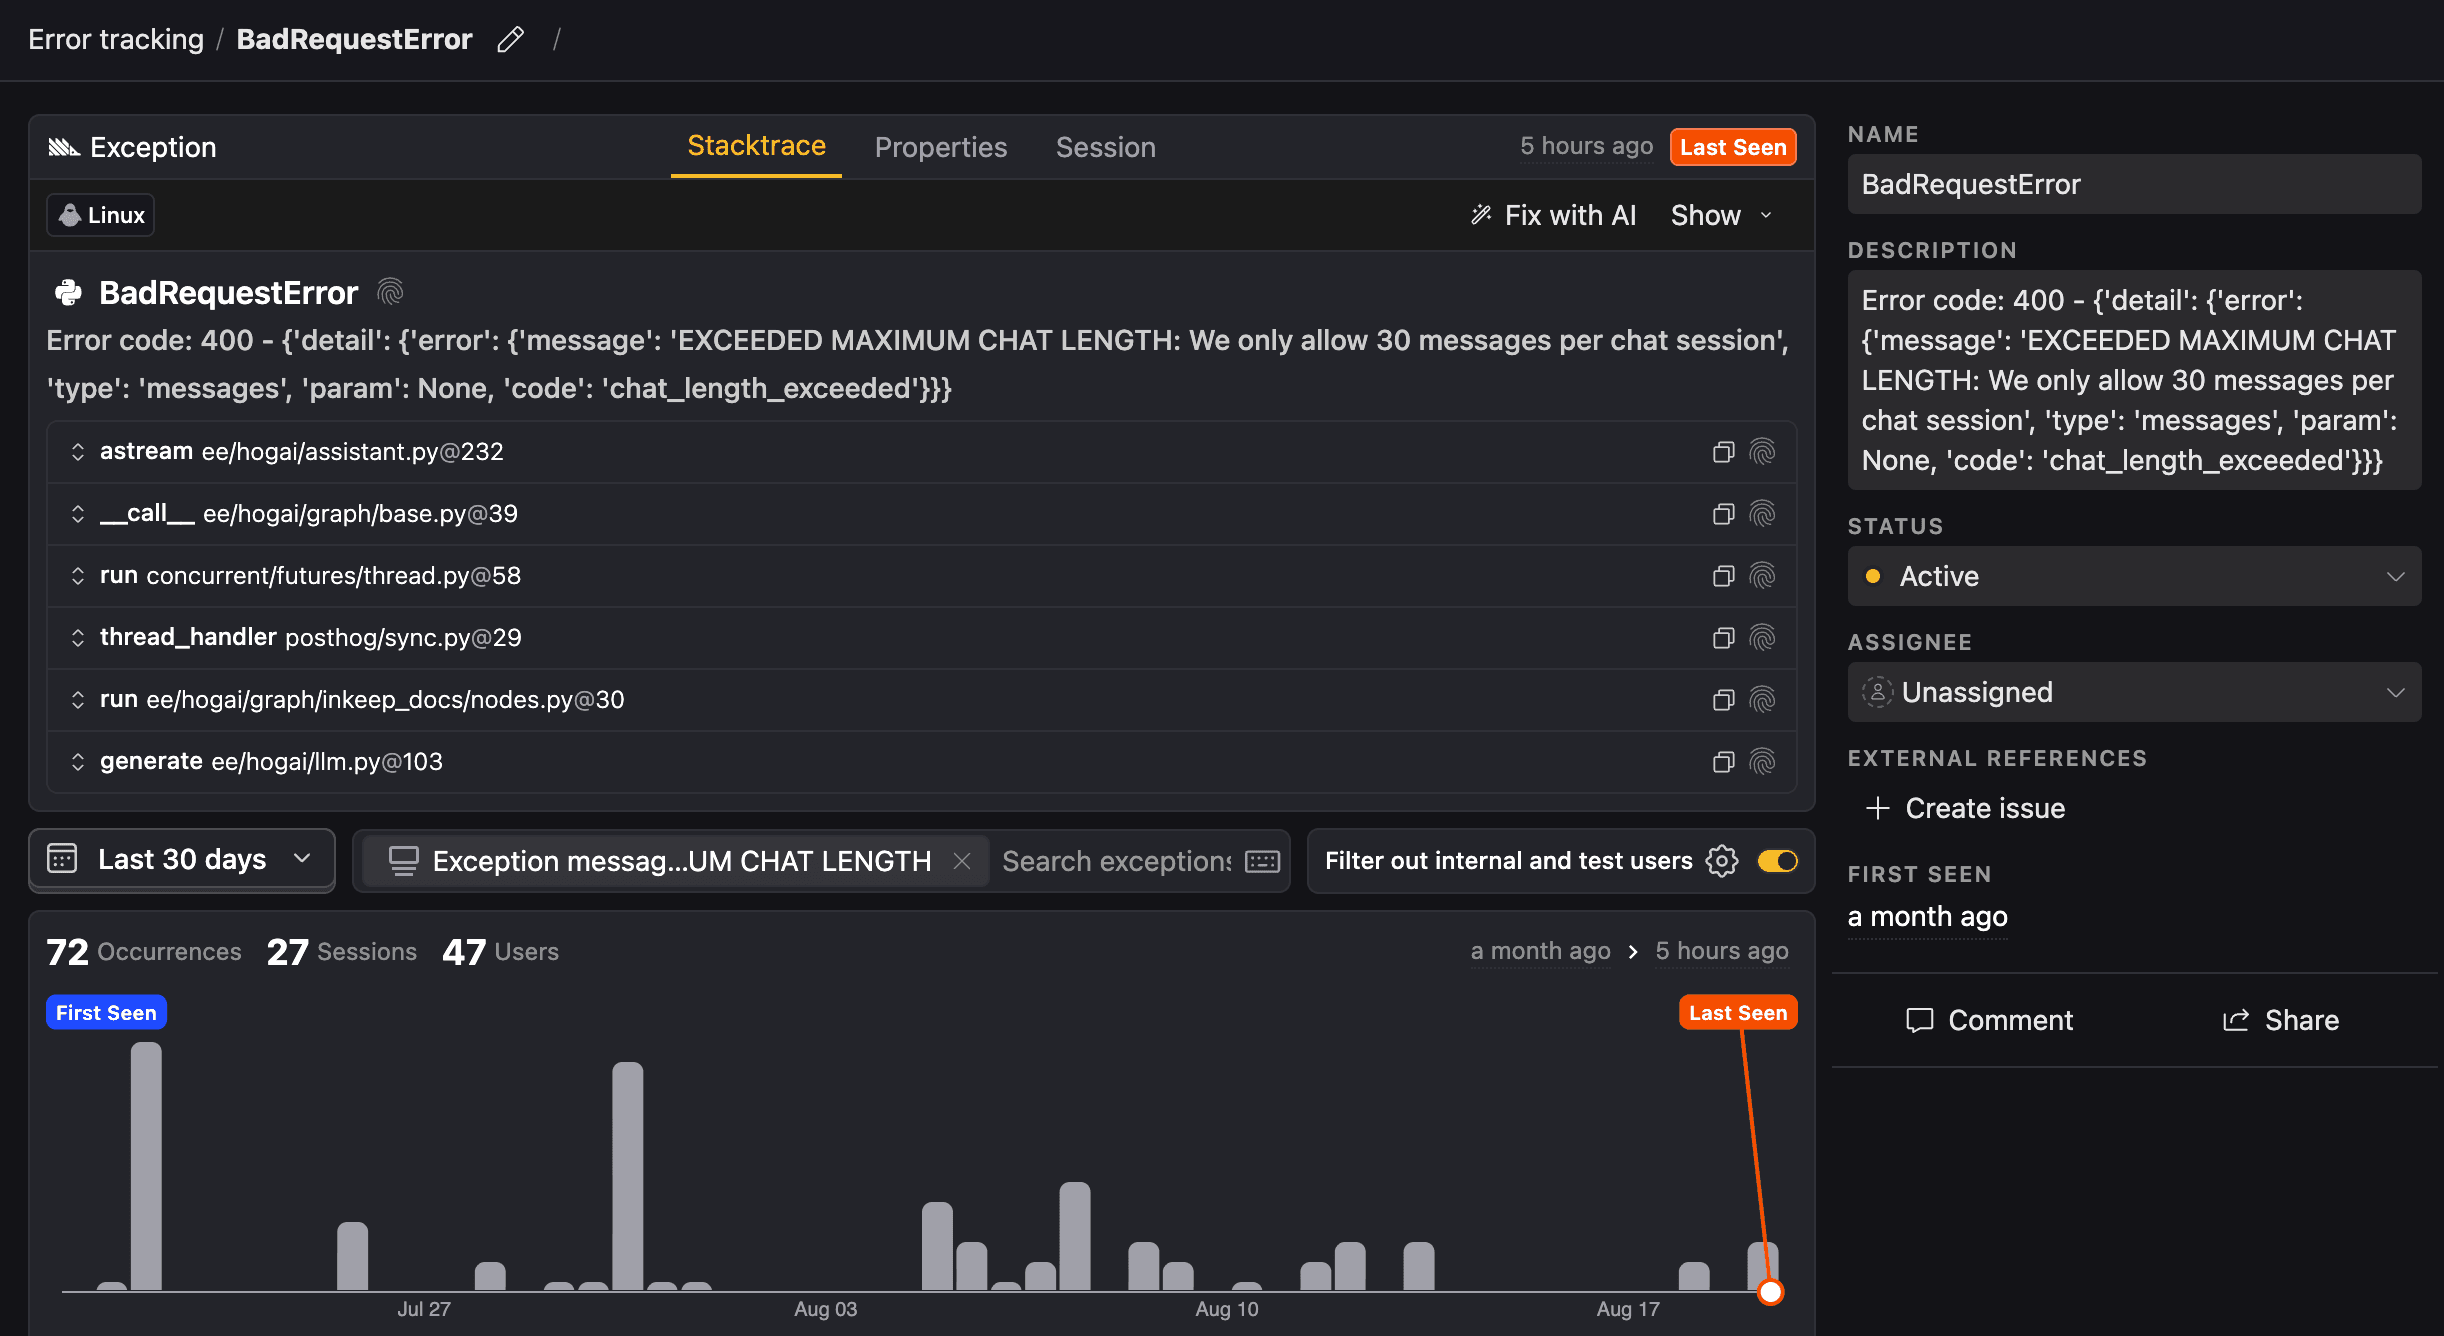
Error tracking
LLM generated errors are automatically captured in PostHog's error tracking for you to monitor, debug, and resolve.
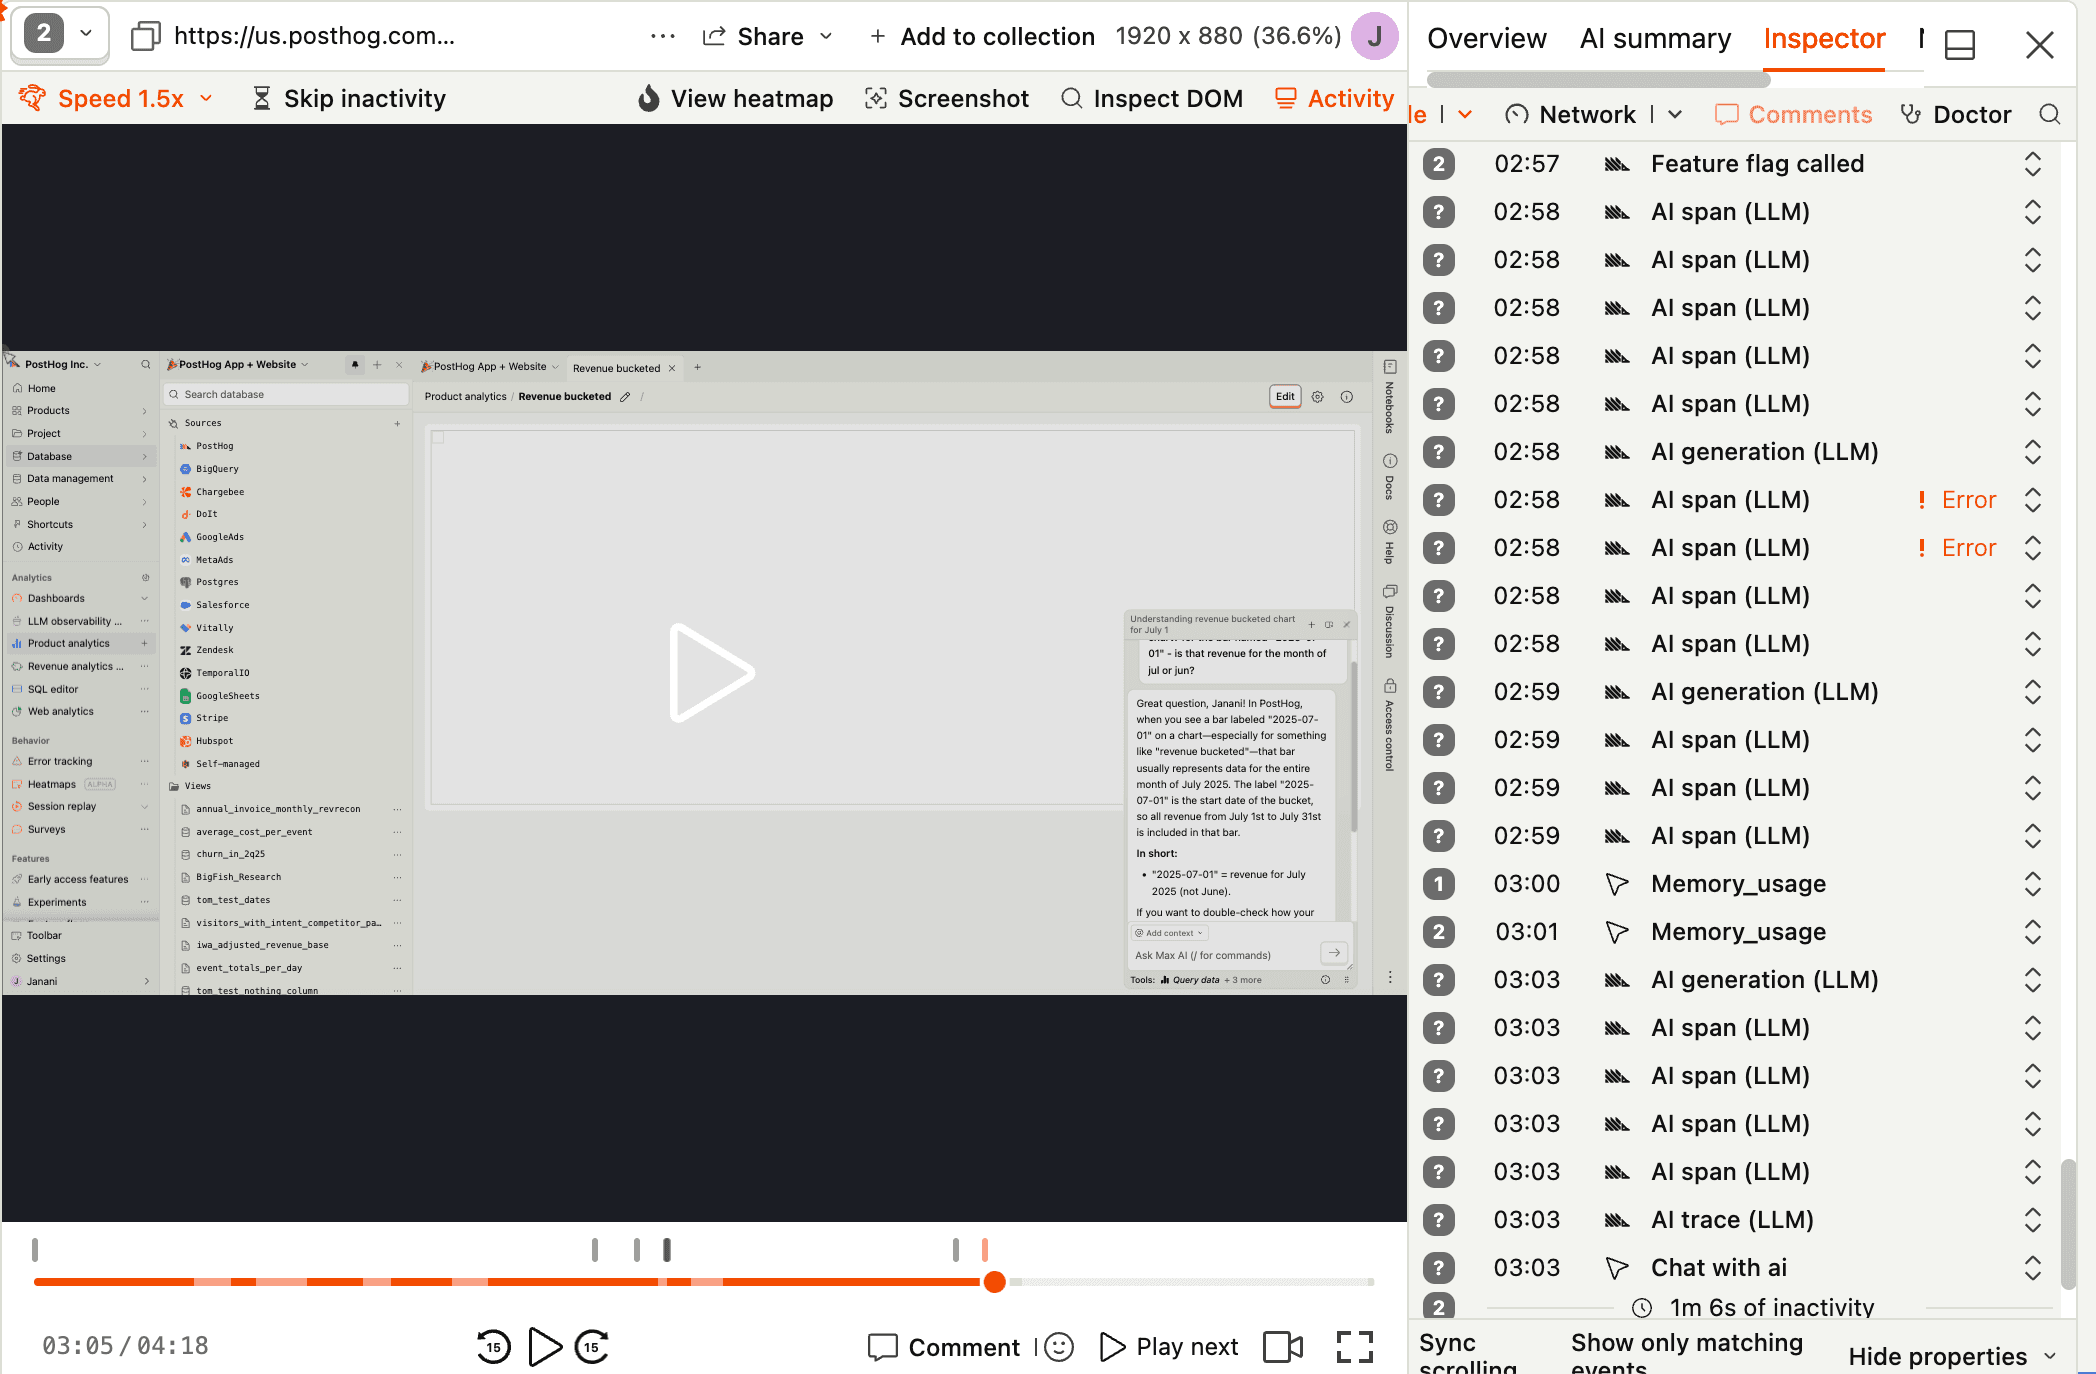
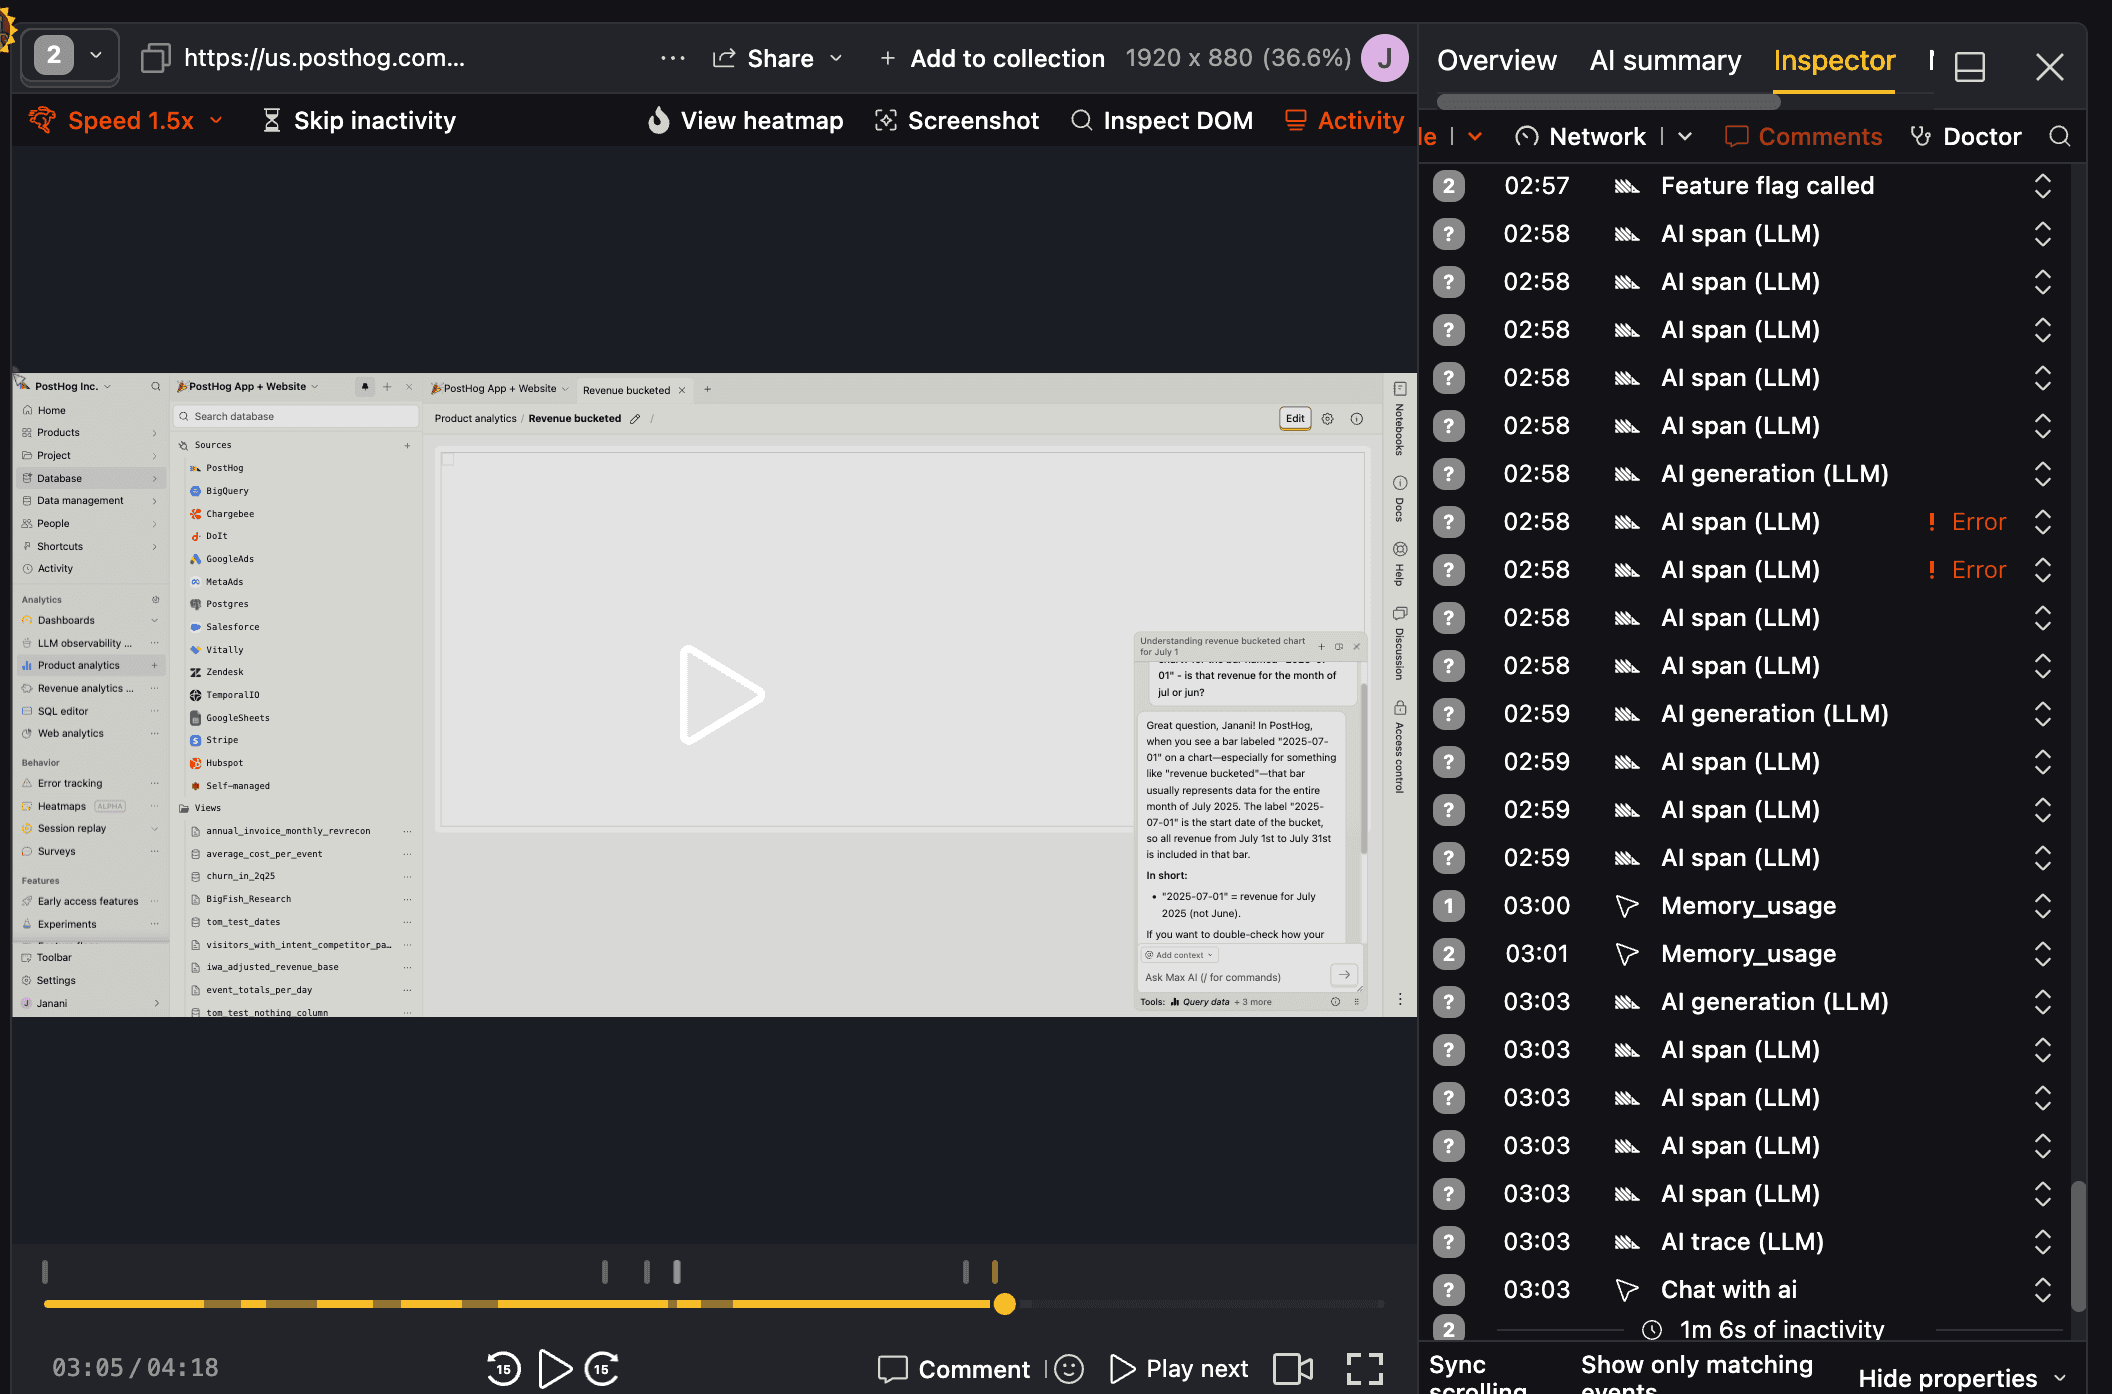
Session replay
Watch session replays to see exactly how users interact with your LLM features.
Power Self-driving
Your LLM data is a signal source for Self-driving, feeding it two ways:
- ⚖️ Eval reports – an agent reviews your online evaluation results in batches and sends a summary of its findings to your inbox
- ⚠️ Anomaly investigations (alpha) – when an anomaly alert fires on a cost, latency, or error insight, an agent investigates and only reports true positives
Want more control? Configure a scout – a scheduled agent that explores your LLM data on your terms and files what it finds as signals and reports.
Reports land in your inbox, where one click turns them into a PR.
Learn it by use case
The reference tells you what everything does. The pocket guide walks you through real problems, end to end.
Use for free
PostHog AI Observability is designed to be cost-effective with a generous free tier and transparent usage-based pricing. Since we don't charge per seat, more than 90% of companies use PostHog for free.
TL;DR 💸
- No credit card required to start
- First 100K LLM events per month are free with 30-day retention. Every event whose name starts with
$ai_counts as an LLM event - Above 100k, we have volume-based pricing starting at $0.00035/event and falling to $0.00006/event as volume grows
- Set billing limits to avoid surprise charges
- See our pricing page for more up-to-date details
That's it! You're ready to start integrating.