


How to track high-volume APIs

Contents
Tracking high-volume APIs is a balancing act. You want to keep them as efficient as possible, while still capturing data to improve them. This tutorial aims to help you find this balance.
We'll build an API in Express, add PostHog, and then implement two solutions for tracking:
- Sampling using feature flags
- Caching usage and batching event capture
After doing this, we also show the different ways you can calculate insights.
Building our API
To start, we will build a basic API that captures and returns the ID that is passed to it. We'll use Express, the Node server framework, to do this.
Create a folder for our project, go into the folder, and initialize npm. When prompted, select all the default options.
Once done, install Express.
In your high-volume folder, create a file named index.js, and set up a basic Express app.
Lastly, add a new route that will handle high volume requests and set its path to /big/:id. For now, return a string in the response using the request ID.
Adding PostHog
Next, we install and set up PostHog.
We set up the PostHog client with our project token, instance address, and personal API key. The first two you can get from your project settings. The personal API key can be created in your account settings.
We add a client.capture() call to our /big route. The capture call includes the route distinct ID and an event name. We also include a firstRouteCalled person property to use for a filter later.
When we go to our route again, we capture an event that we can see in our PostHog instance.

In this scenario, capturing every single request to this route creates many capture requests. It hurts the performance of our API to make a request every time. Instead, we can use two different strategies for capturing them: sampling and batching.
Option 1. Sampling with feature flags and local evaluation
We can use feature flags to sample users. This way, we can easily control how many events we capture without needing to redeploy. For example, we can set up a flag to only capture specific or a percentage of:
- Users
- Cohorts
- Groups
To set this up, we must create a new feature flag:
- In PostHog, go to the feature flags tab, click new feature flag.
- Set your key name, such as
sample-flag. - Select your rollout conditions, such as 100% of users in a specific cohort. I chose "100% of users where the
firstRouteCalledperson property (we set earlier) equals/big/1". - Click save.
This setup enables us to edit this flag at any time to change the number of events we capture.
Adding our flag to our code
We can now wrap our existing client.capture()call with our feature flag code. To do this, we need to make our route async, and then call client.isFeaturedEnabled() with our flag key and distinct ID.
You might notice that this sends a "Feature Flag Called" event to PostHog on every call. We can turn this off by adding { sendFeatureFlagEvents: false } to our client.isFeatureEnabled() call.
Locally evaluating our flag
Another problem is that every feature flag call on the server side sends a request to PostHog to evaluate the flag. In a high volume API endpoint, the time it takes to make this request can add up. We can limit this by evaluating the flag locally using the person properties the flag relies on.
Because we initialize the posthog-node SDK with our personal API key, setting this up is simple. Just add firstRouteCalled in personProperties to the options in our client.isFeatureEnabled() call.
In our small example, this reduced response time by about 100ms. A massive amount for high-volume APIs where every millisecond counts.
Option 2. Cache usage and batch events
Another way to capture events for high-volume APIs is to cache usage of the API and then capture a batch of events at regular intervals.
To do this, we use node-cache to create a basic cache to store the number of requests, then use node-cron to set up a cron job to read the cache, capture values for each of the IDs, and clear the cache.
First, install them both.
Next, set up our cache. It simply gets the amount of API calls for a param ID and then increments it.
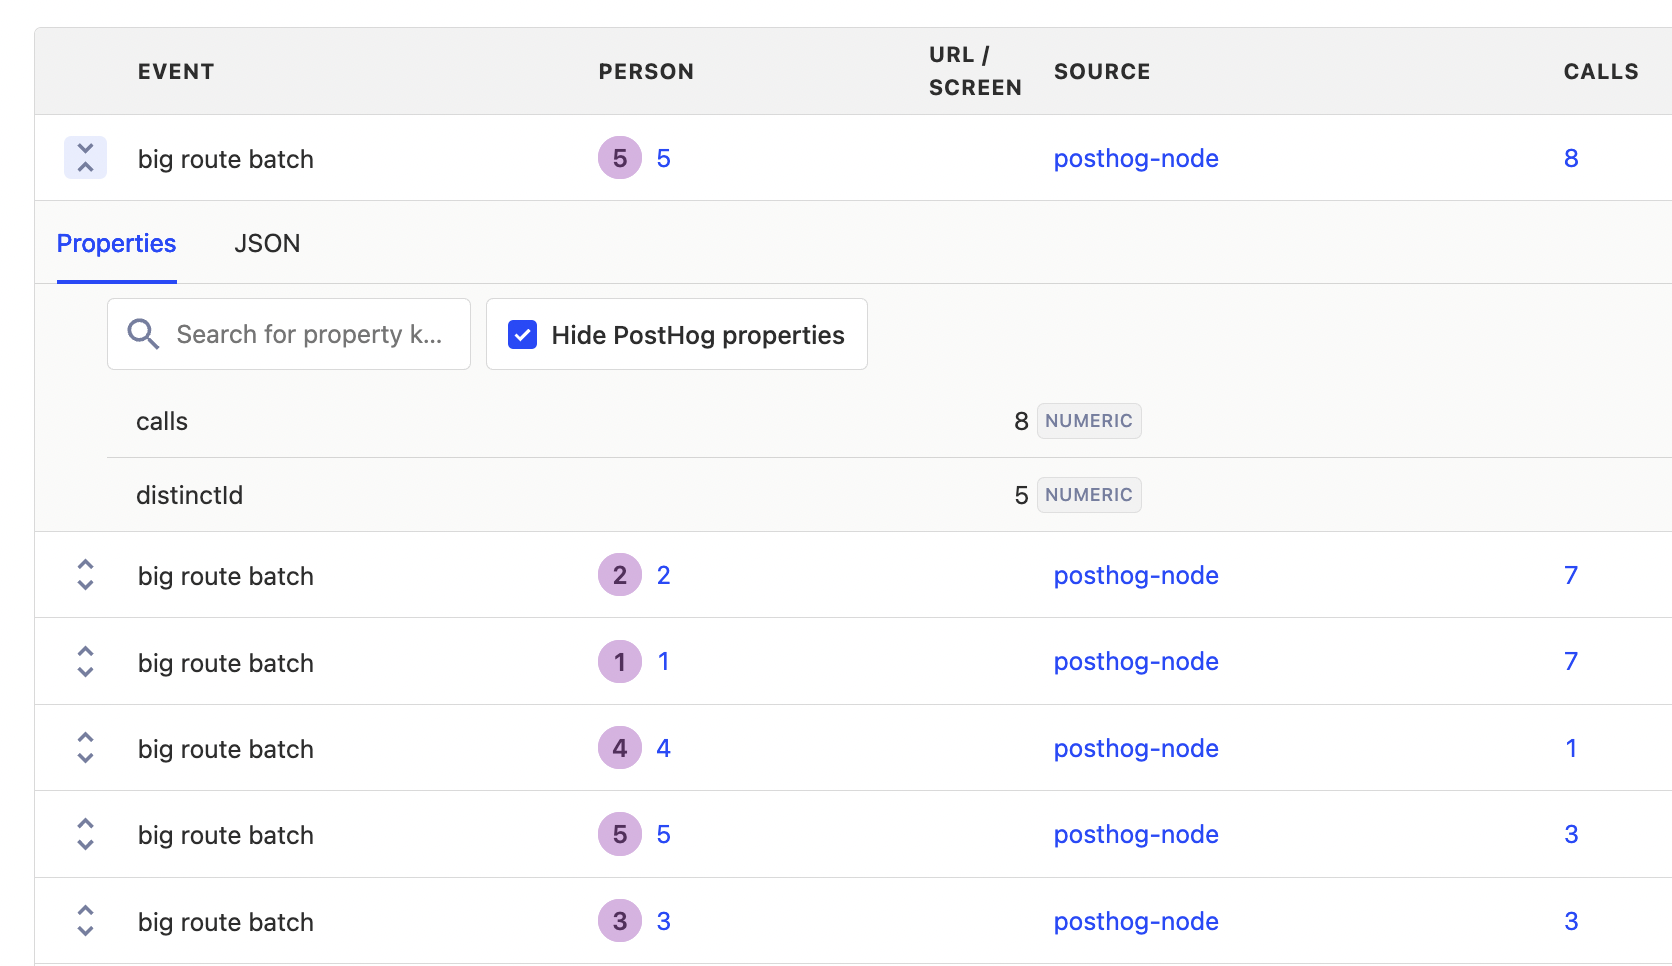
We can now set up our cron job to loop through the keys in the cache, get the number of events for that key, capture a batch event with a distinct ID (which we'll use later), and then clear the cache once completed.
Once you restart the server to implement the changes and send multiple events to an ID, you will see the event batches in your PostHog instance. Each batch event has the amount of API calls as a property which we can use for our analysis. Try sending groups of events to multiple different IDs for comparison later.
Insights with batched events
Creating insights for batched or sampled events requires a little more planning than standard insights. This is because the actual values require one more step of setup. We rely on both formula mode and property aggregations to get the actual values we want for analysis.
Extrapolating sampled events with formula mode
If we want sampled events to represent actual usage, we can multiply the rollout percentage to extrapolate a total count. For example, if we rolled out a flag to capture 10% of events, we can create an insight that takes the total count of events and multiplies it by 10.

If you are doing this, it is important to make sure your rollout percentage matches your formula multiple to avoid large inaccuracies.
Aggregating event properties
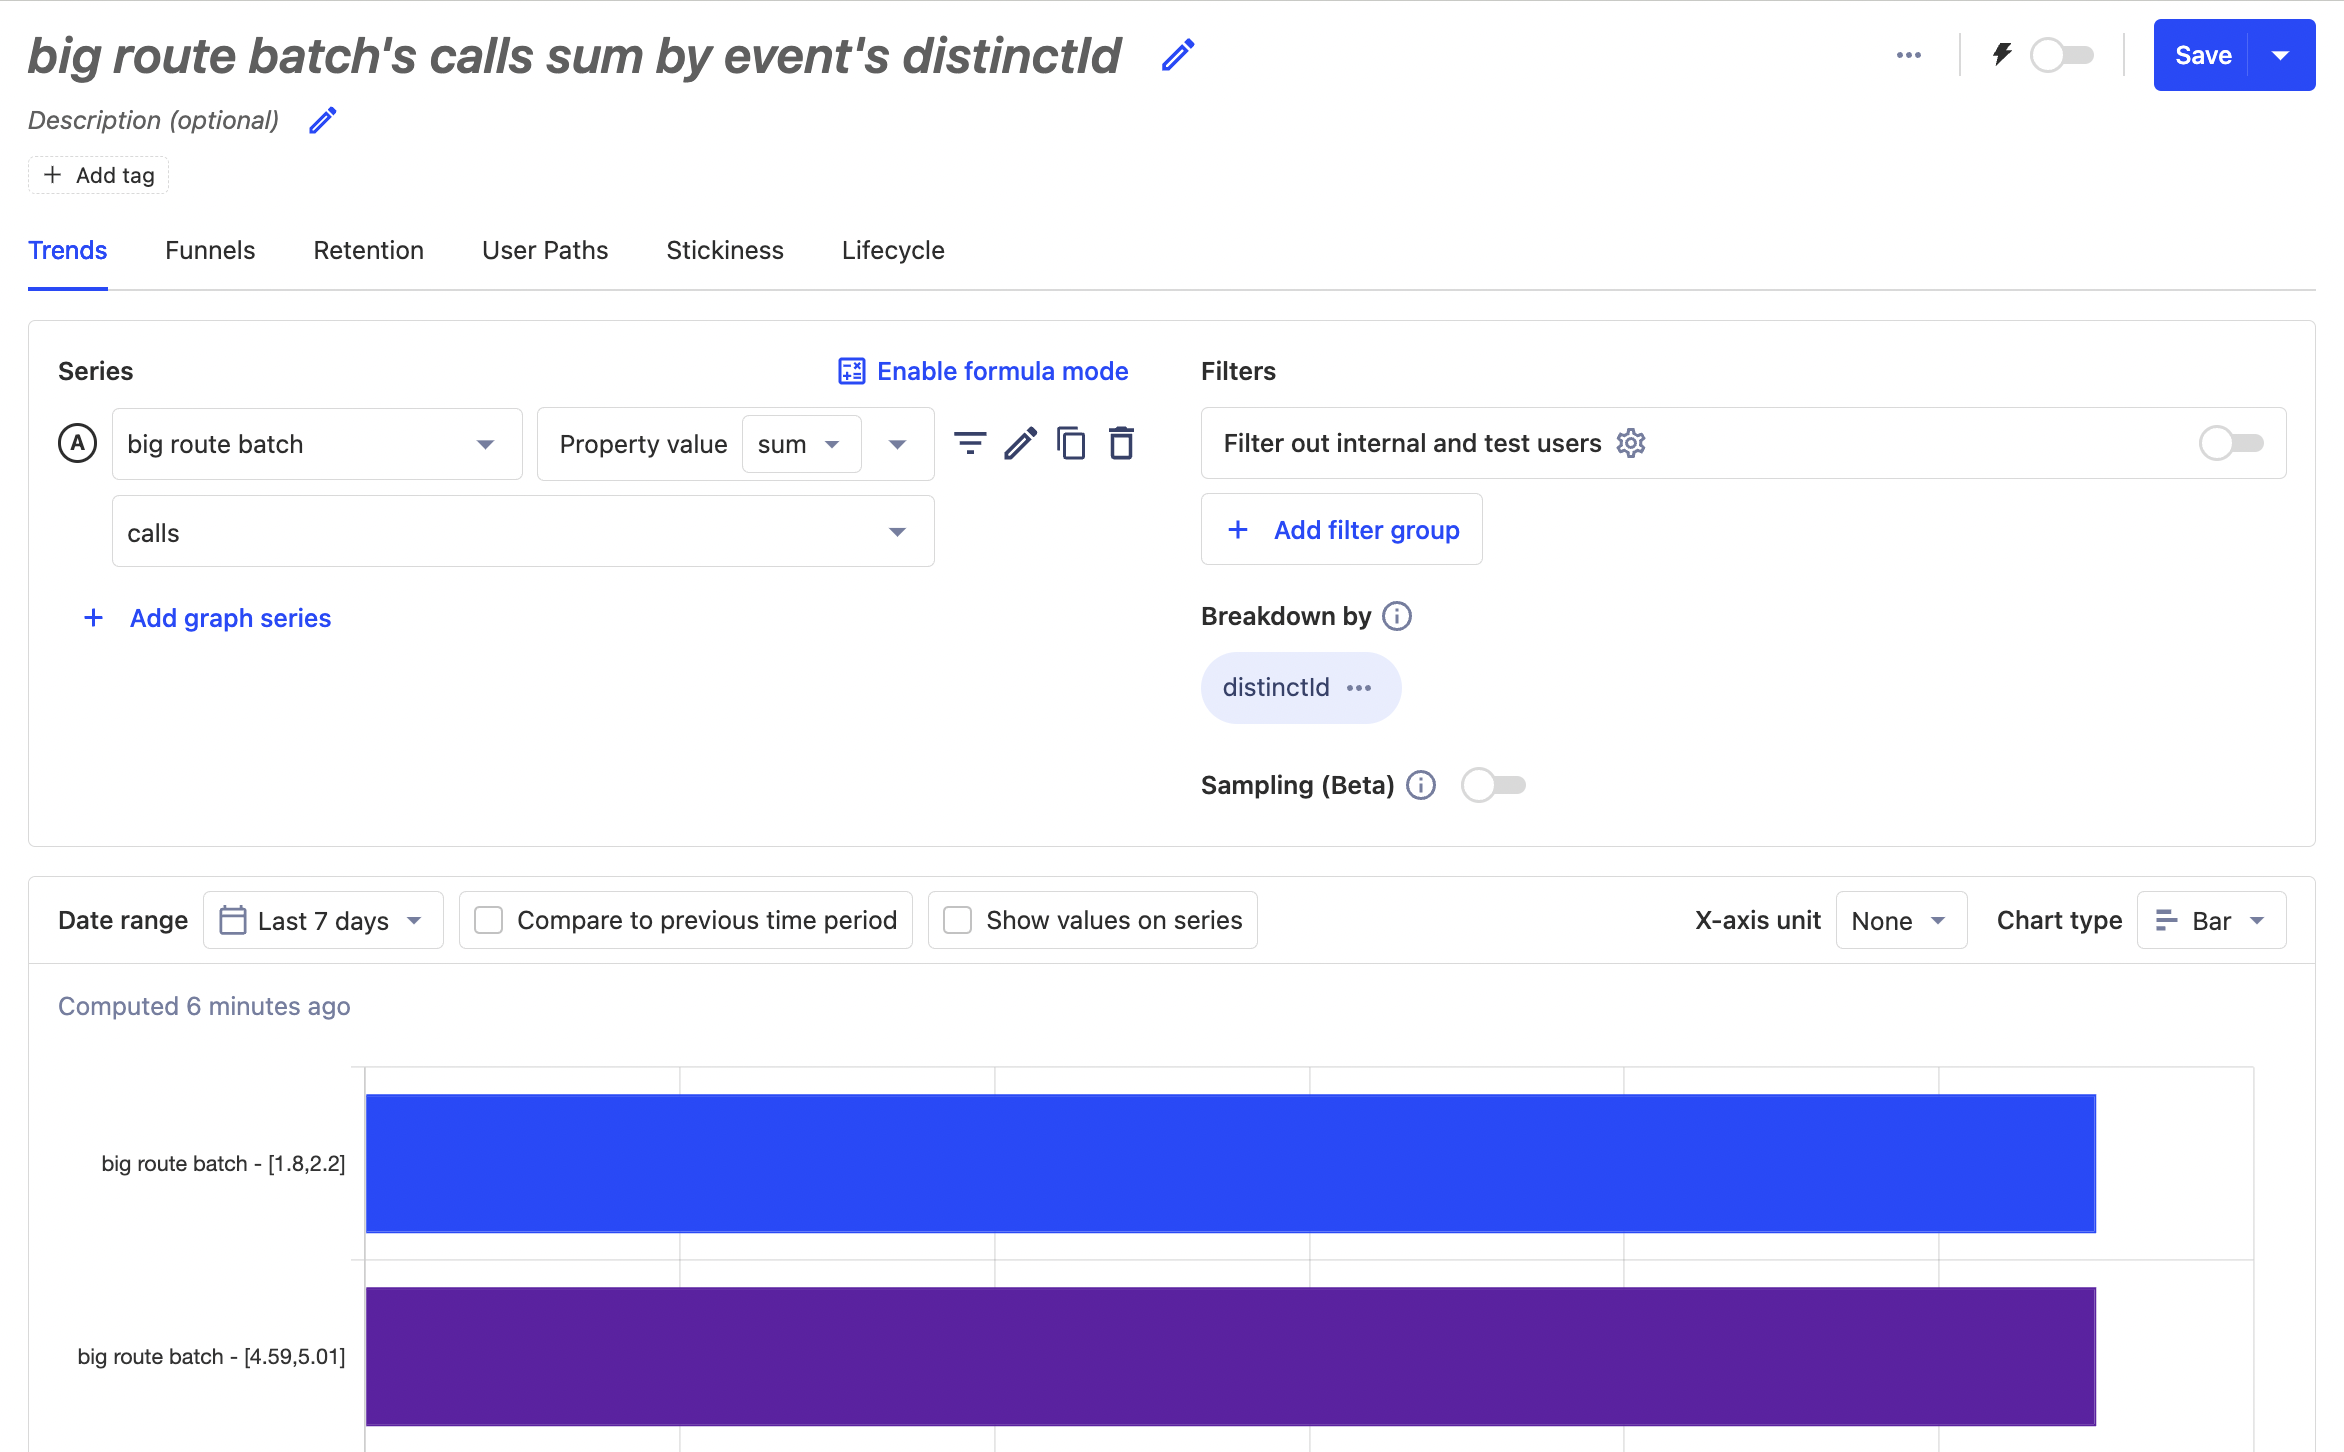
For our batched events, we can create an insight that uses the big route batch event, and then sums the property value of calls to give us our total number of calls.

Since we included an ID in the event property, we can use it to break down the sum for each of those IDs and use the total value bar chart type. This gives us a better understanding of individual ID usage of the API.
Further reading
- Using the PostHog API to capture events
- How to evaluate and update feature flags with the PostHog API
- How to set up Node.js (Express) analytics, feature flags, and more

Subscribe to our newsletter
build mode
Read by 75,000+ founders and builders
We'll share your email with Substack
PostHog is the leading platform for building self-driving products. With a full suite of developer tools – AI observability, product analytics, session replay, feature flags, experiments, error tracking, logs, and more – PostHog captures all the context agents need to diagnose problems, uncover opportunities, and ship fixes. A data warehouse and CDP tie it all together, unifying that context into one source agents can read across. You can steer it all from Slack, the web app, the desktop (PostHog Desktop), or your own editor via the MCP.