


The power of SQL’s sum() aggregation

Contents
PostHog provides multiple options for aggregating data series including total count, count per user, unique sessions, property values, and more. SQL unlocks a new level of aggregation customization, enabling you to use expressions to aggregate your data however you want. To showcase this, this tutorial goes over one of the most powerful aggregations: sum().
The basics of sum()
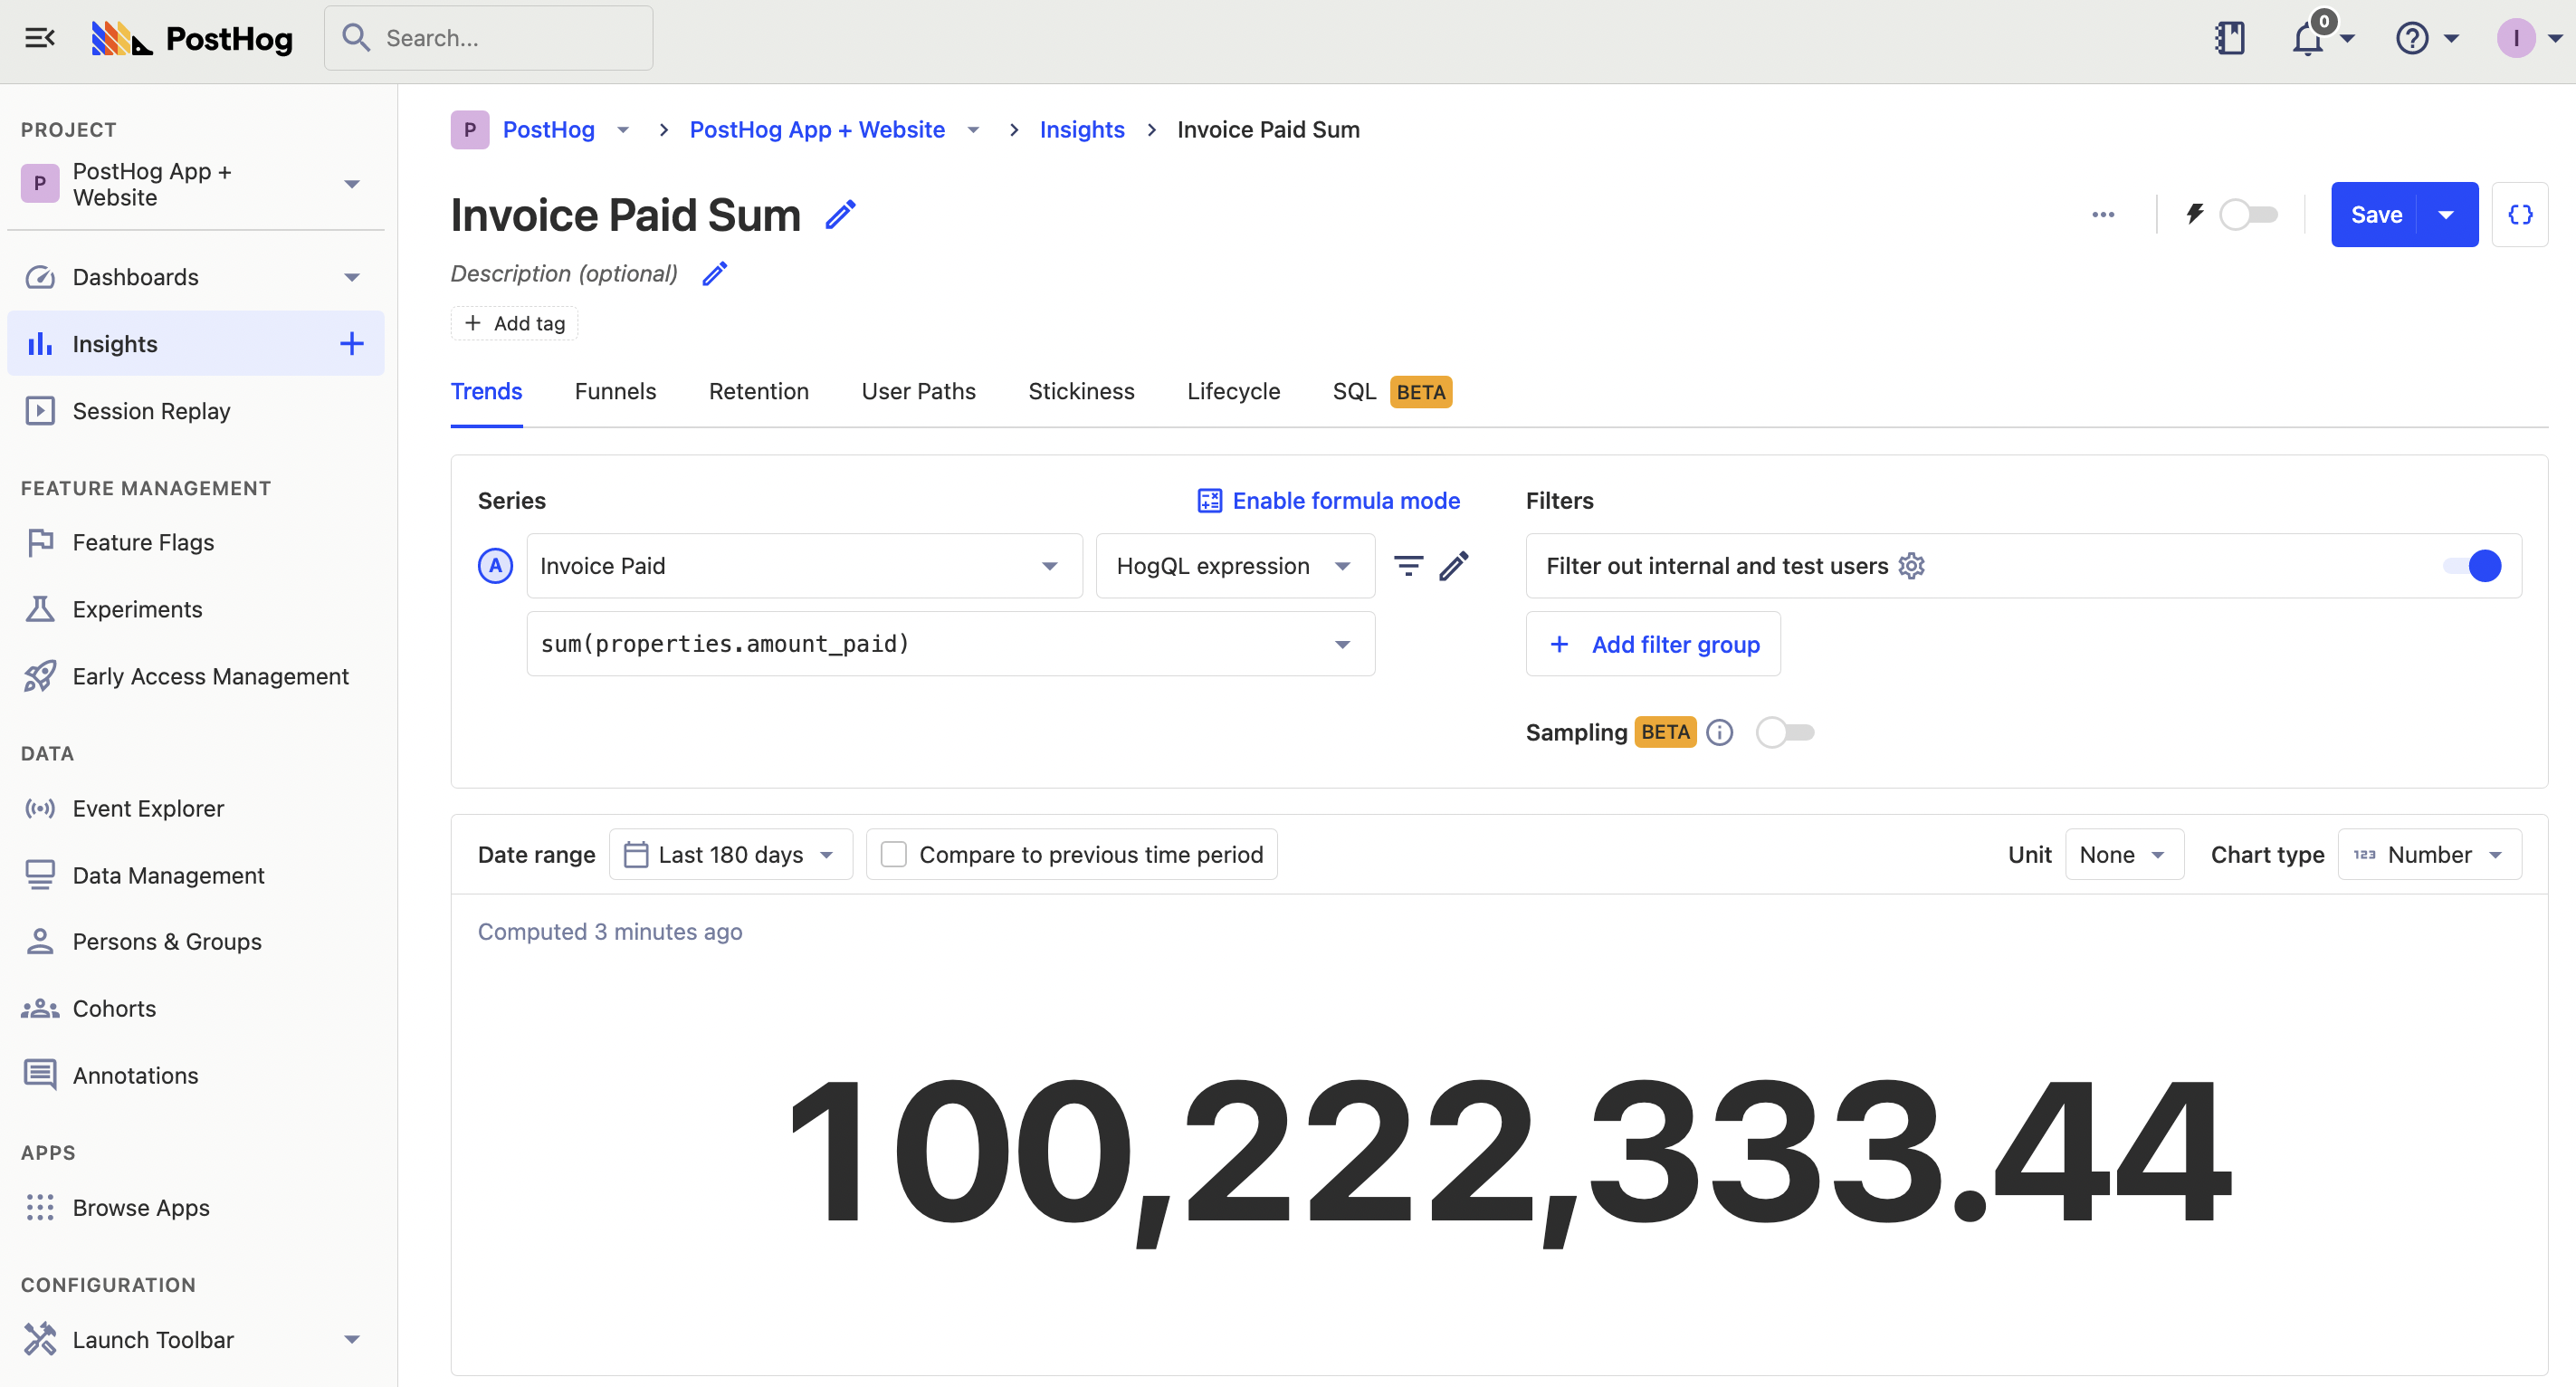
Sum is simple: it calculates the sum of the numbers it is provided. In its simplest form, we can use it to sum event properties (or nested ones). For example, to sum your revenue, chose your payment event, then sum the amount_paid property. The SQL expression for this is sum(properties.amount_paid)
Note: Sum only works for numbers. You can use
toInt()to convert any strings to numbers.
Conditional sums with sumIf()
Sum gets more interesting when we use it with conditions. This lets us sum occurrences of properties, properties that match criteria, and more.
For example, if we wanted a count of events during the current month, we could do:
Scoring criteria
A more creative way to use sumIf() is to give different weights to different values.
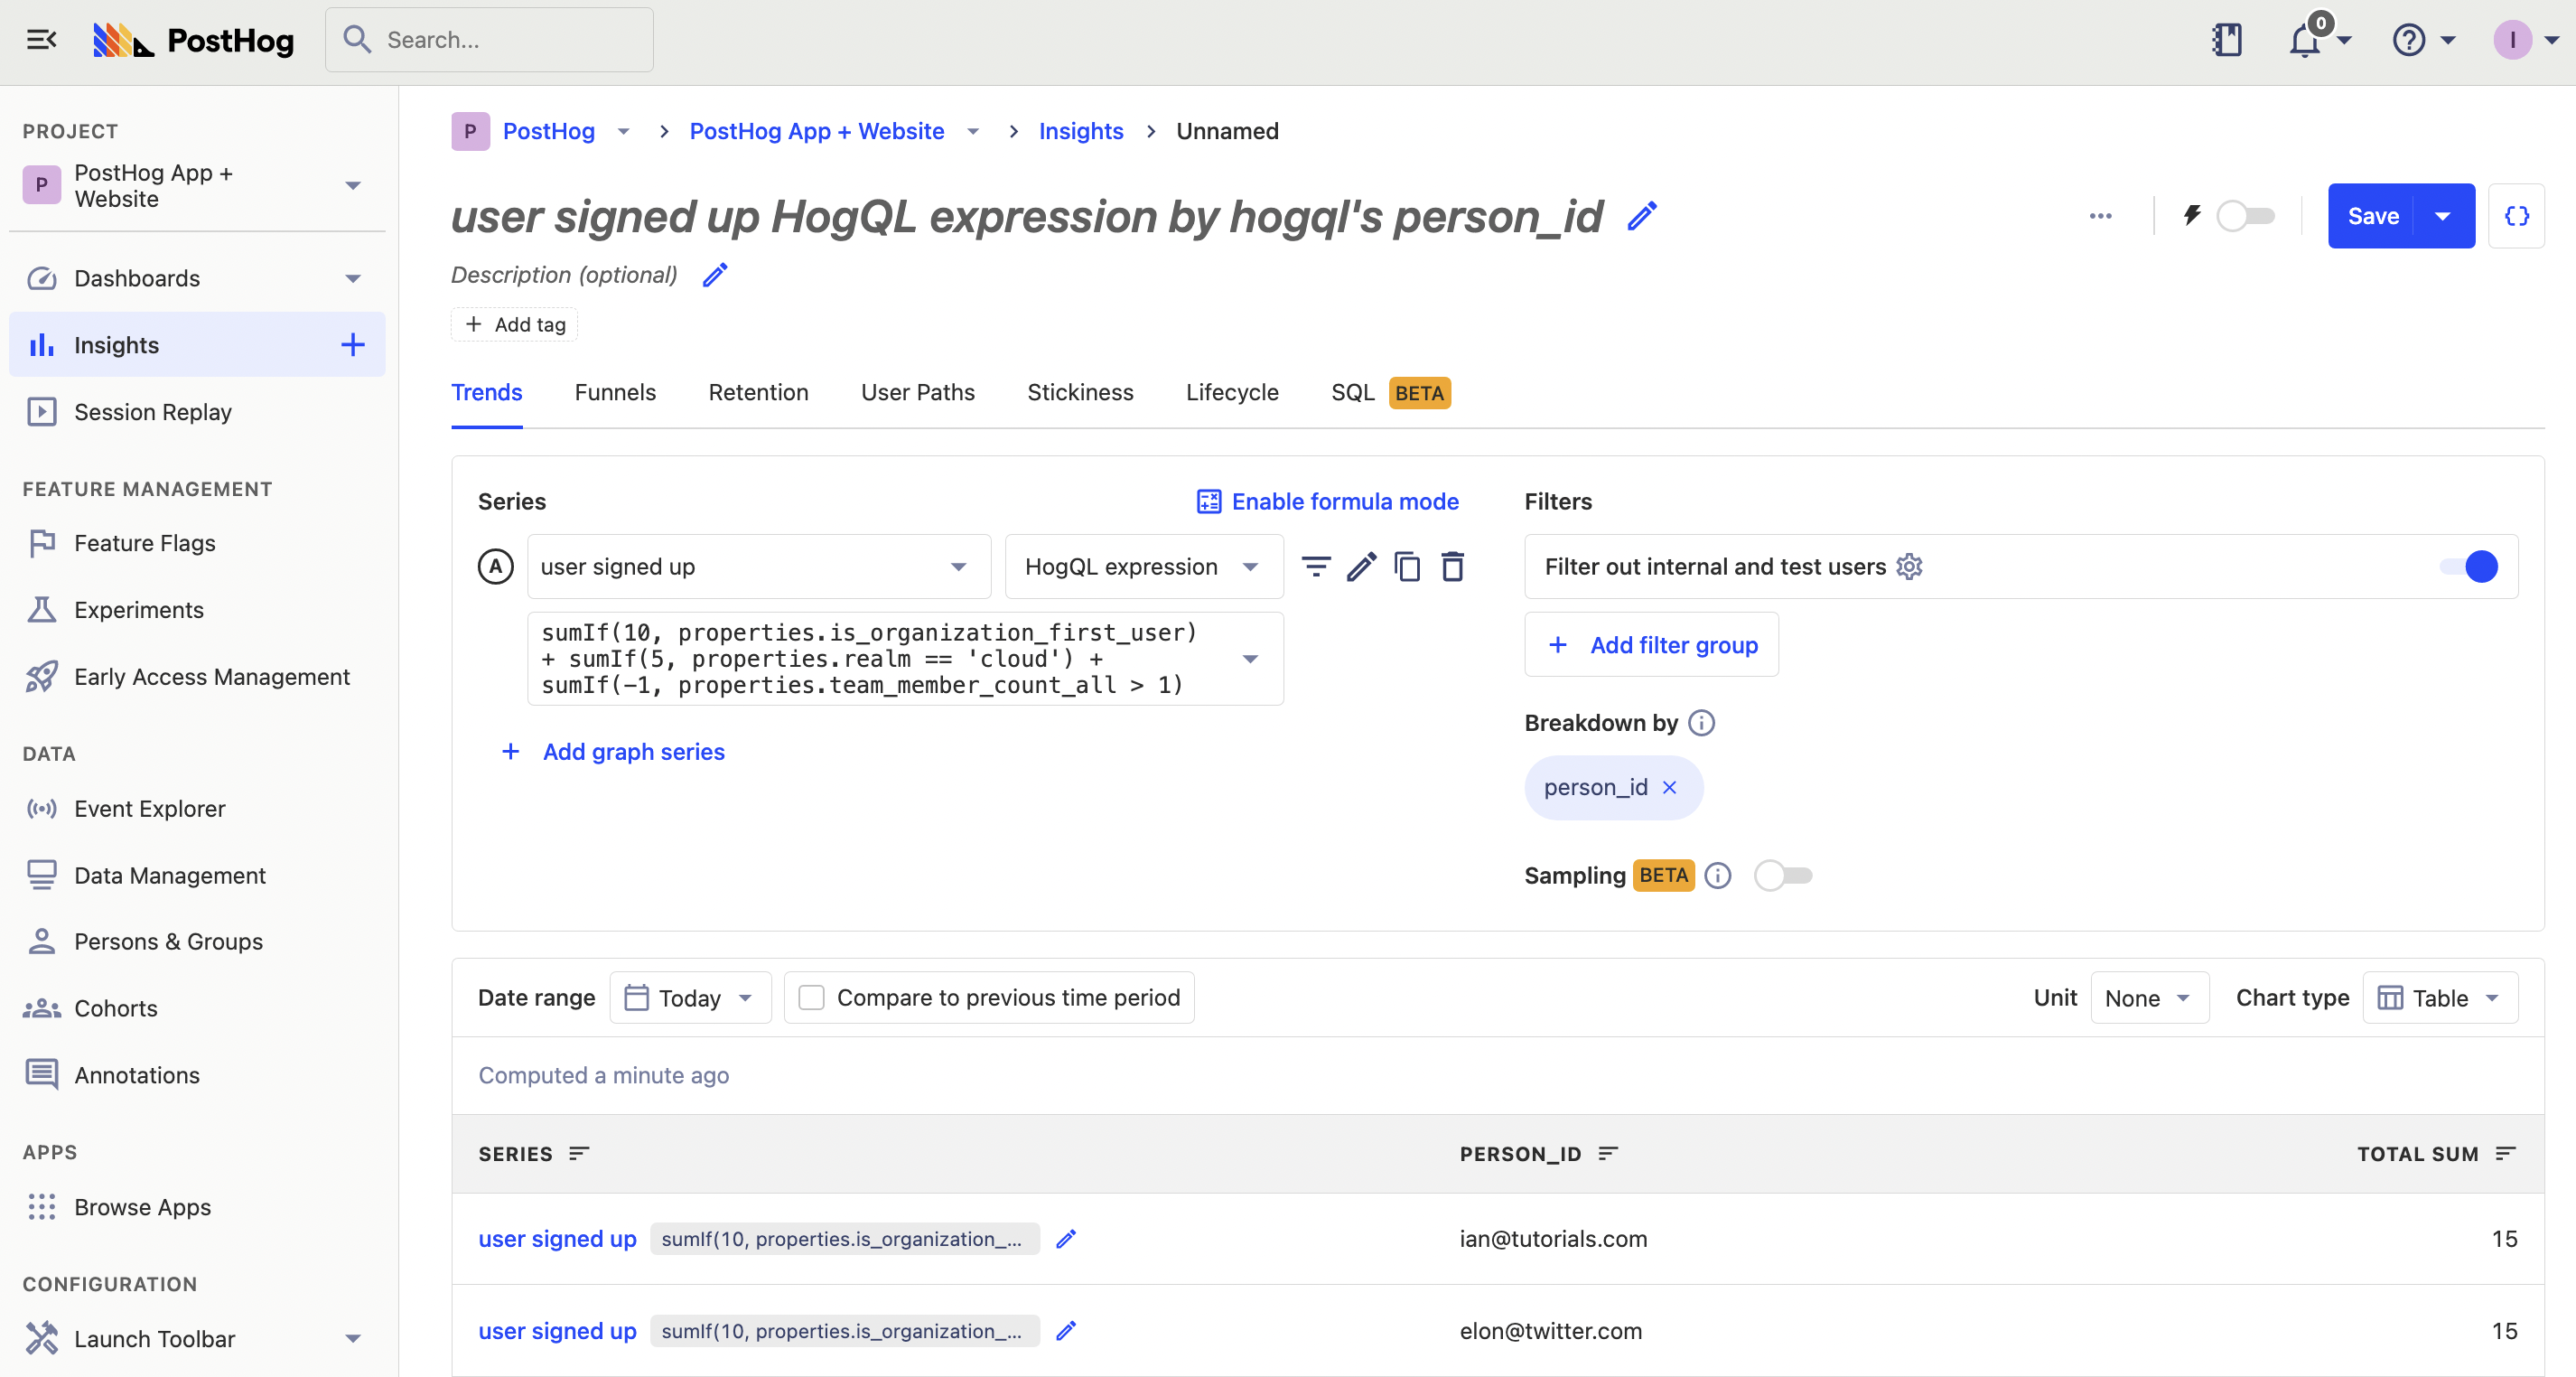
For example, if you wanted to rank sign up events based on specific criteria, you could use a chain of sumIf and different values for different properties. For example, you could sum the user signed up event like this:
- 10 points for
is_organization_first_user - 5 for
realm = ‘cloud’ - -1 if
team_member_count_all > 1
As a SQL expression, this looks like:
When we breakdown by person_id, this gives us a list of users with the highest scores, and we can customize our score this as our definition of "high-potential user" changes.
Note: Person properties can’t be used with SQL expression series, only event properties.
Sum with percentages
Using sum, you can access both the total sum and a subset of the same series. This enables powerful options for working with percentages and creating percentage-based series.
For example, let's say you wanted to compare the percentage of your total pageviews on Chrome vs Safari. To do this, first create a series where your divide the Safari pageviews by the total sum of Safari and Chrome pageviews.
Next, do the same from Chrome. Divide your Chrome pageviews by the total sum of Safari and Chrome pageviews.
Finally, chose the time series bar, and set the Y-axis to "Percent (0-1)."
Calculating net promoter score (NPS)
A similar use case for sumIf() is calculating your NPS score. NPS asks how likely would you recommend a product to a friend or colleague on a scale of 1-10. 9s and 10s are promoters, 7s and 8s are passives, and 6s and below are detractors. To calculate your NPS score, subtract your detractors percentage from your promoters percentage.
To do this in a SQL expression, use sumIf to check your score, add 1 for promoters, 0 for passives, and -1 for detractors. Divide each by the total number of responses (properties.score is not null) to get your score.
This gives us a trend of our NPS score over time, which we can breakdown using different date ranges.
Further reading
- Using SQL for advanced time and date filters
- Using SQL for advanced breakdowns
- Calculating average session duration, time on site, and other session-based metrics
Subscribe to our newsletter
build mode
Read by 75,000+ founders and builders
We'll share your email with Substack
PostHog is the leading platform for building self-driving products. With a full suite of developer tools – AI observability, product analytics, session replay, feature flags, experiments, error tracking, logs, and more – PostHog captures all the context agents need to diagnose problems, uncover opportunities, and ship fixes. A data warehouse and CDP tie it all together, unifying that context into one source agents can read across. You can steer it all from Slack, the web app, the desktop (PostHog Desktop), or your own editor via the MCP.