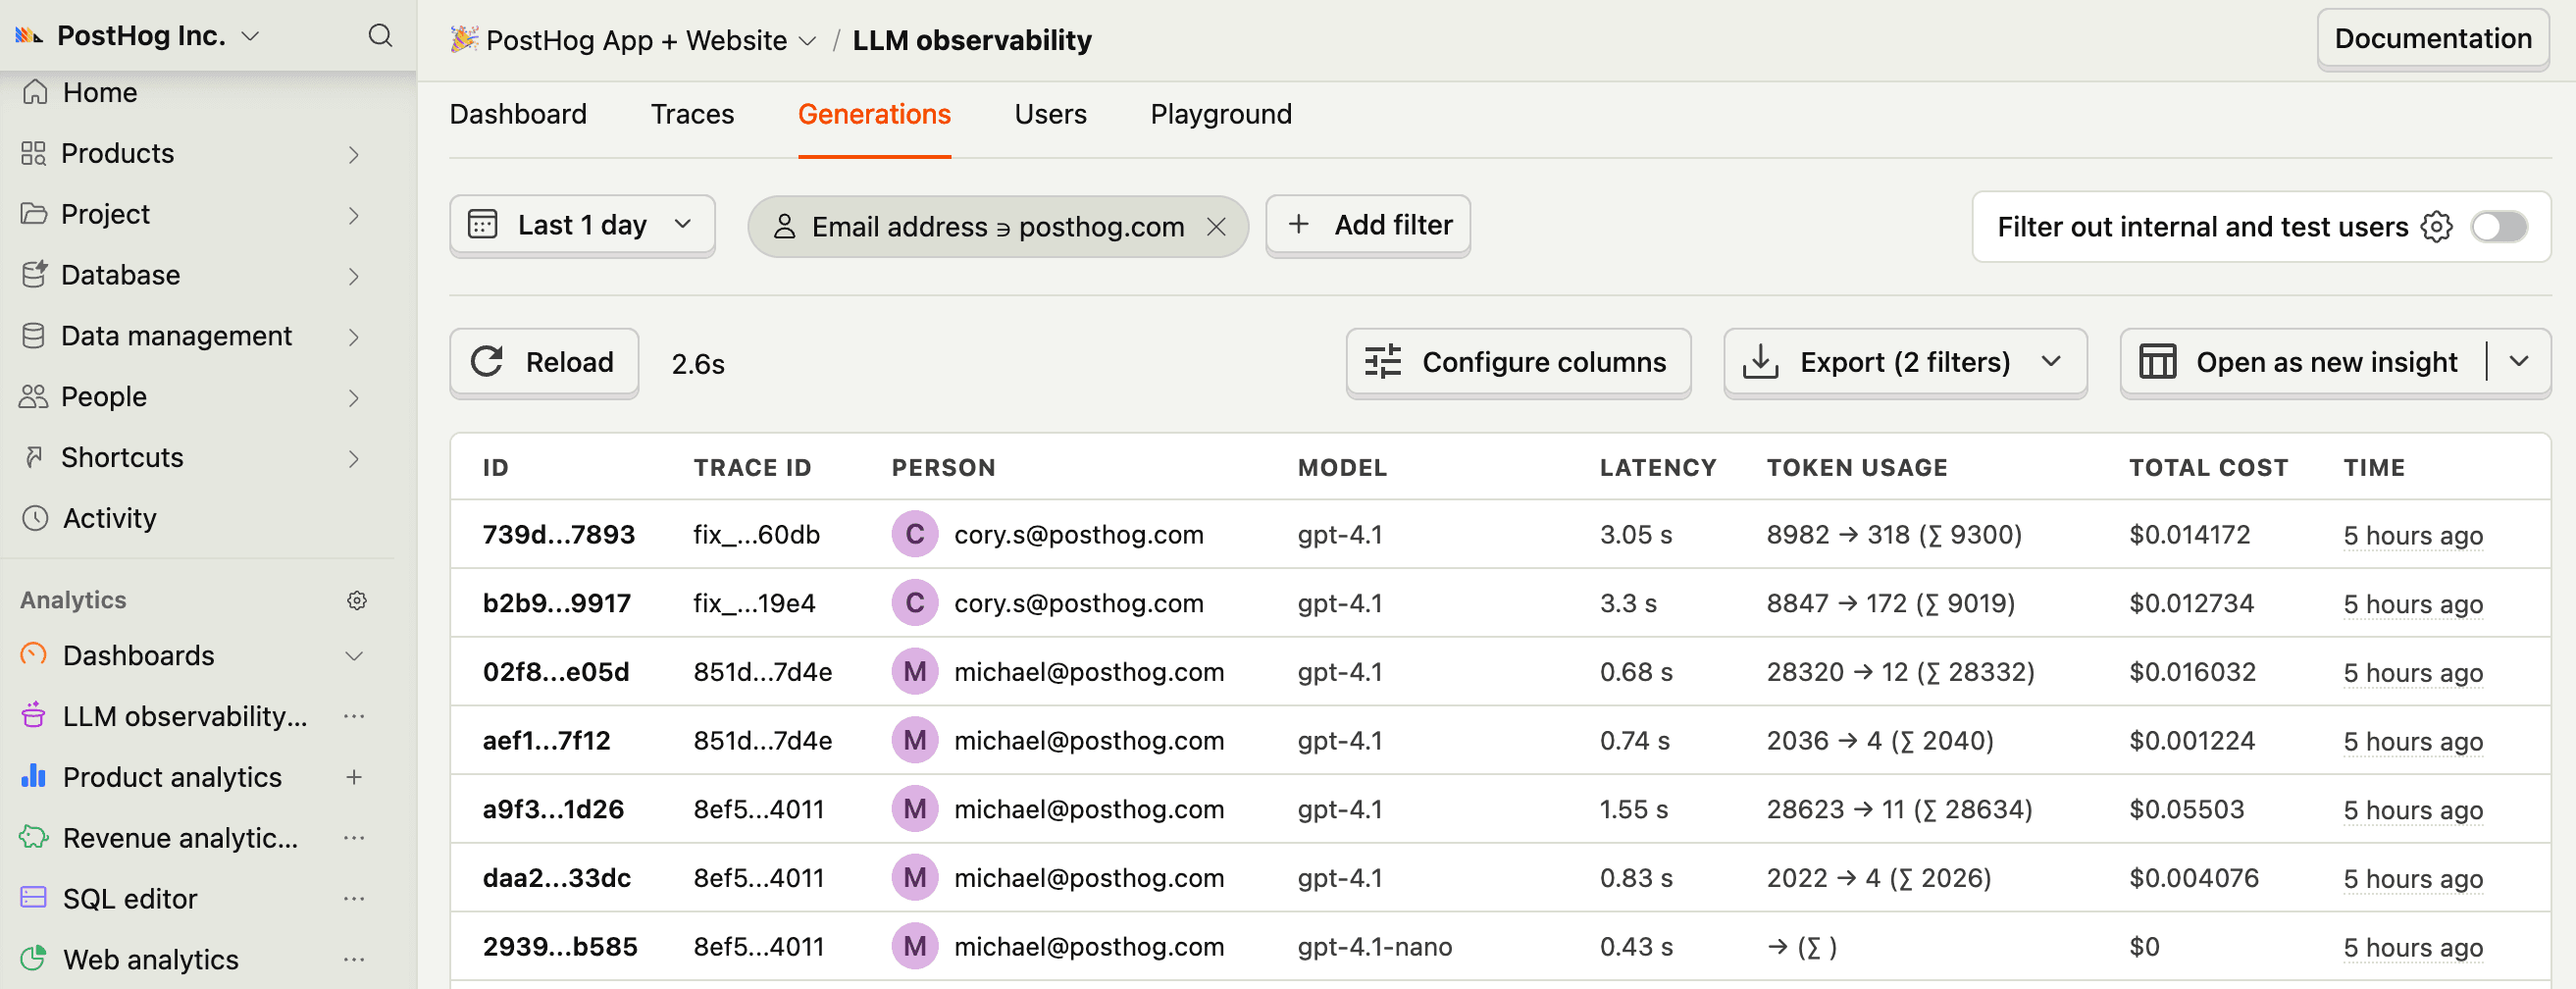
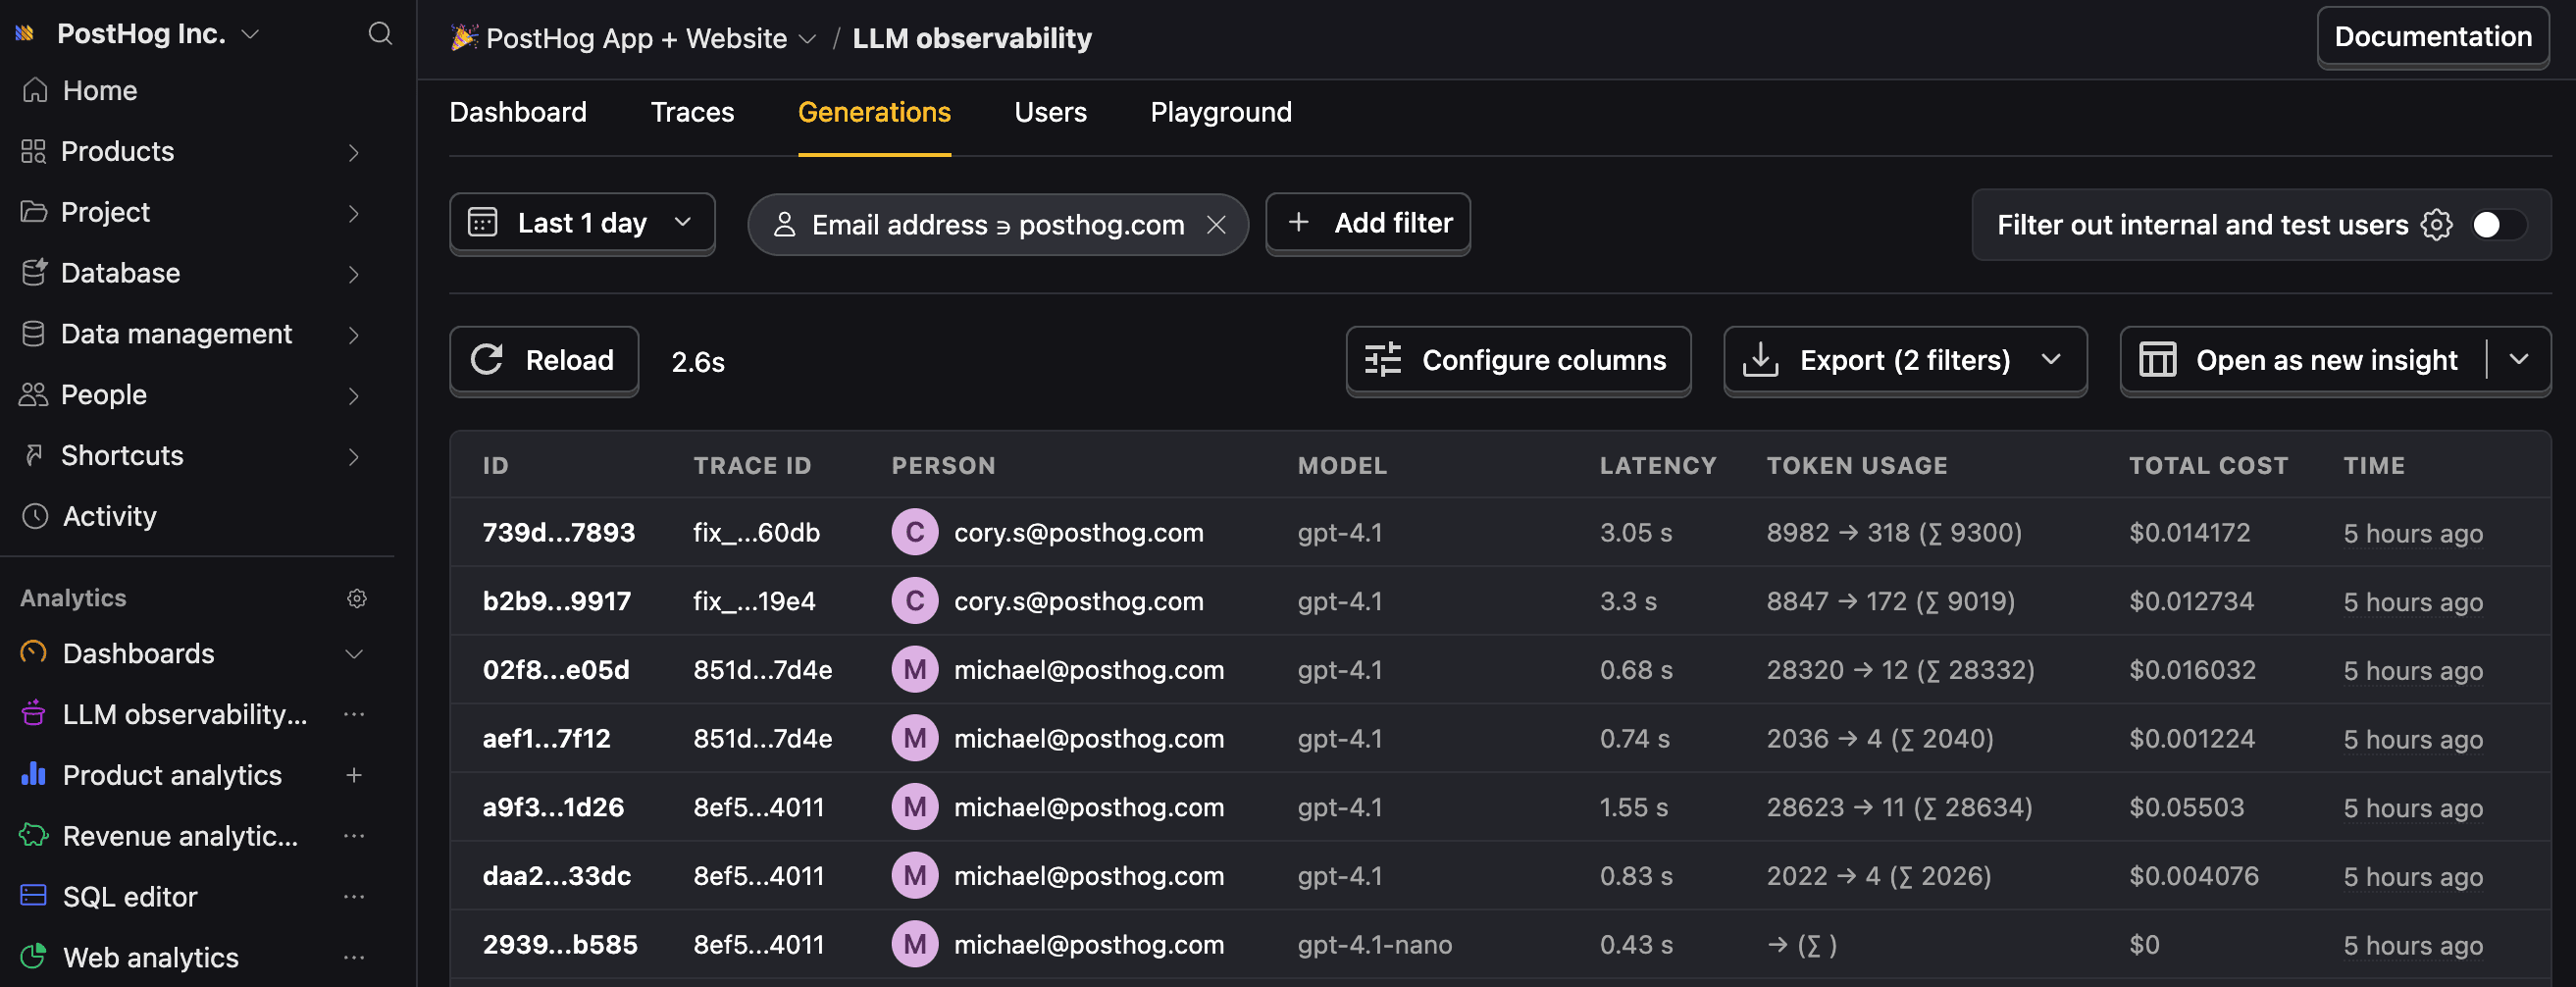
Anthropic AI Observability installation
Become a trace explorer
Send OpenTelemetry traces from Claude to PostHog with no extra code. Add PostHog as a destination in the Claude Console and run evals on live traces and ship fixes that actually make a difference.

- 1
Copy your project token
RequiredLog in to see your project token here
A personal API key (
phx_...) won't work here. - 2
Choose how to send traces
RequiredThe Claude Platform can send traces from two places. Pick one for each PostHog project. If you use both, each request reaches PostHog twice.
- SDK tracing: you set it up in your code with the Claude SDK. It covers the calls your app makes and the tools it runs itself. You can link traces to your users and add custom properties.
- Console destination: you add PostHog in the Claude Console, with no code changes. It covers your Messages API requests, server tools such as web search, and Managed Agents sessions.
Install the Claude SDK with the steps in Anthropic's OpenTelemetry guide. Then install the OpenTelemetry packages. PostHog has a span processor for Python, Node, and Go. Java and Ruby use the standard OTLP exporter.
Register a tracer provider before your first Claude call. Set the content mode to see prompts and responses, because the SDK sends metadata only by default:
You can also set the content mode with the
ANTHROPIC_OPEN_TELEMETRY_TRACES_CONTENT_MODE=contentenvironment variable.To group several calls into one session, set a conversation ID on the client or the request, as described in Configure the SDK. PostHog uses it as the session ID.
API tracing does not yet support person identification or custom properties. Anthropic is exploring ways to support this in the future.
In the Claude Console, open the OpenTelemetry settings of your organization and click Add destination. You need an admin role.
- Provider: PostHog.
- Region: US if you log in at
us.posthog.com, EU if you log in ateu.posthog.com. - Project token: paste your
phc_token. - Content mode: pick Full content to see every prompt and response in PostHog. Metadata only sends tokens, costs, and timing without the messages.
- Workspaces: choose which workspaces send their traces to PostHog: All, Selected, or All except.
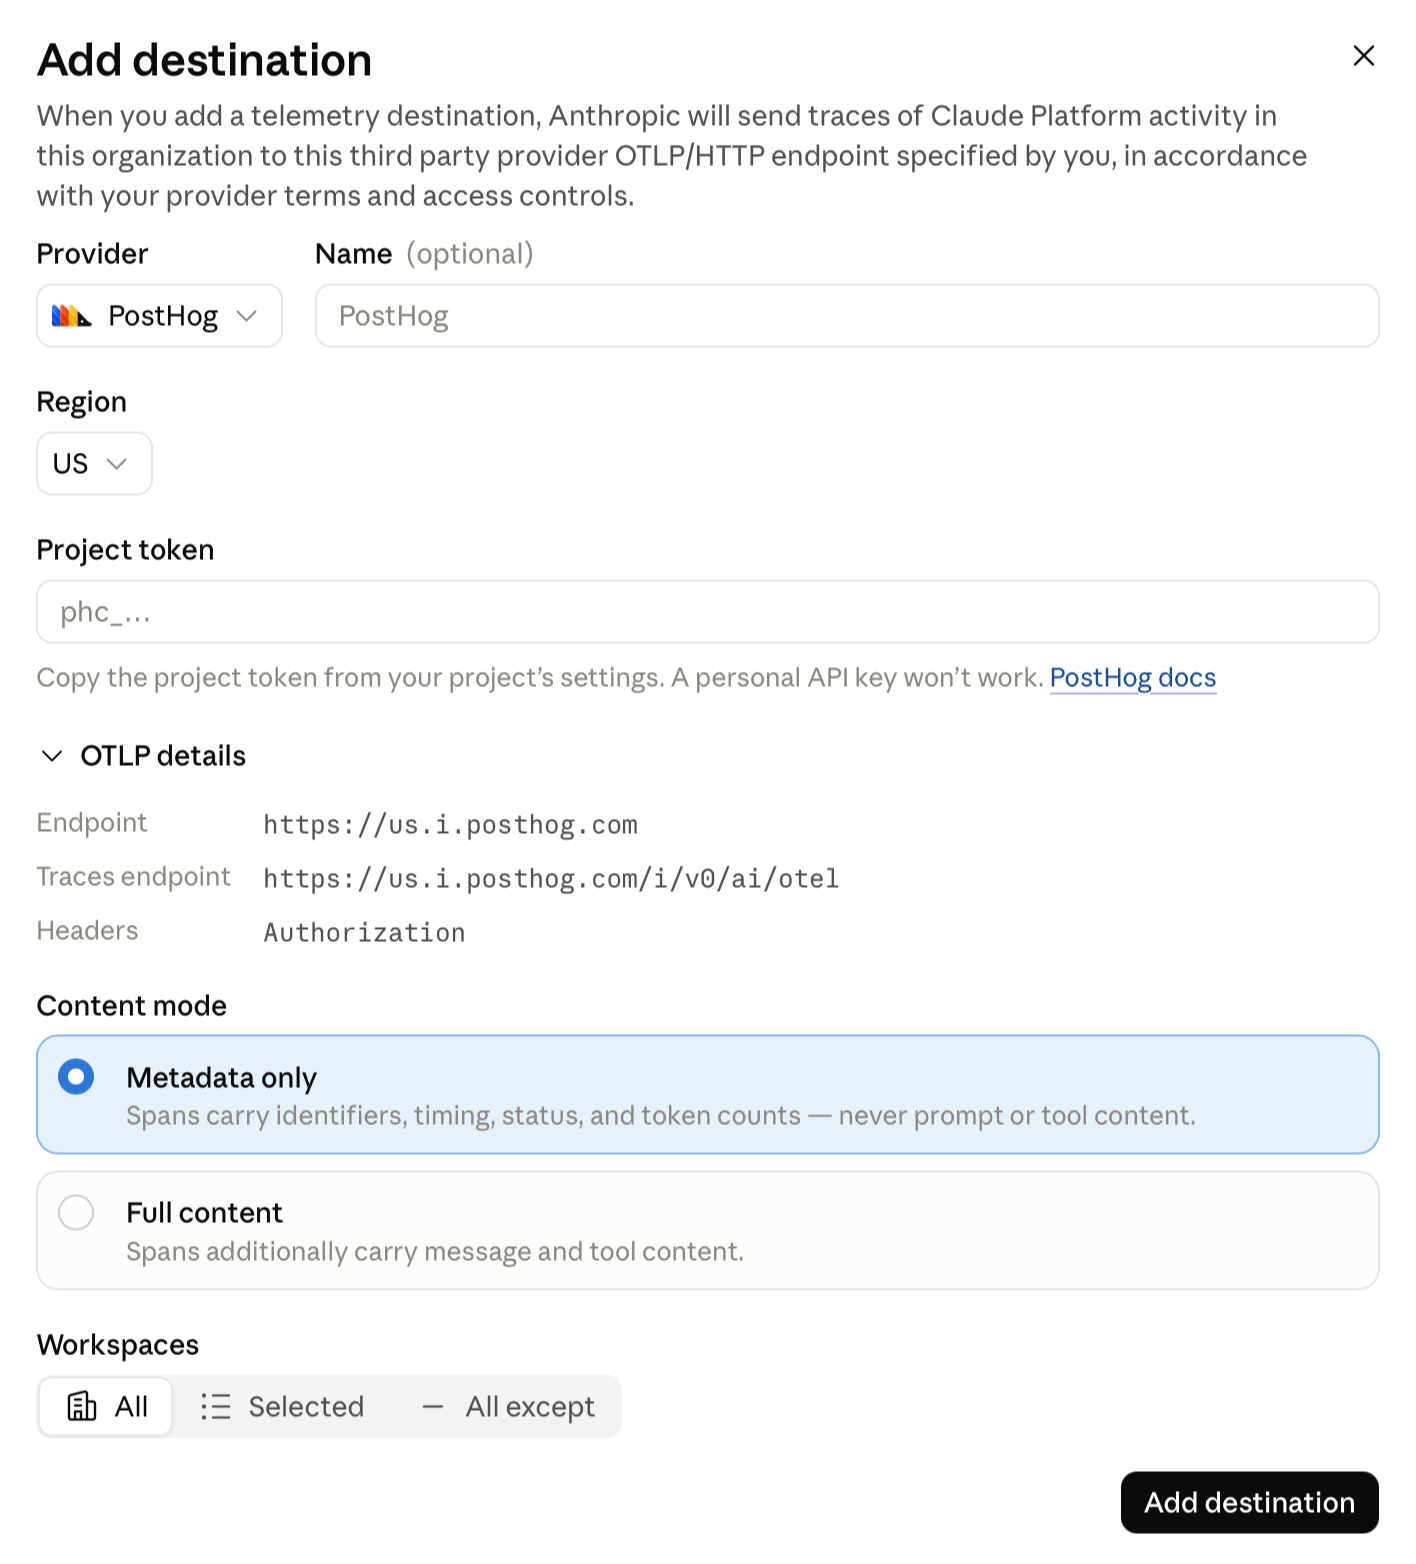
Click Add destination. Your code doesn't change.
Anthropic's OpenTelemetry guide covers workspaces, delivery health, and every span and attribute.
- 3
Call Claude and see the trace
RequiredCall Claude the way you already do, then open AI Observability. Each request shows up as an
anthropic.messages.createtrace, with its cost, tokens, and messages.- SDK tracing: if you use the tool runner, each tool it runs gets its own span.
- Console destination: the trace holds an
anthropic.model_requestspan for each model request. A request can have more than one, for example when the model uses web search.
Using Managed Agents? A Console destination also sends your sessions, with a span for each turn, model request, and tool use:
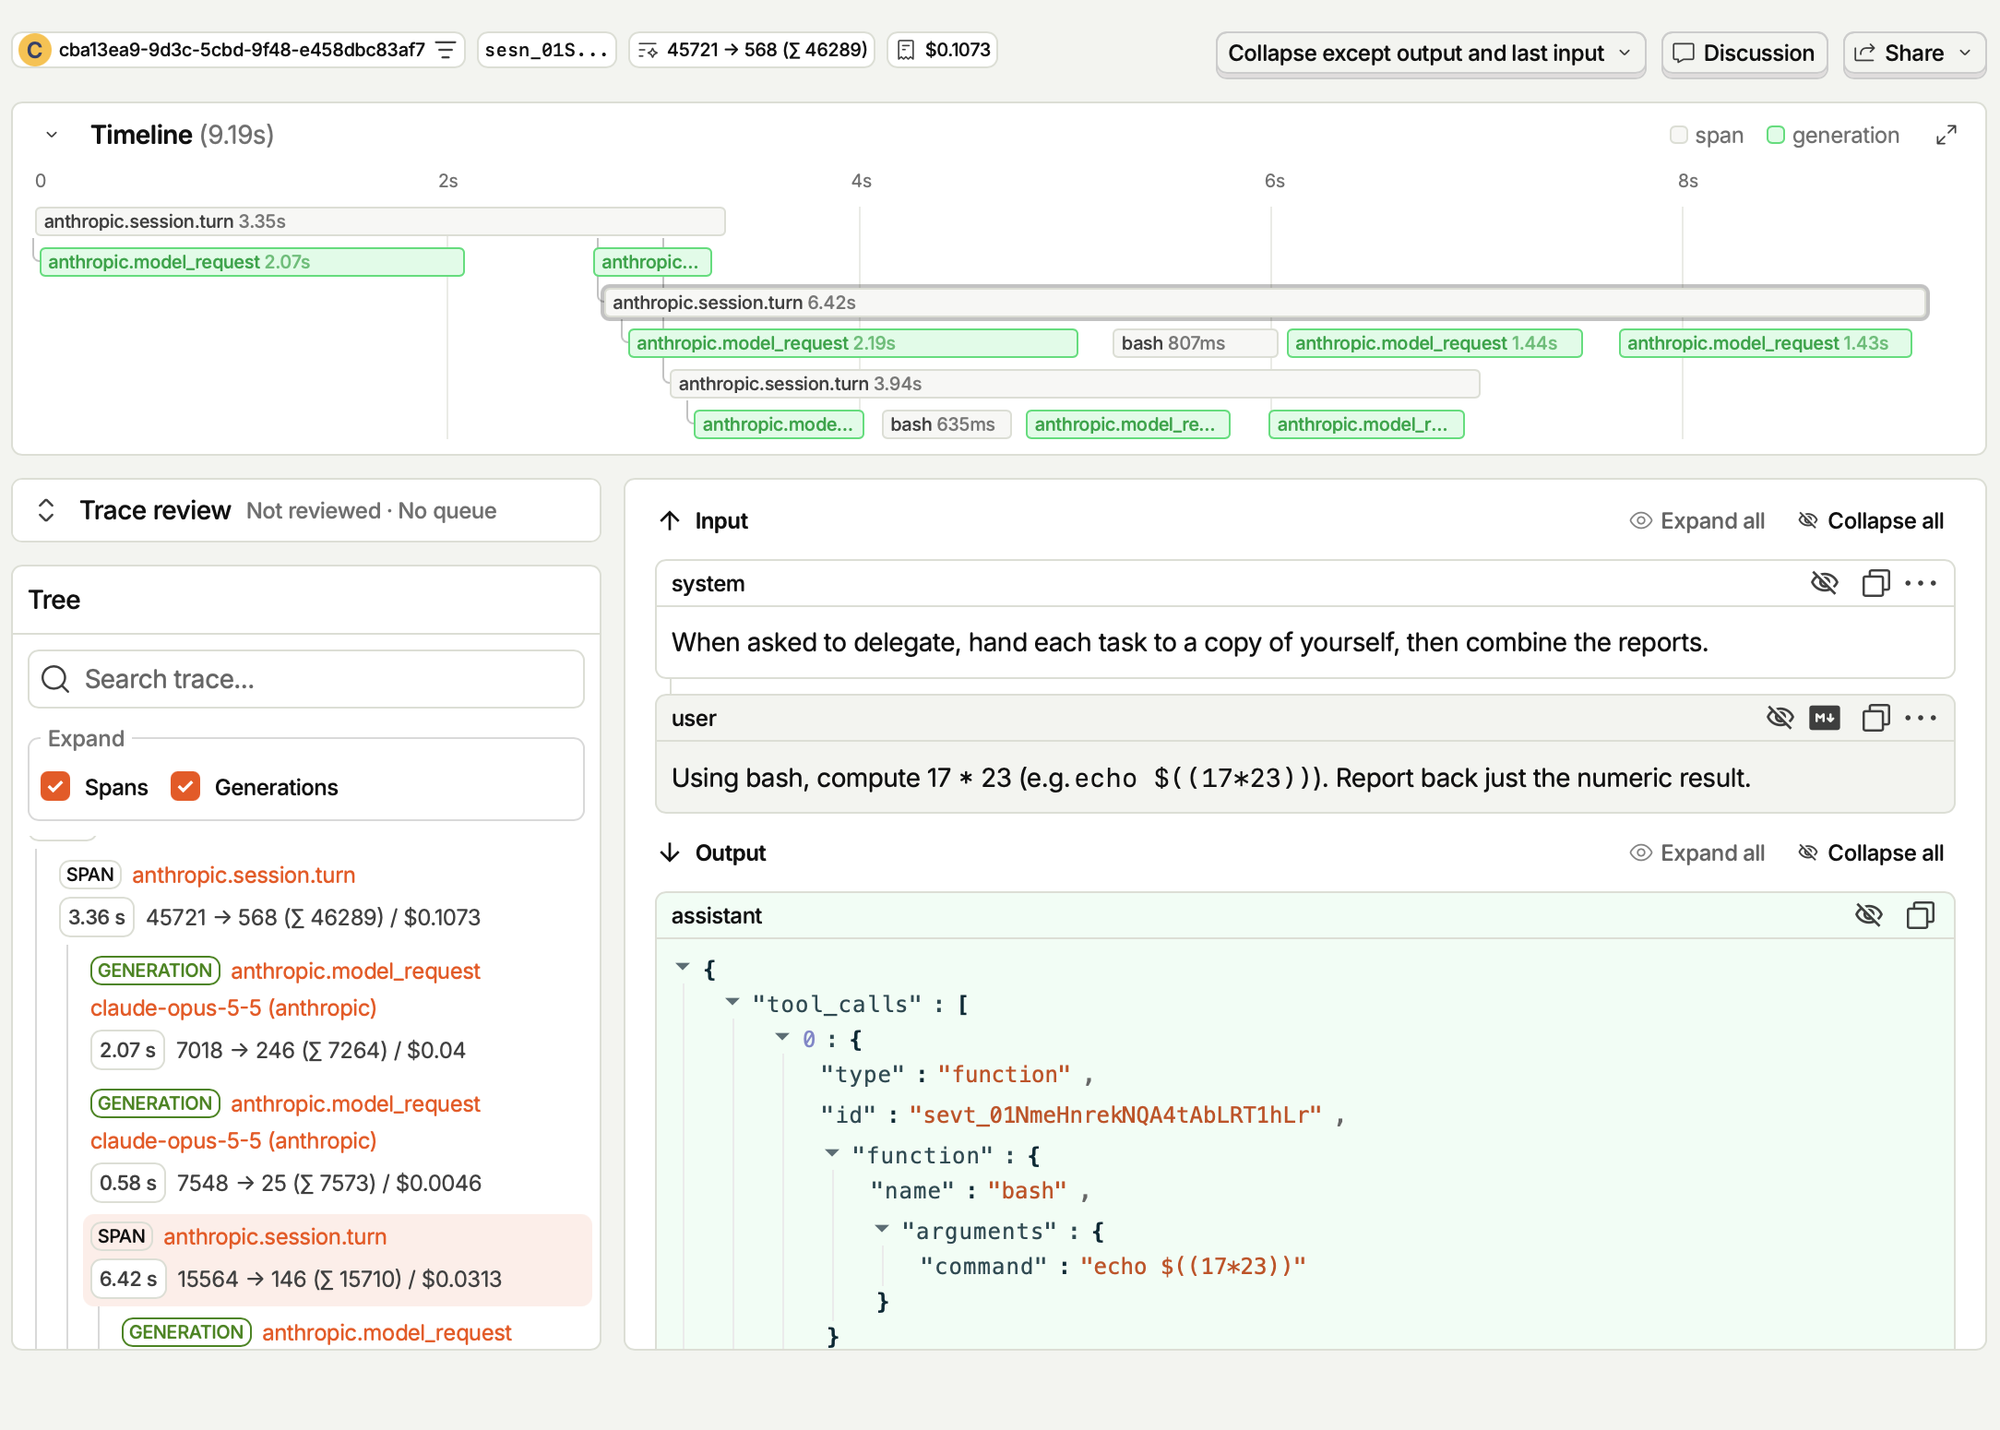
The turn holds the agent's input and output, each model request holds its tokens and cost, and each tool use holds its arguments and result. A session can span several traces. To follow one session, filter by
anthropic.session.id. - 4
Keep an eye on your agent
RecommendedYour traces are in. Now put them to work.
EvaluationsQuickly monitor how your agent is doing. Score every response for helpfulness, hallucinations, or tone, and see when quality drops.
- 5
Troubleshooting
Optional- Delivery shows Failing with a 401: the token in the Claude Console is a personal API key. Use your project token.
- Delivery shows Healthy, but PostHog is empty: check that the token comes from this project and that the region matches your PostHog cloud.
- No traces from a Console destination: check that the destination's Workspaces setting covers the workspace of your API key. Traces can take up to a minute to arrive.
- No traces from the Claude SDK: register the tracer provider before the first Claude call.
ANTHROPIC_OPEN_TELEMETRY=falseturns the spans off. - Traces stop at the end of a script: shut down the tracer provider before the script exits, as the samples do, so the last batch is sent.
- No prompts or responses: in the Claude Console, the destination uses Metadata only. Organizations with a data-handling restriction, such as HIPAA, always export metadata only. With the Claude SDK, set the content mode to
contenton the client. - Each request appears twice: a Claude Console destination and the Claude SDK both send this project the same requests. Remove one of the two.
For other questions, see AI Observability troubleshooting.


Let AI instrument your LLM calls for you
Skip the manual setup — run this in your project and the wizard installs the SDK and wires up AI Observability for you.
- 1
- 2
Configure PostHog
RequiredCreate a PostHog client, then swap in PostHog's Anthropic wrapper.
- 3
Call Anthropic
RequiredWhen you use the wrapped client to call Anthropic, PostHog automatically captures an
$ai_generationevent.Note: If you want to capture LLM events anonymously, omit
posthog_distinct_idfrom the call. See our docs on anonymous vs identified events to learn more.You can expect captured
$ai_generationevents to have the following properties:Property Description $ai_modelThe specific model, like gpt-5-miniorclaude-4-sonnet$ai_latencyThe latency of the LLM call in seconds $ai_time_to_first_tokenTime to first token in seconds (streaming only) $ai_toolsTools and functions available to the LLM $ai_inputList of messages sent to the LLM $ai_input_tokensThe number of tokens in the input (often found in response.usage) $ai_output_choicesList of response choices from the LLM $ai_output_tokensThe number of tokens in the output (often found in response.usage)$ai_total_cost_usdThe total cost in USD (input + output) [...] See full list of properties - 4
Capture tool calls as spans
OptionalFor standard responses, the posthog client captures it as a generation. For all tool calls, you must manually capture them as
$ai_spanevents.See spans for the full list of span properties.
- 5
Next steps
RecommendedNow that you're capturing AI conversations, continue with the resources below to learn what else AI Observability enables within the PostHog platform.
Resource Description Basics Learn the basics of how LLM calls become events in PostHog. Generations Read about the $ai_generationevent and its properties.Traces Explore the trace hierarchy and how to use it to debug LLM calls. Spans Review spans and their role in representing individual operations. Anaylze LLM performance Learn how to create dashboards to analyze LLM performance.