


How we use Logs at PostHog

Contents
If there’s something we do a lot here at PostHog (well, there’s many things but this one is top three), it’s dogfooding our own product.
This is a crucial part of how we build better products. We're building tools for engineers, so having our own engineers using them helps us get feedback, feature requests, and even haikus.
Our team loves using Logs to debug PostHog. Here's the most important things they've learned about doing this effectively so far.
When “everything looks fine” isn’t true
For  Sven LangeSven Lange, Platform Engineer in the Infrastructure Team, opening Logs usually means something already feels off. It might start with an alert, a bug report, or a suspicious anomaly. Sometimes, that means sanity-checking reports of things like SQL injection attempts and confirming there was no real impact.
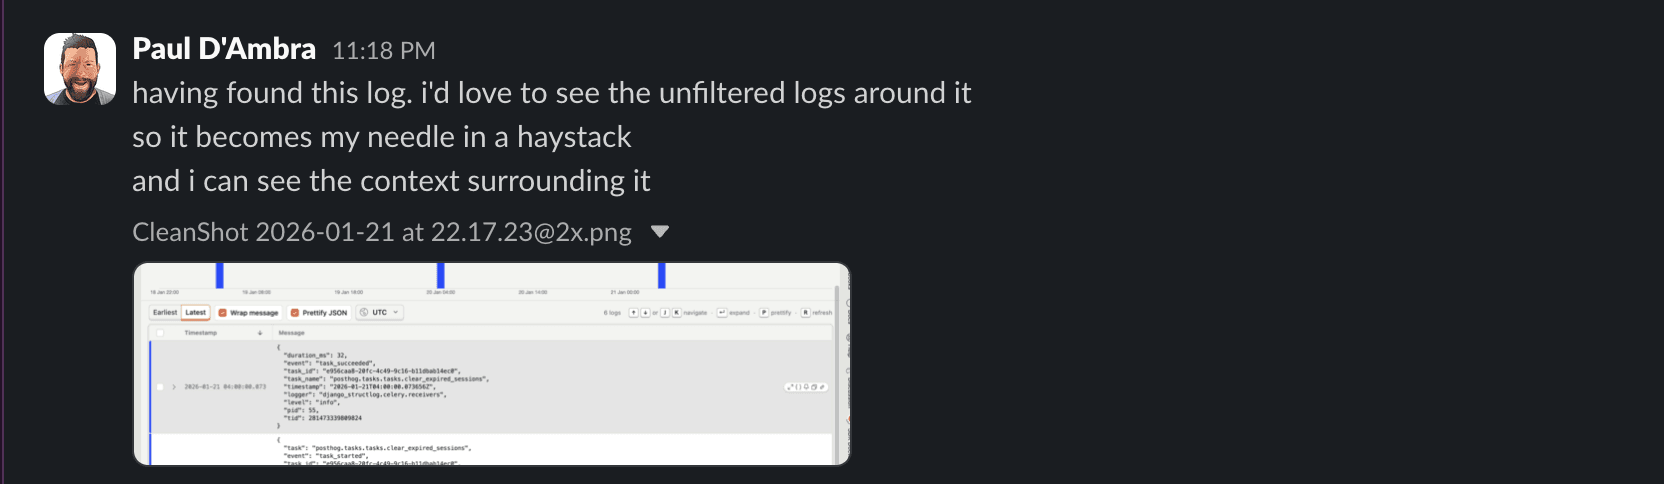
One case stood out: repeated out-of-memory crashes on a node, with no obvious explanation. Sven opened Logs, filtered down to everything running on that node, and then started ruling things out. Normal-looking logs went first, then more normal-looking logs, until only something odd remained - gzipped noise showing up where it really shouldn’t.
That “noise” turned out to be an application logging huge compressed payloads. Our previous internal log pipeline dutifully tried to read all of it, but the logs were far too large and it kept crashing, sometimes taking other applications with it.
This was exactly the kind of problem the previous logging setup was good at hiding. That system discarded the problematic data, so everything looked mostly fine… apart for the unexplained crashes.
This wasn’t just a one-off investigation. Sven flagged this pattern to the team as a logging failure, not an infrastructure one – the system was hiding exactly the data you’d want when something goes wrong. That kic ked off a round of changes around how large payloads are handled, surfaced, and filtered in Logs.
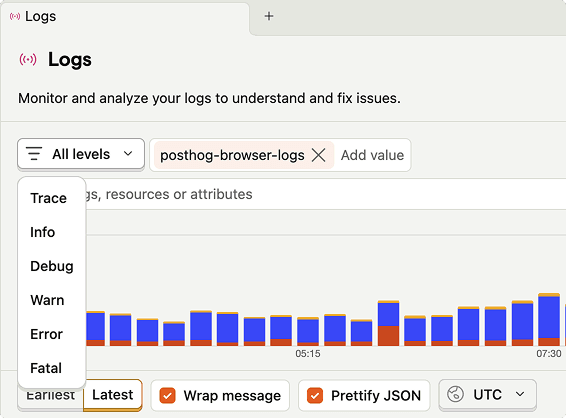
Today, that same investigation usually starts by carving things down instead of staring at a wall of output. Include and exclude filters came directly out of these cases – the need to rule things out quickly without guessing. Tracking slow HTTP requests, for example, is as simple as filtering for requests over 600 ms and seeing the results update immediately.
Sven still checks Grafana/Loki when he needs older history, but for day-to-day investigations PostHog Logs has become the default. It’s become the default for day-to-day investigations, especially when the problem isn’t obvious yet.
Logs, but with the full picture
 Rory ShanksRory Shanks and his team used to query built-in ClickHouse tables directly to inspect logs. It worked, but it wasn’t something you’d reach for when an issue was unfolding and you needed answers quickly. Until we built PostHog Logs.
Their setup now is intentionally simple. ClickHouse runs on EC2 as a systemd service. systemd writes logs to journald, Vector reads from journald, and sends everything to PostHog via OpenTelemetry. As a bonus, this doesn’t just include ClickHouse logs; it brings in system logs too.
Configuration is minimal, maintenance is basically zero, and anything that supports OTel “just works.”
Most of Rory’s questions are straightforward but time-sensitive:
- When did this error start?
- How widespread is it?
- Can I quickly share this log with someone else?
The signals were technically available before, but Logs makes it much faster to see patterns, understand impact, and collaborate. Errors are easier to scope, links are easy to share, and everything loads fast, noticeably lighter than setups they’d used before, especially when all they needed was to understand scope and timing.
Debugging without the tab circus
 Jon McCallumJon McCallum, Product Engineer in the Logs team, spends a lot of time inside Logs. Which actually makes total sense, because he’s one of the people working on it.
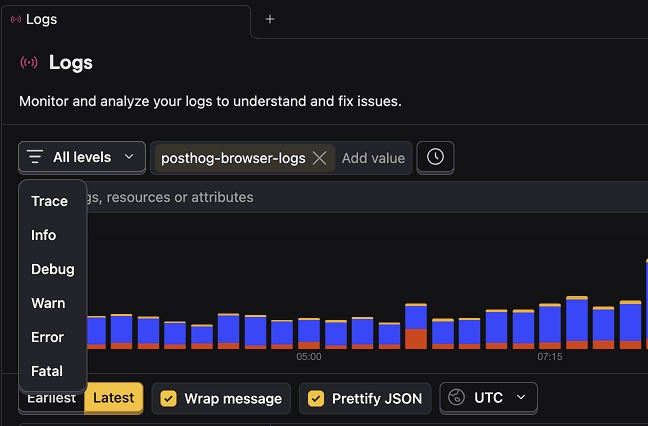
Jon rarely starts by staring at log lines and hoping for enlightenment (at least he says so). Instead, he narrows the blast radius first, a specific surface, service, or severity, until the noise drops enough for a pattern to show itself. As he tweaks the filters, the sparkline responds instantly, which is usually faster than his own intuition and much more honest.
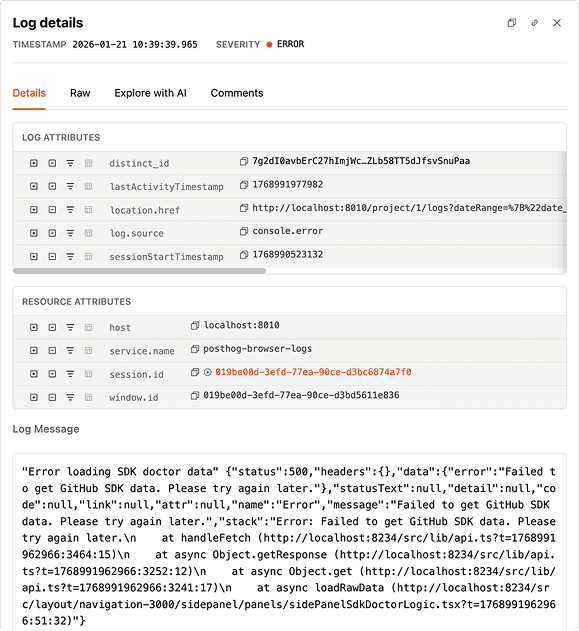
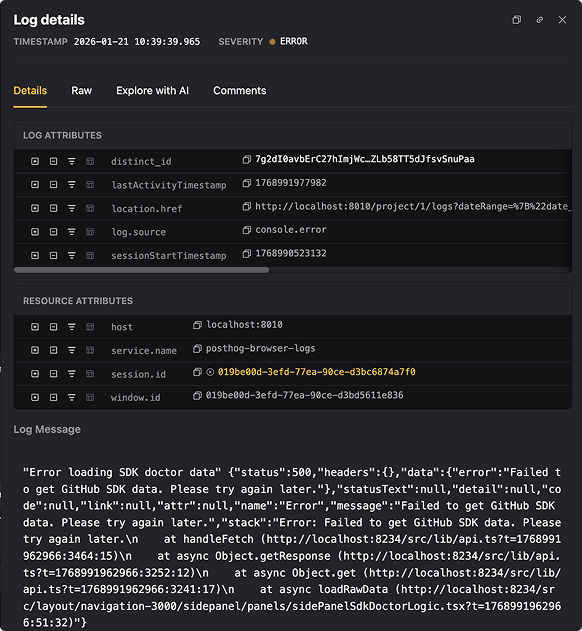
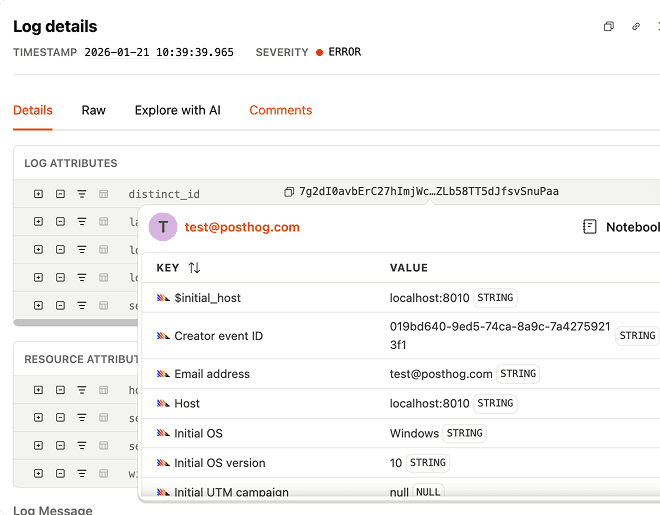
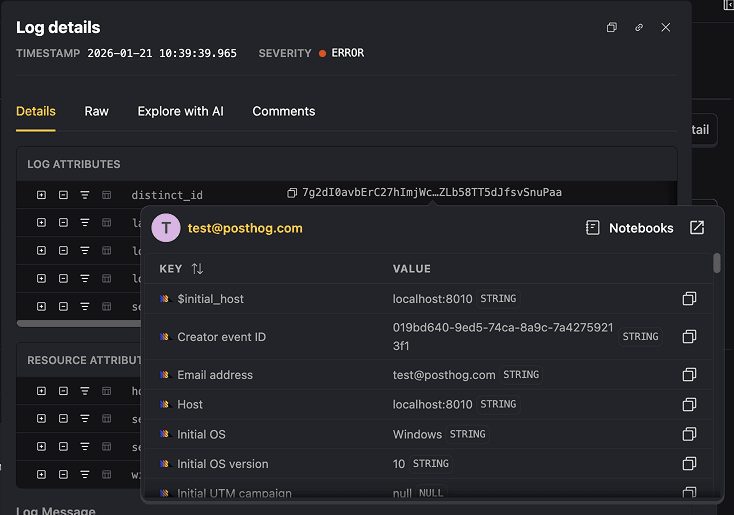
Once something stands out, he digs into the details. Because logs are ingested as structured data, whether they come from OpenTelemetry or PostHog’s own SDKs, the metadata isn’t just there for reference. A trace ID or request ID becomes the fastest way to reframe the investigation.
If he needs a quick reality check, Jon lets PostHog explain what the error is trying (and failing) to do, in human language. And when things are actively on fire, Live Tail is there to stream logs in real time. He says:
The real superpower is how this connects to the front end, because we capture browser logs via PostHog JS. They’re automatically linked to the session and the user IDs. I can search for a front-end exception and jump directly into the session replay to watch the exact moment the bug happened.
This means that logs are now part of the same space as replays, errors, and analytics, which removes a lot of back-and-forth and makes debugging feel noticeably quicker.
Why you should try PostHog Logs too
Across teams, Logs tends to show up at the same moment, when something feels off and you want to confirm or rule it out quickly.
We keep using Logs because it’s shaped by the same problems we run into while building PostHog. When it gets in the way, it gets changed. When it works, it becomes part of the routine.
Try it out and start debugging where your data already is.
PostHog is the leading platform for building self-driving products. With a full suite of developer tools – AI observability, product analytics, session replay, feature flags, experiments, error tracking, logs, and more – PostHog captures all the context agents need to diagnose problems, uncover opportunities, and ship fixes. A data warehouse and CDP tie it all together, unifying that context into one source agents can read across. You can steer it all from Slack, the web app, the desktop (PostHog Desktop), or your own editor via the MCP.