


How to set up Google Ads reports

Contents
Understanding your ad spend and return on that spend is core to creating successful marketing campaigns. Two important sources of data for this are Google Ads and PostHog. With our data warehouse, you can link and analyze them together.
In this tutorial, we get data from Google Ads, sync it into PostHog through S3, and use it to create insights like cost per click, cost per conversion, and more.
Exporting data from Google Ads
To get the data we want from Google Ads:
- Go to the Campaigns section in the Campaigns tab under Ad groups.
- Modify the columns and dates to get the data you want.
- When ready, click Download then More options and unselect Title and date range as well as Totals.
- Once done, choose Google Sheets and click Download.

Once downloaded, open your sheet and make the following edits:
- Replace
--values with empty. - Replace
,values with;or_(or another value that works for you). - Remove the spaces, periods, and slashes from the title columns. You can do this by creating a row with formula
=LOWER(SUBSTITUTE(SUBSTITUTE(SUBSTITUTE(A1, " ", "*"), "/", "*"), ".", "")), dragging across the row to create a new title row, and replacing the old one. - Remove duplicate columns like
currency_code.
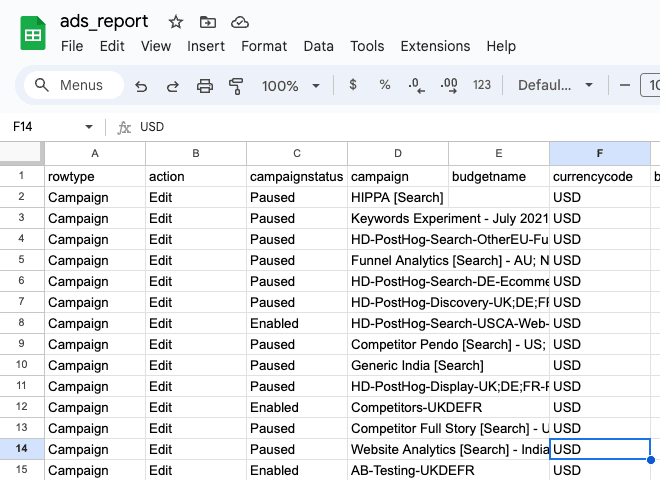
Once done, download it as a .csv file for upload to S3.
Uploading data to S3
We don't have Google Ads as a native source (yet). This means you must upload the Google Ads report to blob storage like GCS, R2, or the option we are using, S3, and then link that to PostHog.
To do this with S3, start by logging into the AWS Console and going to S3. Here, create a new bucket and save the name and region. We suggest us-east-1 if you're using US Cloud and eu-central-1 if you're using EU Cloud.
Next, go into your bucket and click Upload. Choose your Google Ad report and click Upload. Your data is now stored in S3.

Creating a user to access S3 data
After creating the bucket and uploading data, we must set up access. To do this:
- Open IAM and create a new policy to enable access to this bucket.
- On the left under Access management, select Policies, and click Create policy.
- Under the service, choose S3.
- Under Actions, select:
- Under List, select ListBucket and ListBucketMultipartUploads
- Under Read, select GetBucketLocation and GetObject
- Under Write, select AbortMultipartUpload and PutObject
- Under Permission Management, select PutObjectAcl
- Under Resources, select Specific, and click object → Add ARN.
- Specify your bucket name and toggle Any object name. In the example below, replace
ian-google-ads-reportswith the bucket name you chose in the previous section.

- Click Next, give your policy a name, and click Create policy.
With your new policy, you can create a user and give them access to the bucket by attaching the policy.
- Open IAM and navigate to Users on the left.
- Click Create user, specify a user name, and click Next.
- Select Attach policies.
- Search and select the policy you created then click Next and then Create user.
- Click the newly created user and click Create access key.
- Choose third-party service and give your key a name.
- Copy your access key and secret access key (they won't be shown again).
Linking S3 to PostHog
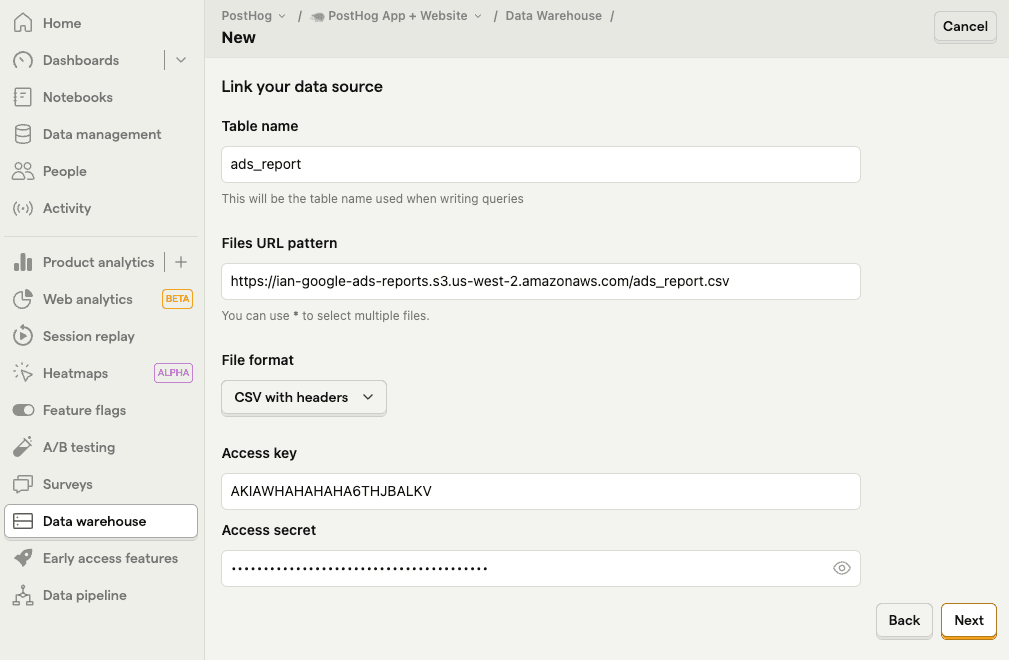
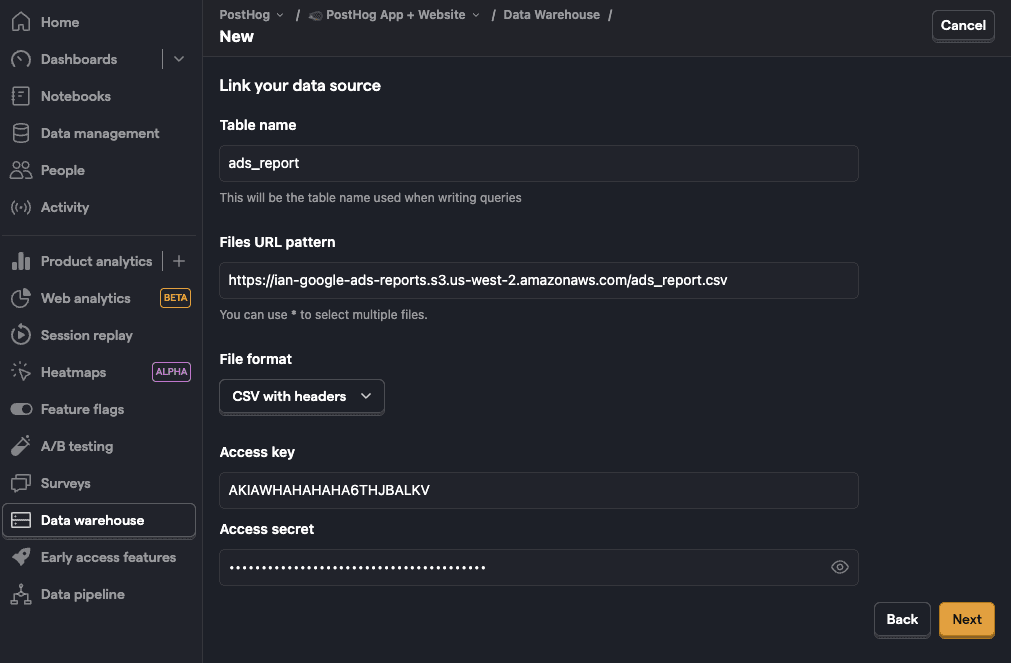
With your access keys, you can go to the data warehouse tab in PostHog and click Link source. Under self managed, click Link next to S3. Add a table name, your S3 URL (like https://ian-google-ads-reports.s3.us-west-2.amazonaws.com/ads_report.csv), CSV with headers for file format, your access key and secret, and click Next.
Once the sync is complete, you can query your data in PostHog.
Creating insights for your Google Ads report
Now that your Google Ads data is synced into PostHog, you can use it to create insights for your report. Each of these requires you to create a new insight in the product analytics tab.
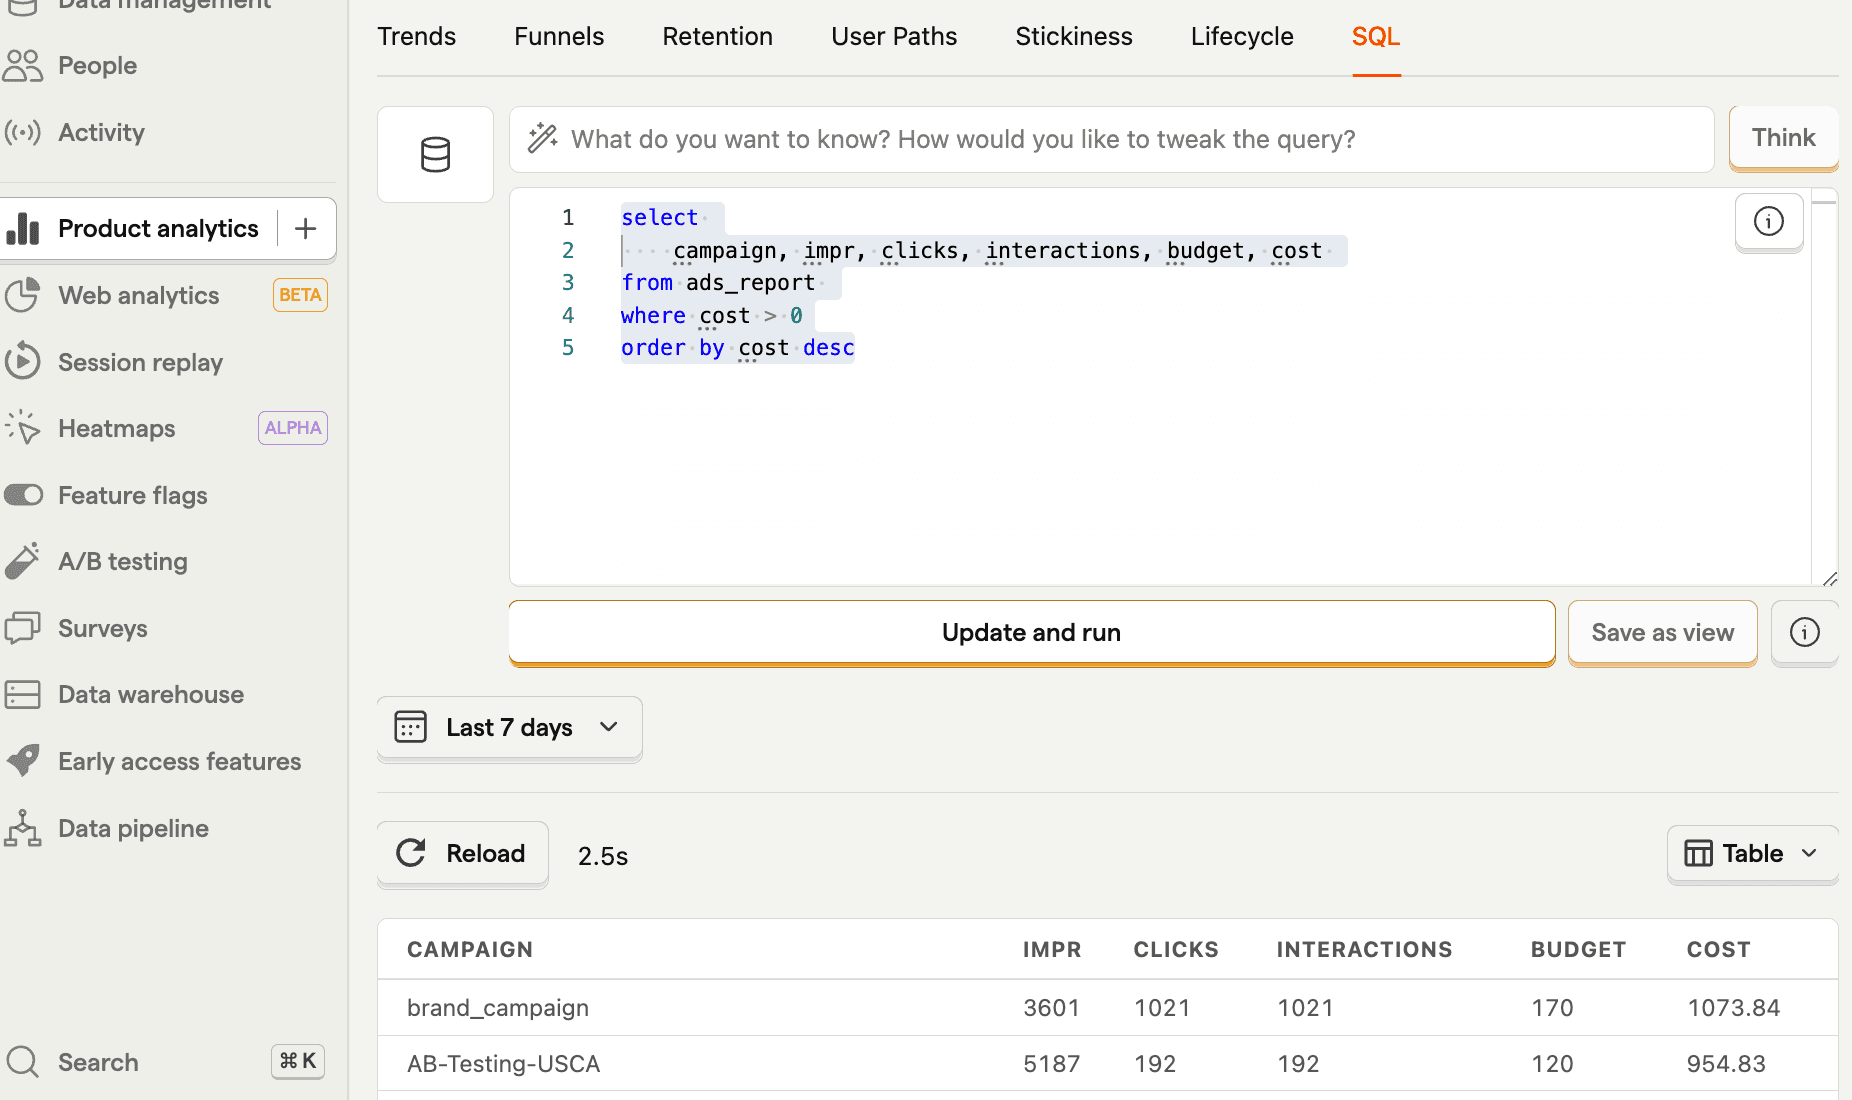
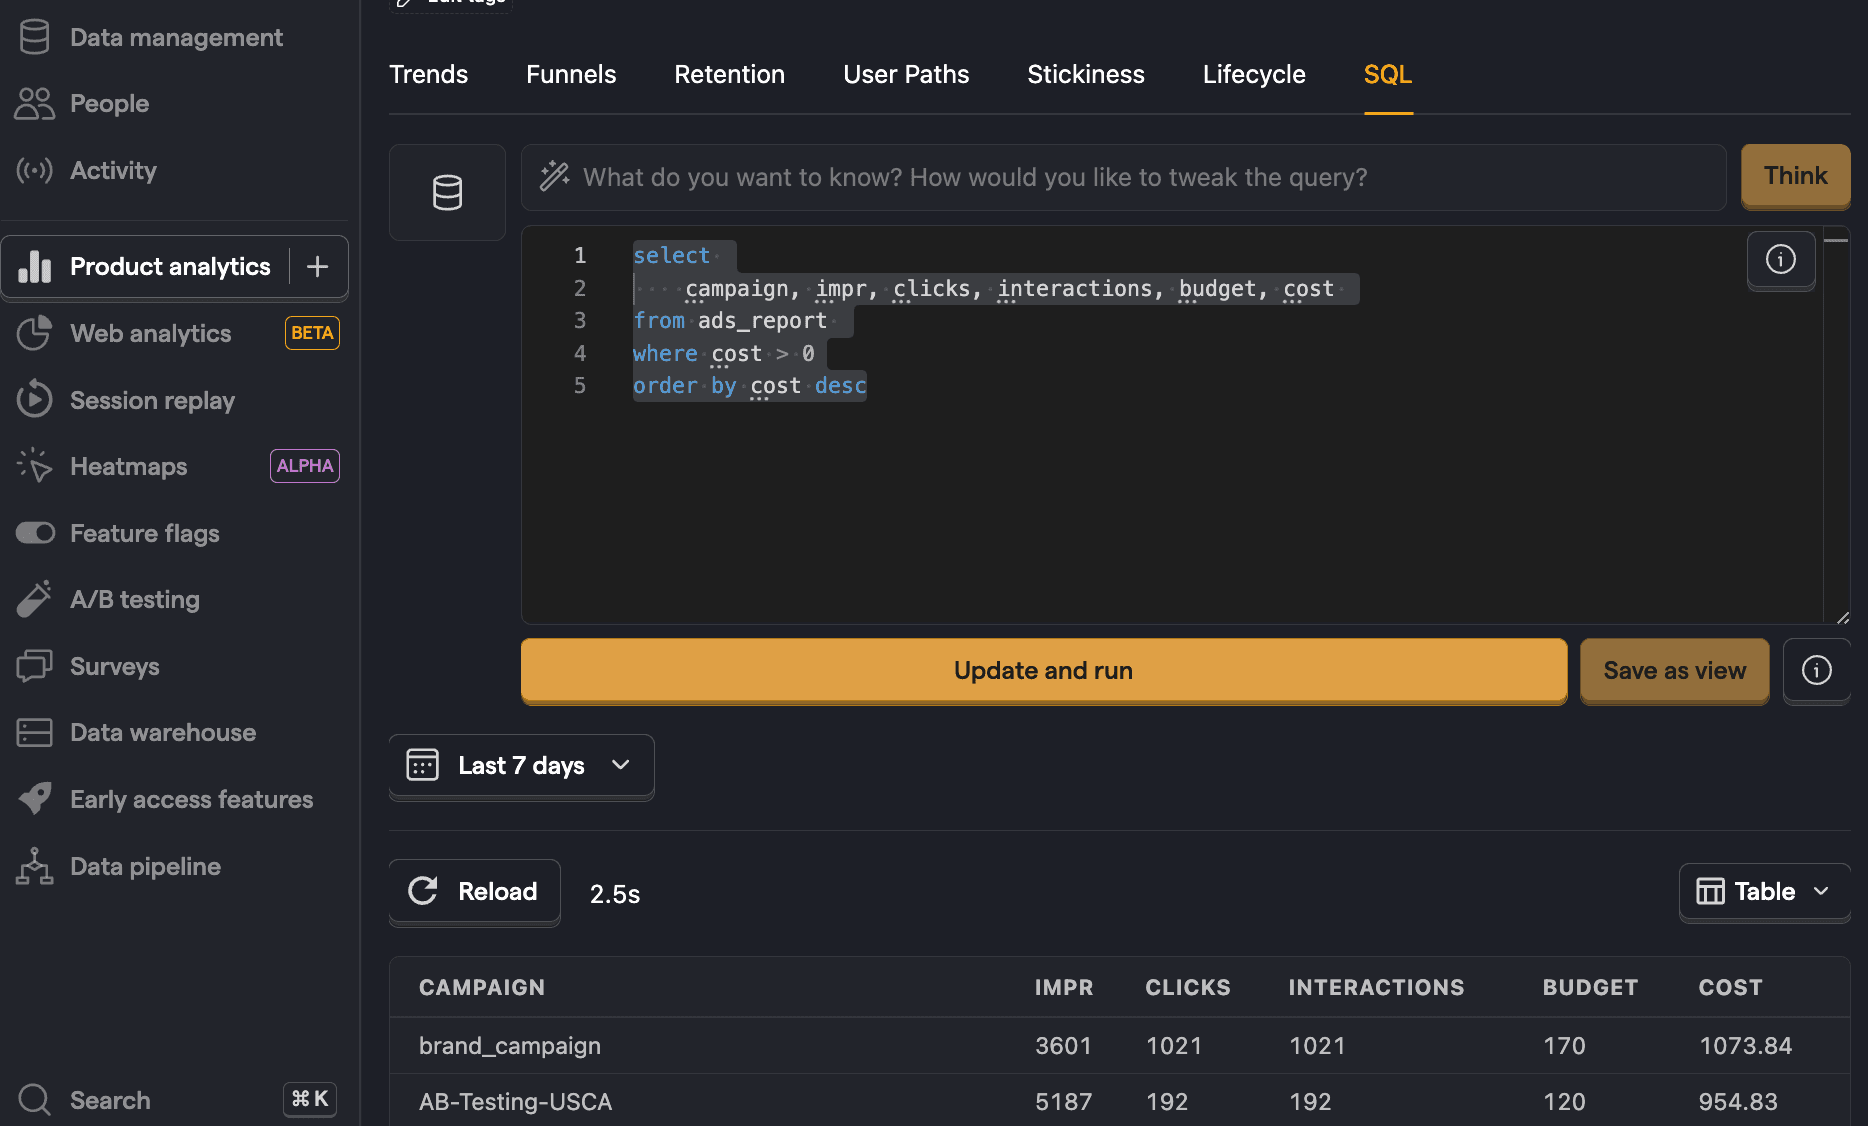
Campaign overview
The Google Ads data contains a bunch of columns that might not be relevant. To get an overview of the data, we can filter for campaigns where we spent money and get the columns that say something.
To do this, create a new SQL insight with the following query:
Cost per session
Note: The next insights all rely on being able to tie the
utm_campaignvalue to the campaign name in Google Ads. To make sure this works, we recommend changing the name of the campaign to match theutm_campaign.
The power of connecting your Google Ads data comes from combining it with your PostHog data. We can join PostHog's $entry_utm_campaign value from the sessions table with our Google Ads table campaign value to get a cost per session like this:
You might need to modify the INTERVAL depending on the date range of your Google Ads data.
Cost per signup
We can go further by looking at the cost per conversion. In our case, the conversion we care about is a signup.
To get this value in PostHog, we can look for newly created people with an email (representing that they have signed up). We then join the persons table to the Google Ads report using the $initial_utm_campaign person property.
Another way to do this is to join PostHog's sessions and events table using session_id and then filter for the events you want. This also enables more flexibility on what events you can count as a conversion.
Cost per click
Google Ads provides a click value, but what we care about more is clicks on our site. To compare this to cost, we can:
- Create an action representing the clicks we care about. In our case, this is clicking Get started - free on our home or product pages.
- Join the
ads_reportto thesessionstable using thecampaign. - Join the
sessionstable to theeventstable using thesession_id. - Querying for the
campaign,total_cost,click_count, andcost_per_click.
Altogether, this looks like this:
Click conversion rate
Something we can use the Google Ads click value for is calculating conversion. This is similar to the last query, but replacing cost with click and then making the percentage a nice number
Further reading
- How to track performance marketing in PostHog
- How (and why) our marketing team uses PostHog
- An intro to PostHog for Google Analytics users
Subscribe to our newsletter
build mode
Read by 75,000+ founders and builders
We'll share your email with Substack
PostHog is the leading platform for building self-driving products. With a full suite of developer tools – AI observability, product analytics, session replay, feature flags, experiments, error tracking, logs, and more – PostHog captures all the context agents need to diagnose problems, uncover opportunities, and ship fixes. A data warehouse and CDP tie it all together, unifying that context into one source agents can read across. You can steer it all from Slack, the web app, the desktop (PostHog Desktop), or your own editor via the MCP.