


Getting started with AI Observability
Capture LLM conversations
AI Observability gives you x-ray vision into your LLM applications. You can track:
- 🗣️ Every conversation (inputs, outputs, and tokens)
- 🤖 Model performance (cost, latency and error rates)
- 🔍 Full traces and sessions for when you need to go detective mode
- 💰 How much each chat/user/organization is costing you
- 🔗 Multi-conversation sessions across user visits
New to LLM observability? See core concepts for a primer on events, tokens, and traces.
The first step is to install a PostHog SDK to capture conversations, requests, and responses from an LLM provider.
Platforms


Track AI generations
Once you've installed the SDK, every LLM call automatically becomes a generation – a detailed record of what went in and what came out. Each generation captures:
- Complete conversation context (inputs and outputs)
- Token counts and usage metrics
- Response latency and performance data
- Automatic cost calculation based on model pricing
- Trace IDs to group related LLM calls together
PostHog's SDK wrappers handle all the heavy lifting. Use your LLM provider as normal and we'll capture everything automatically.
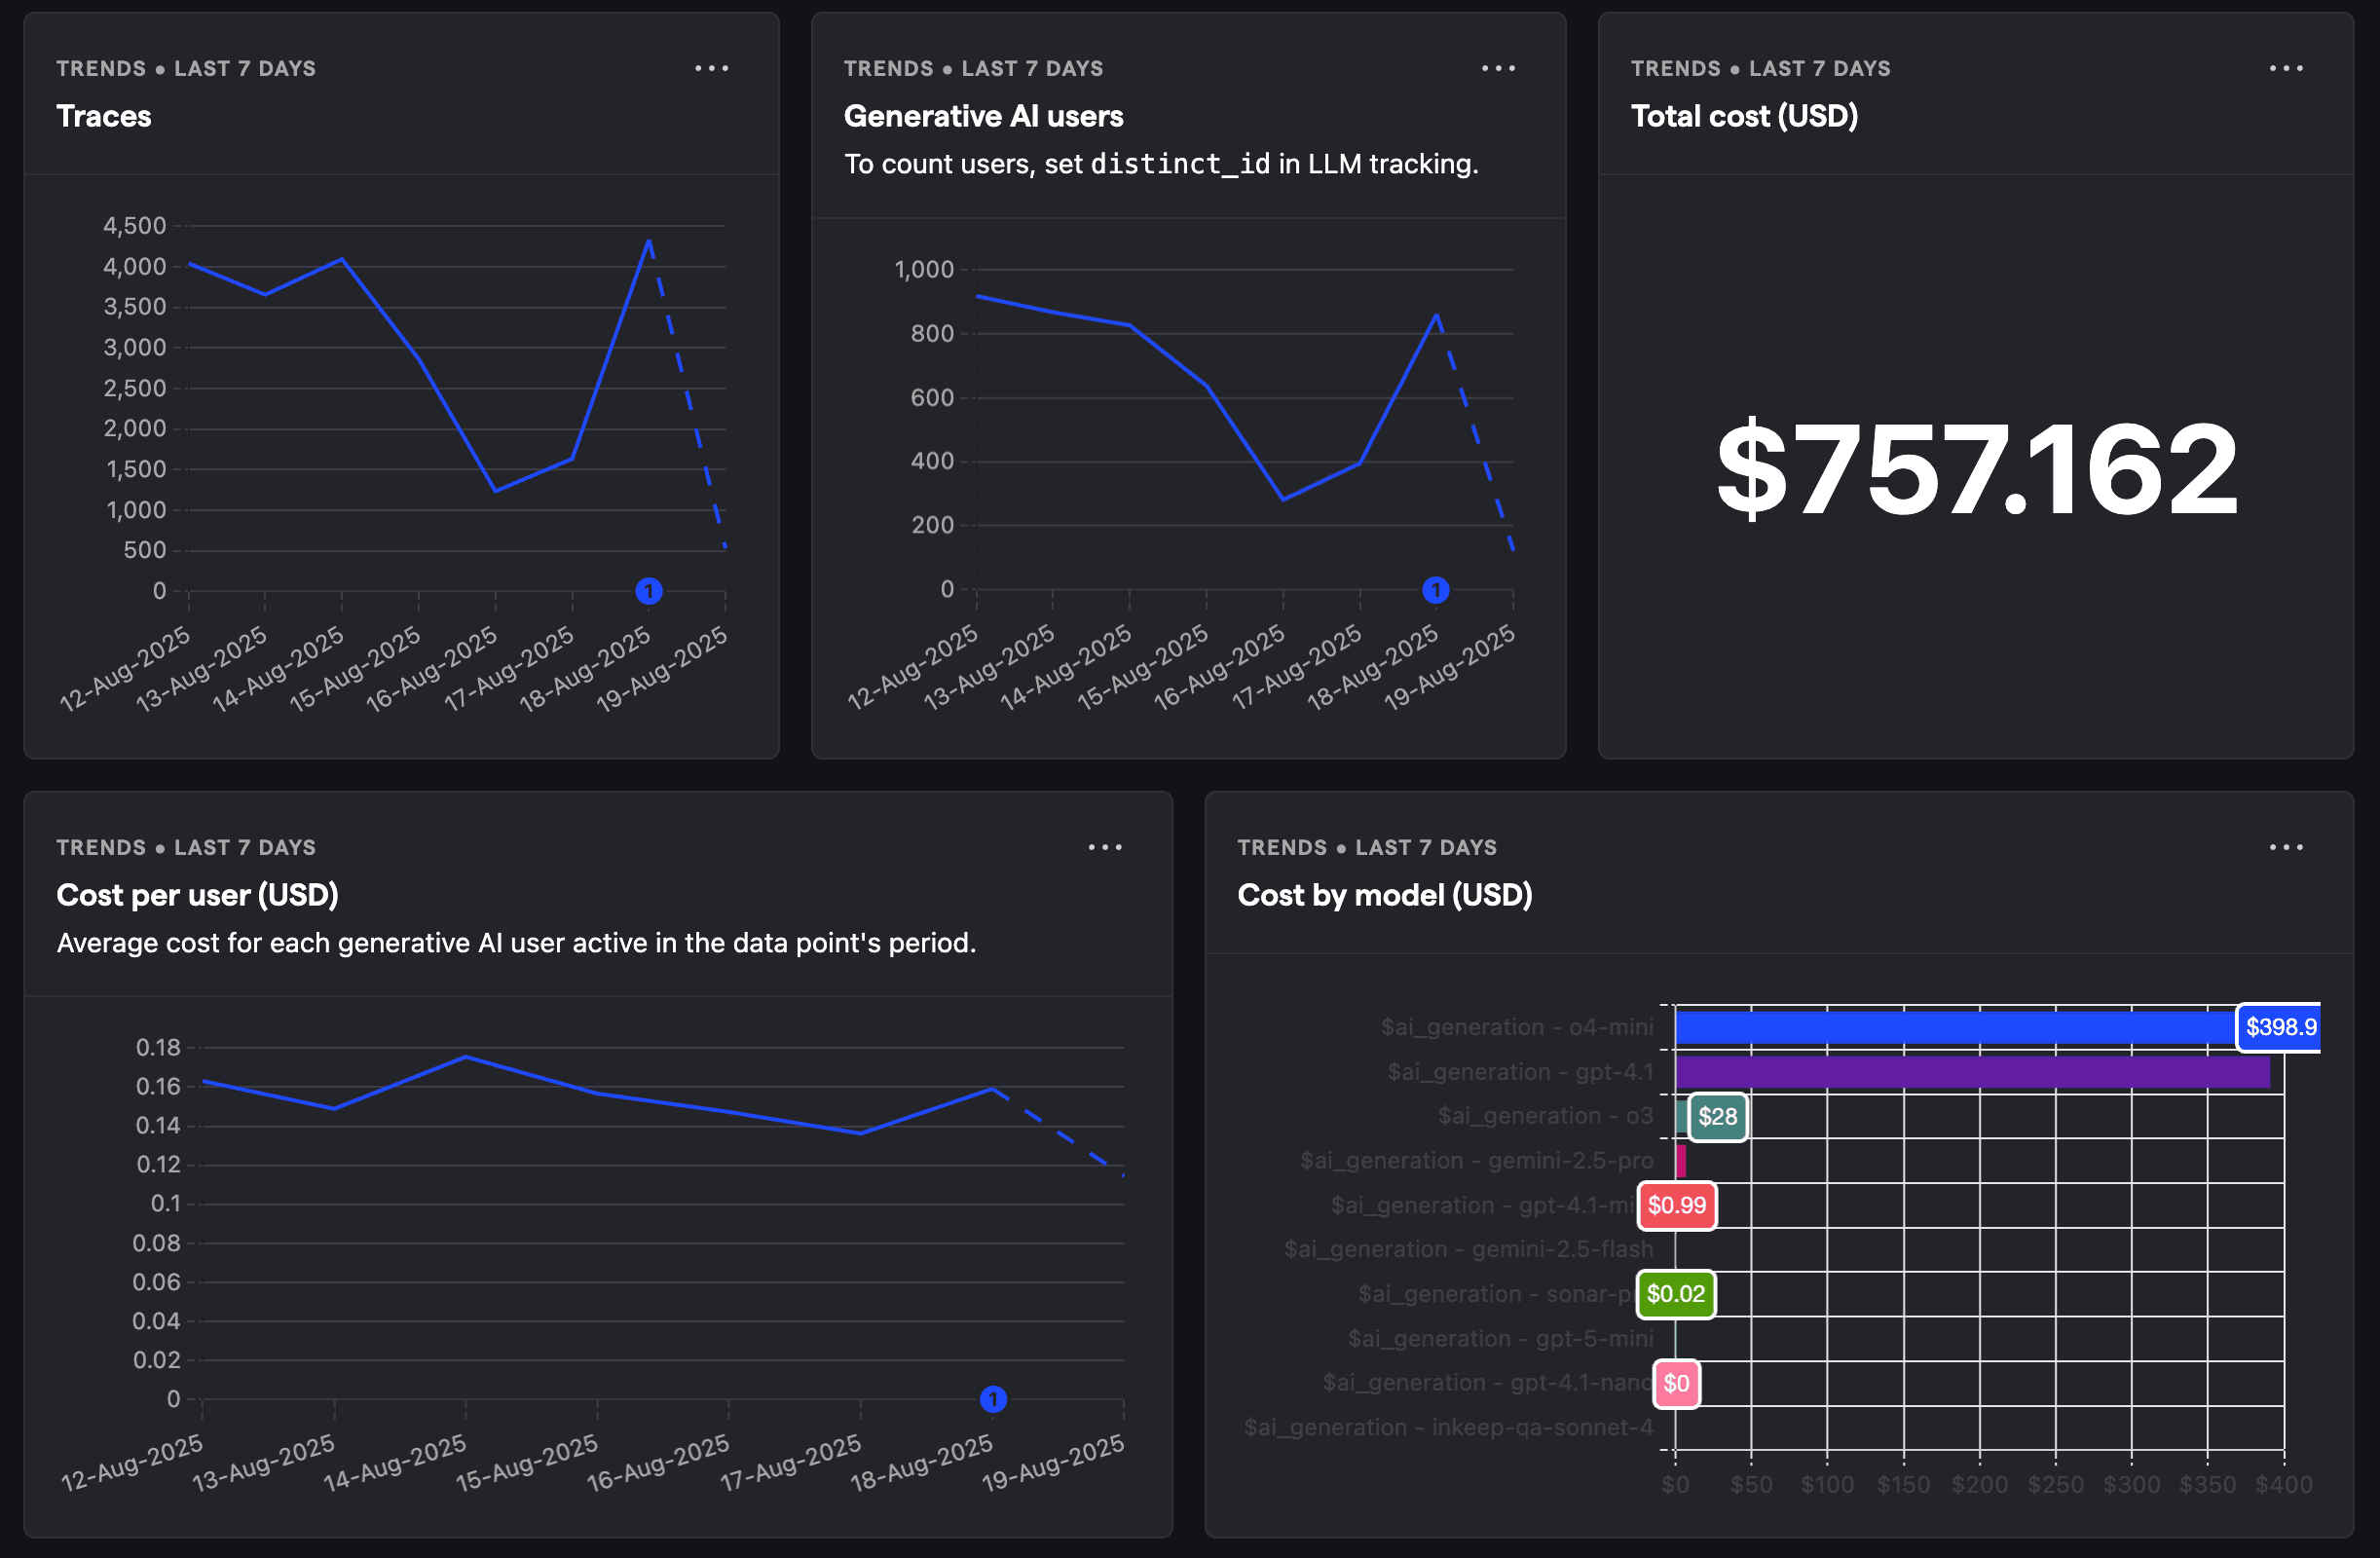
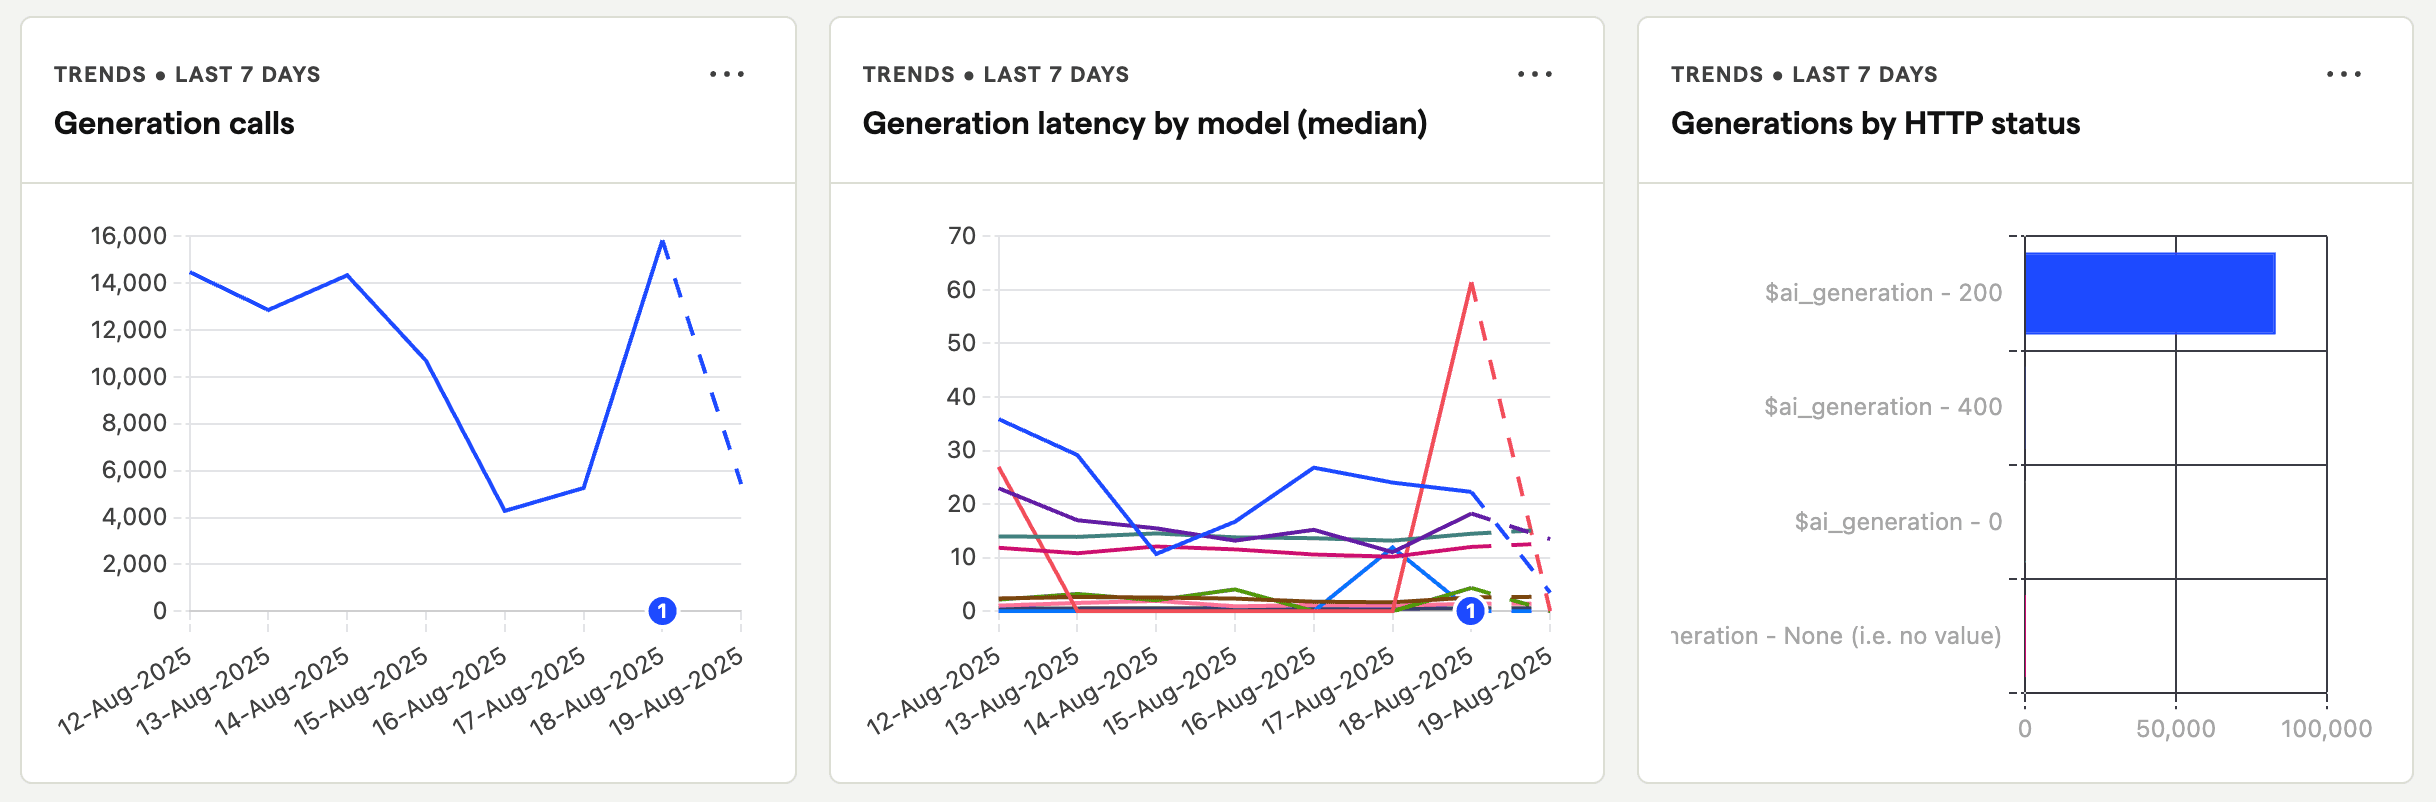
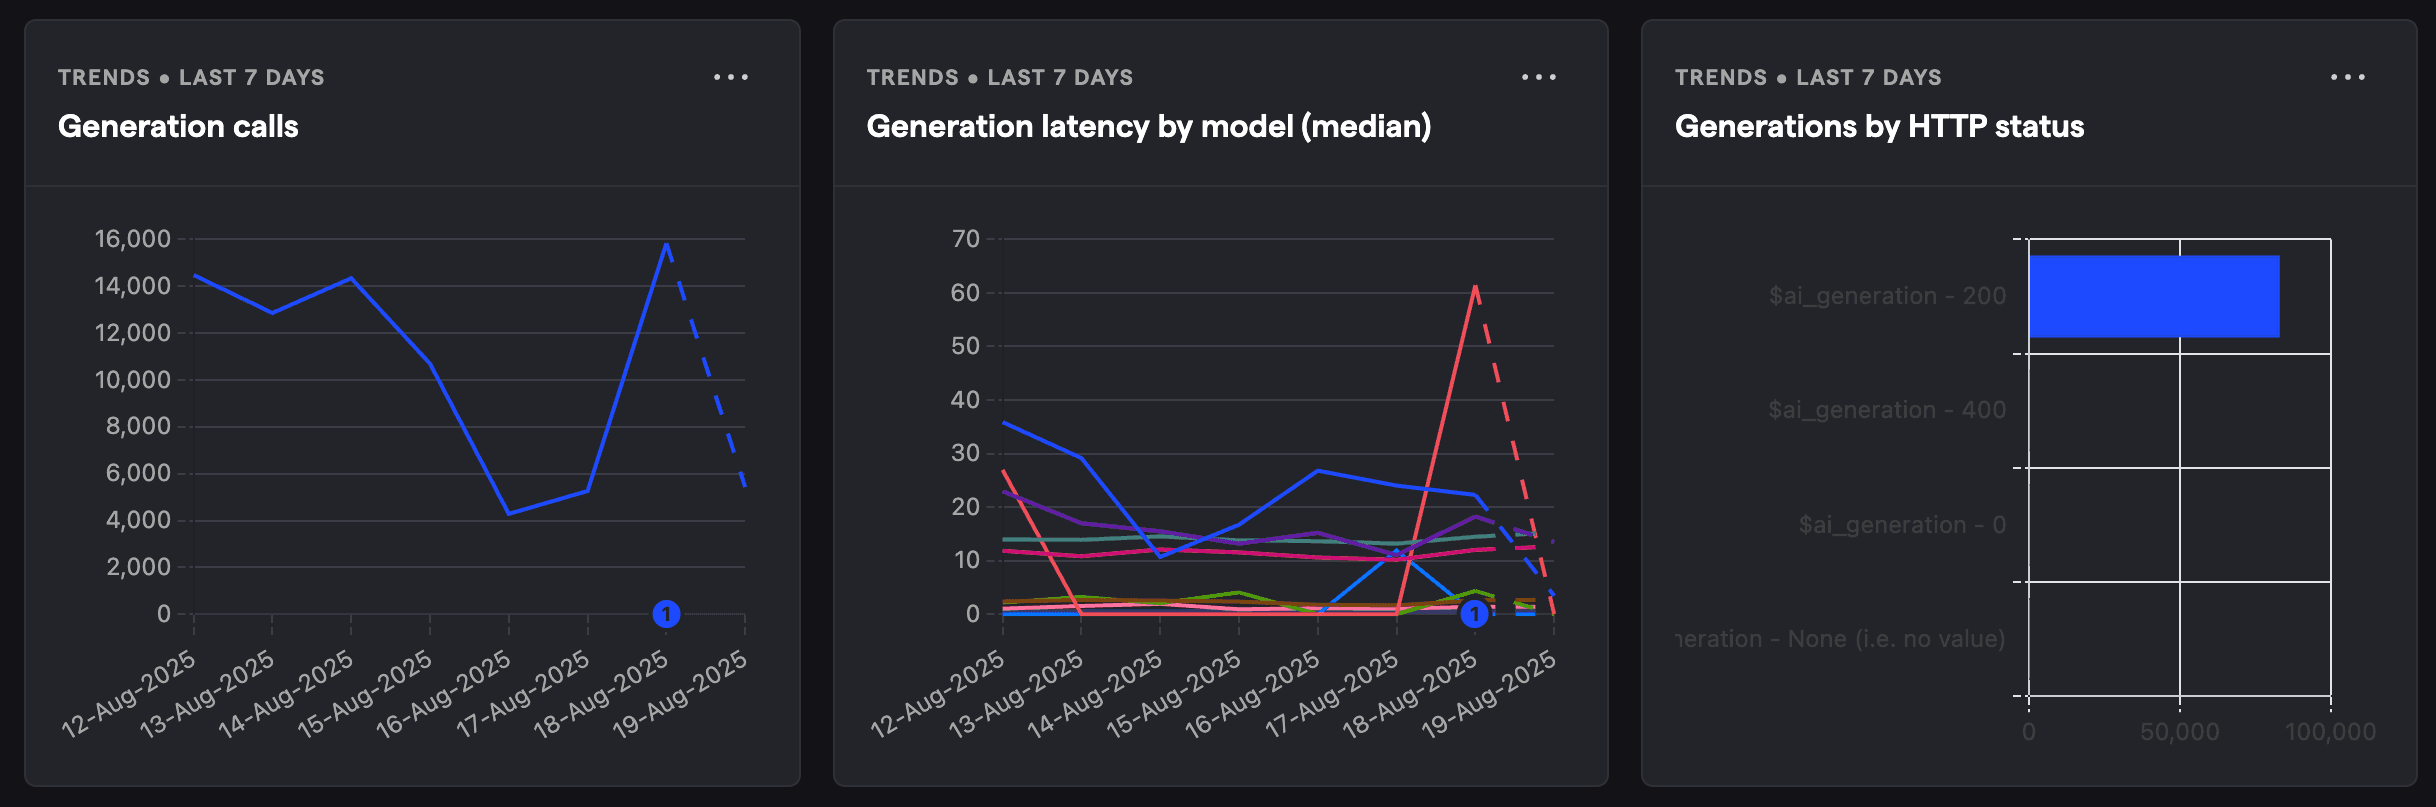
Evaluate model usage
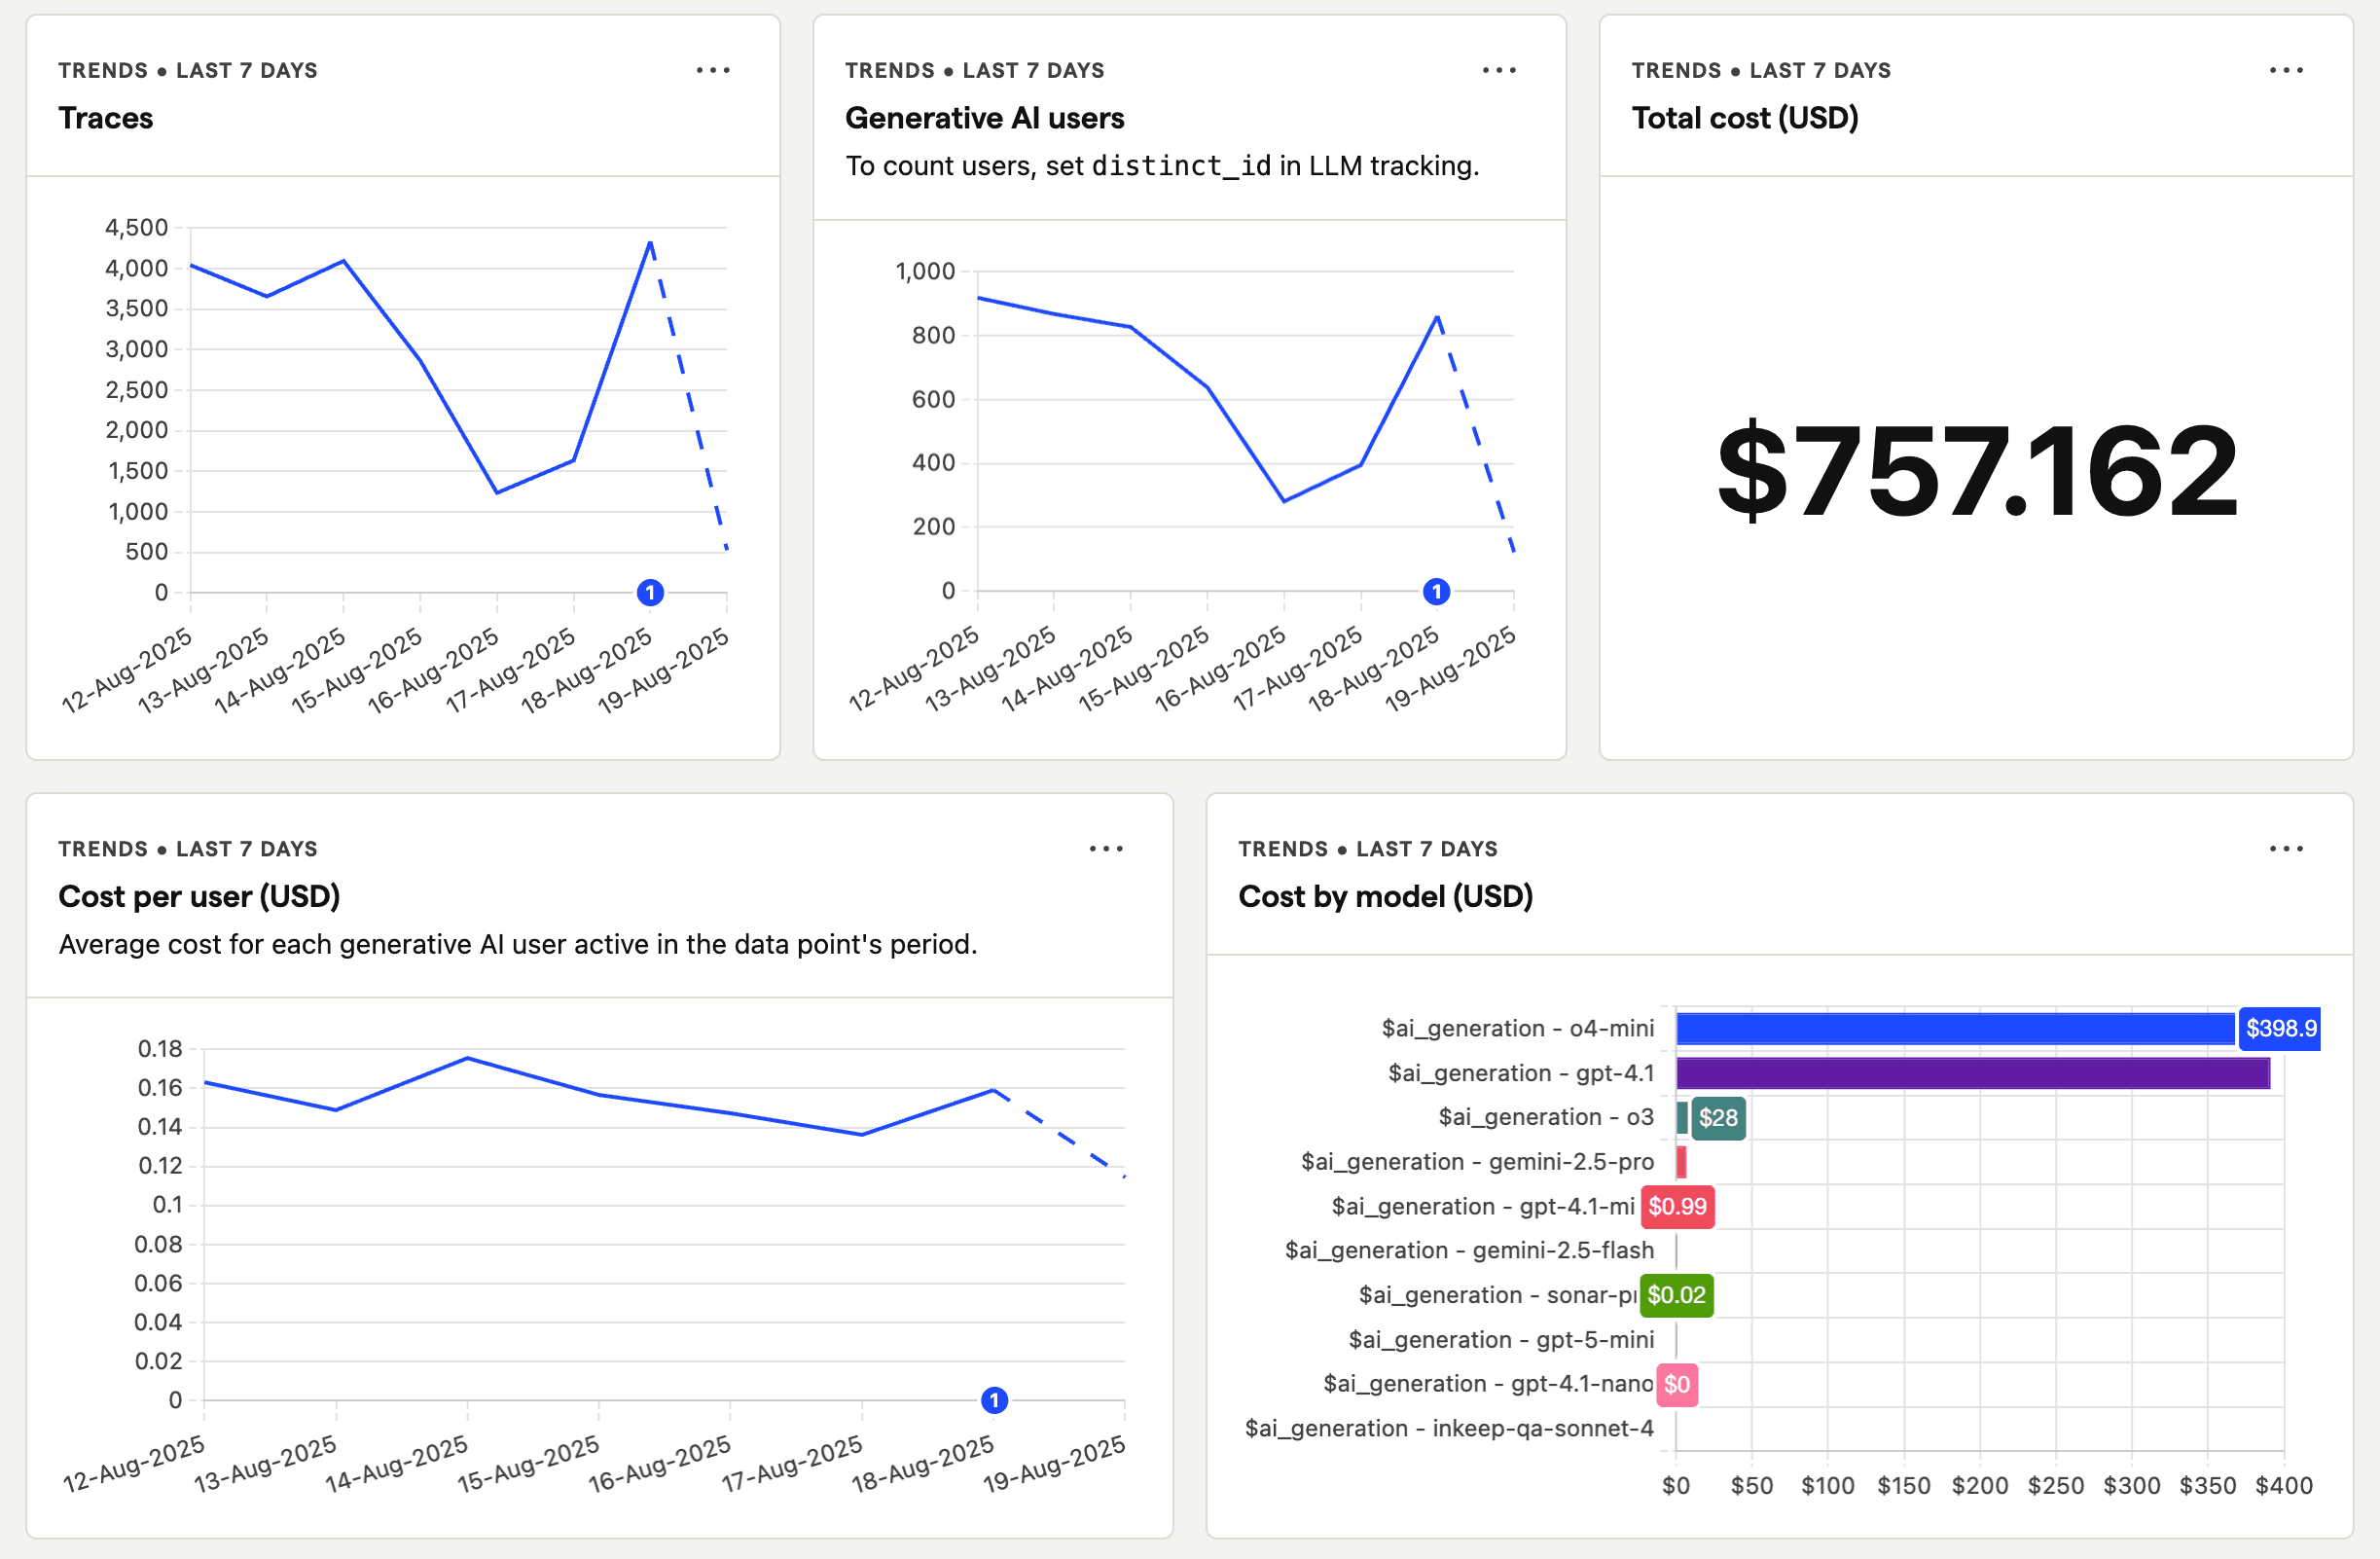
PostHog's AI Observability dashboard provides a comprehensive overview of your LLM performance. Break usage metrics down by model, latency, cost, and more.
Integrate customer data
Take advantage of PostHog's platform to integrate your customer data with AI Observability.
Product analytics
All AI Observability events are captured as standard PostHog events, which means you can create dashboards, trends, funnels, custom SQL queries, alerts, and more.
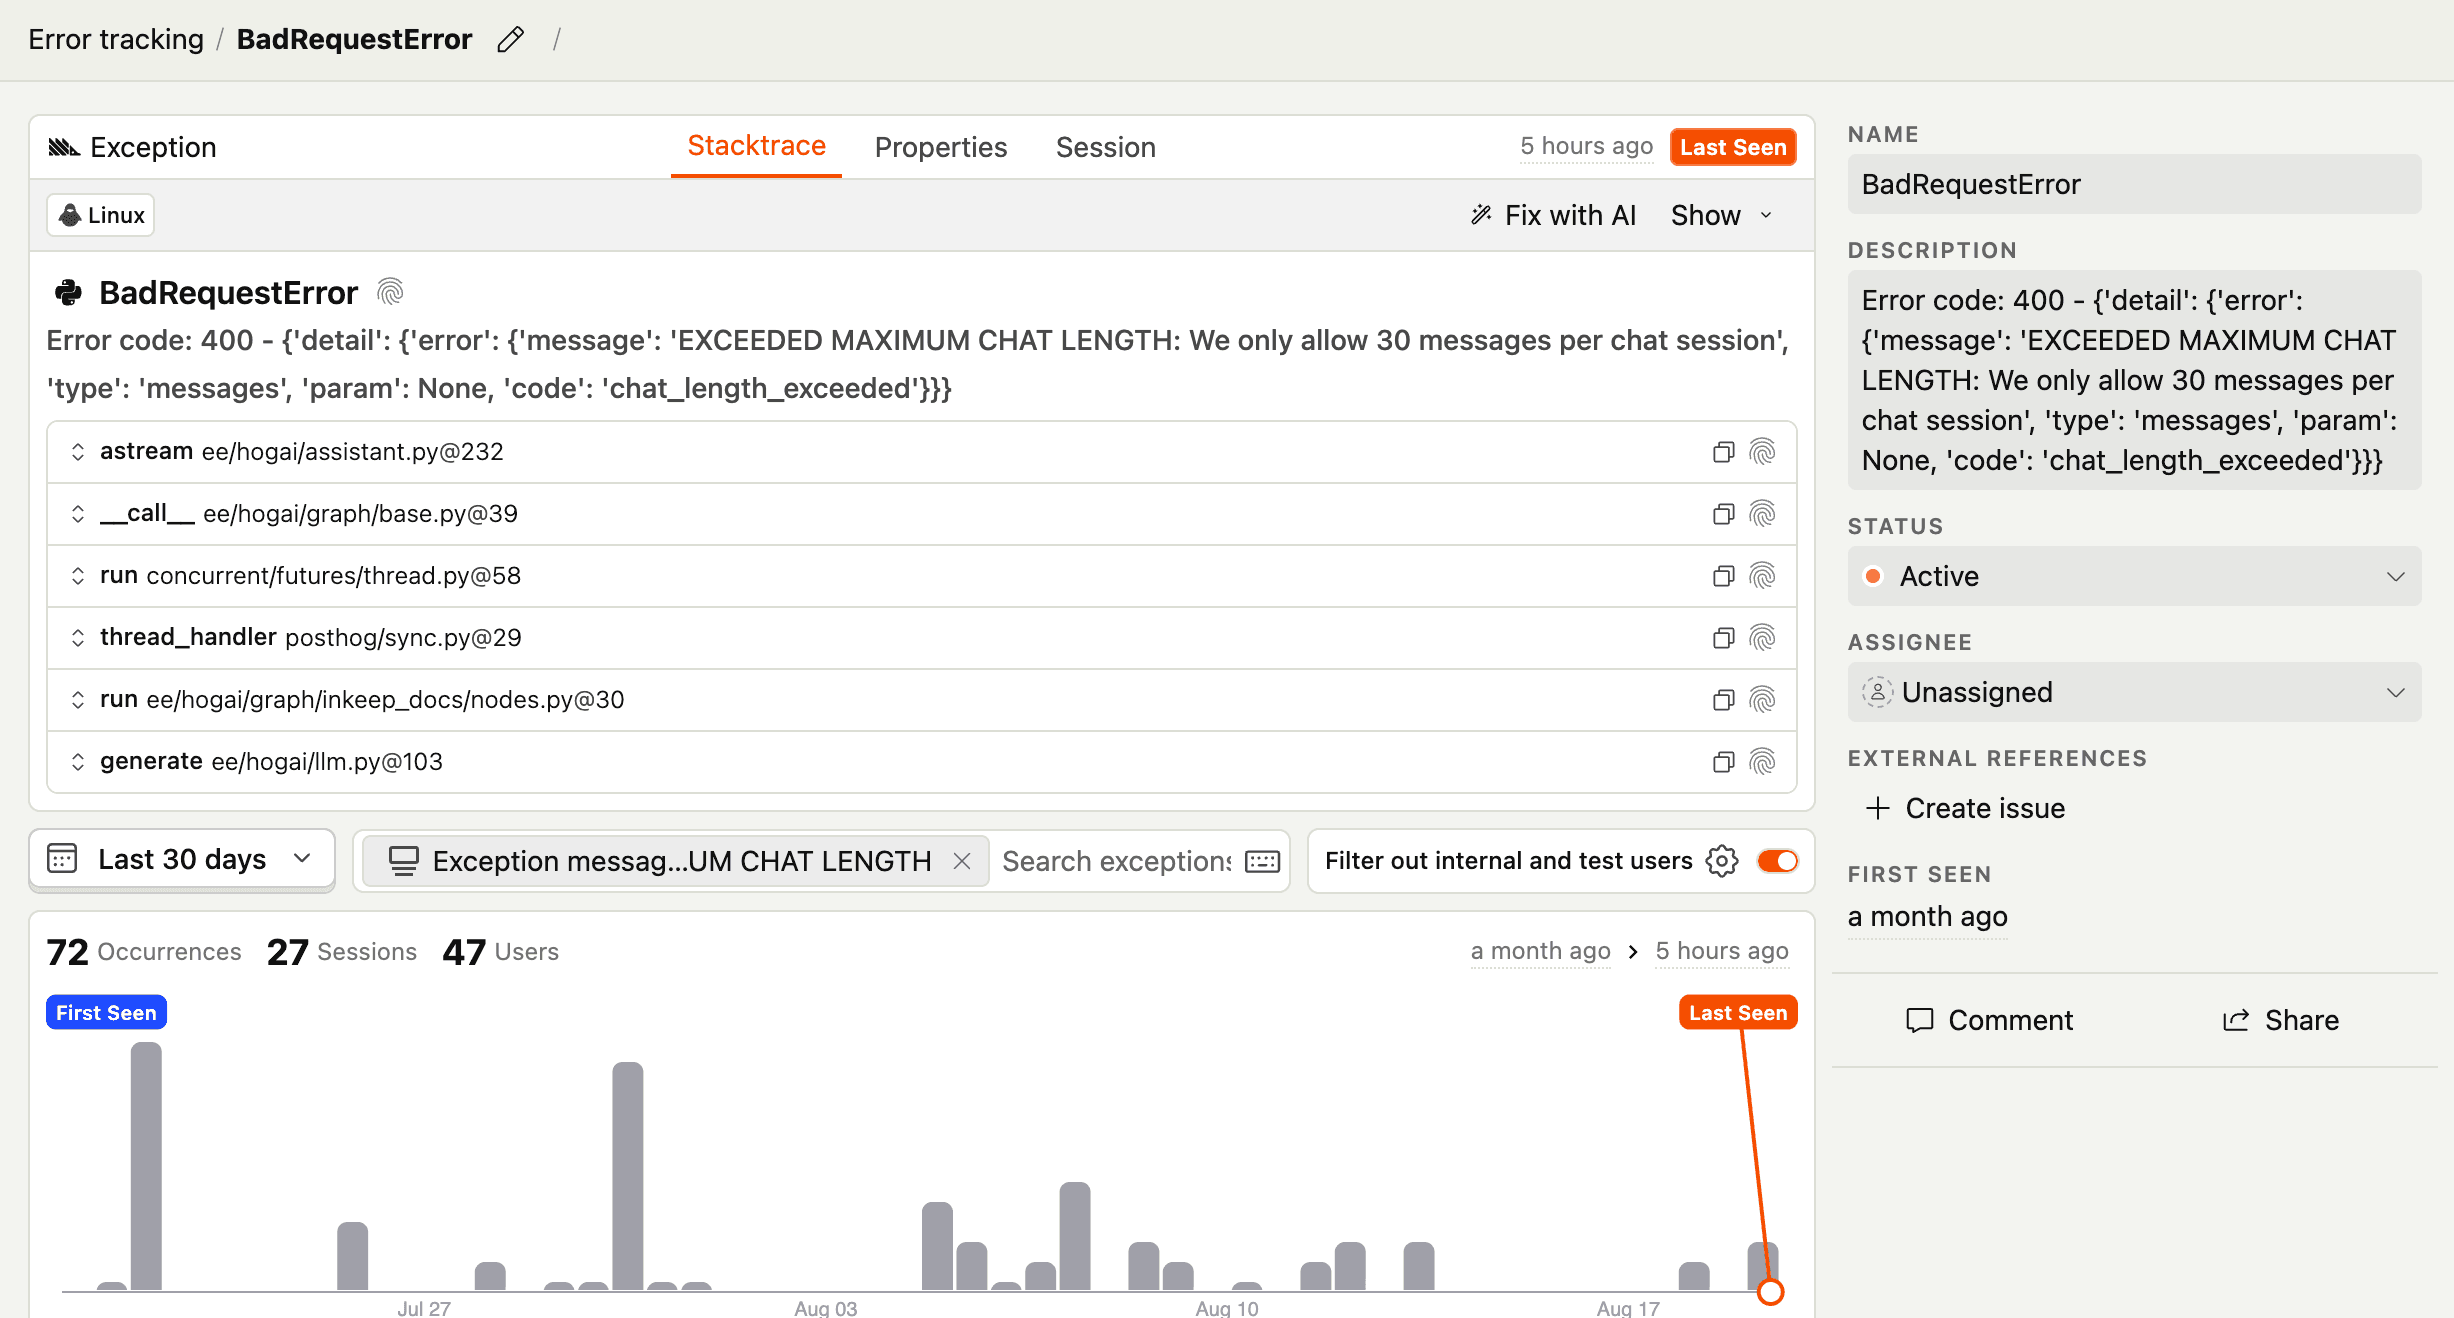
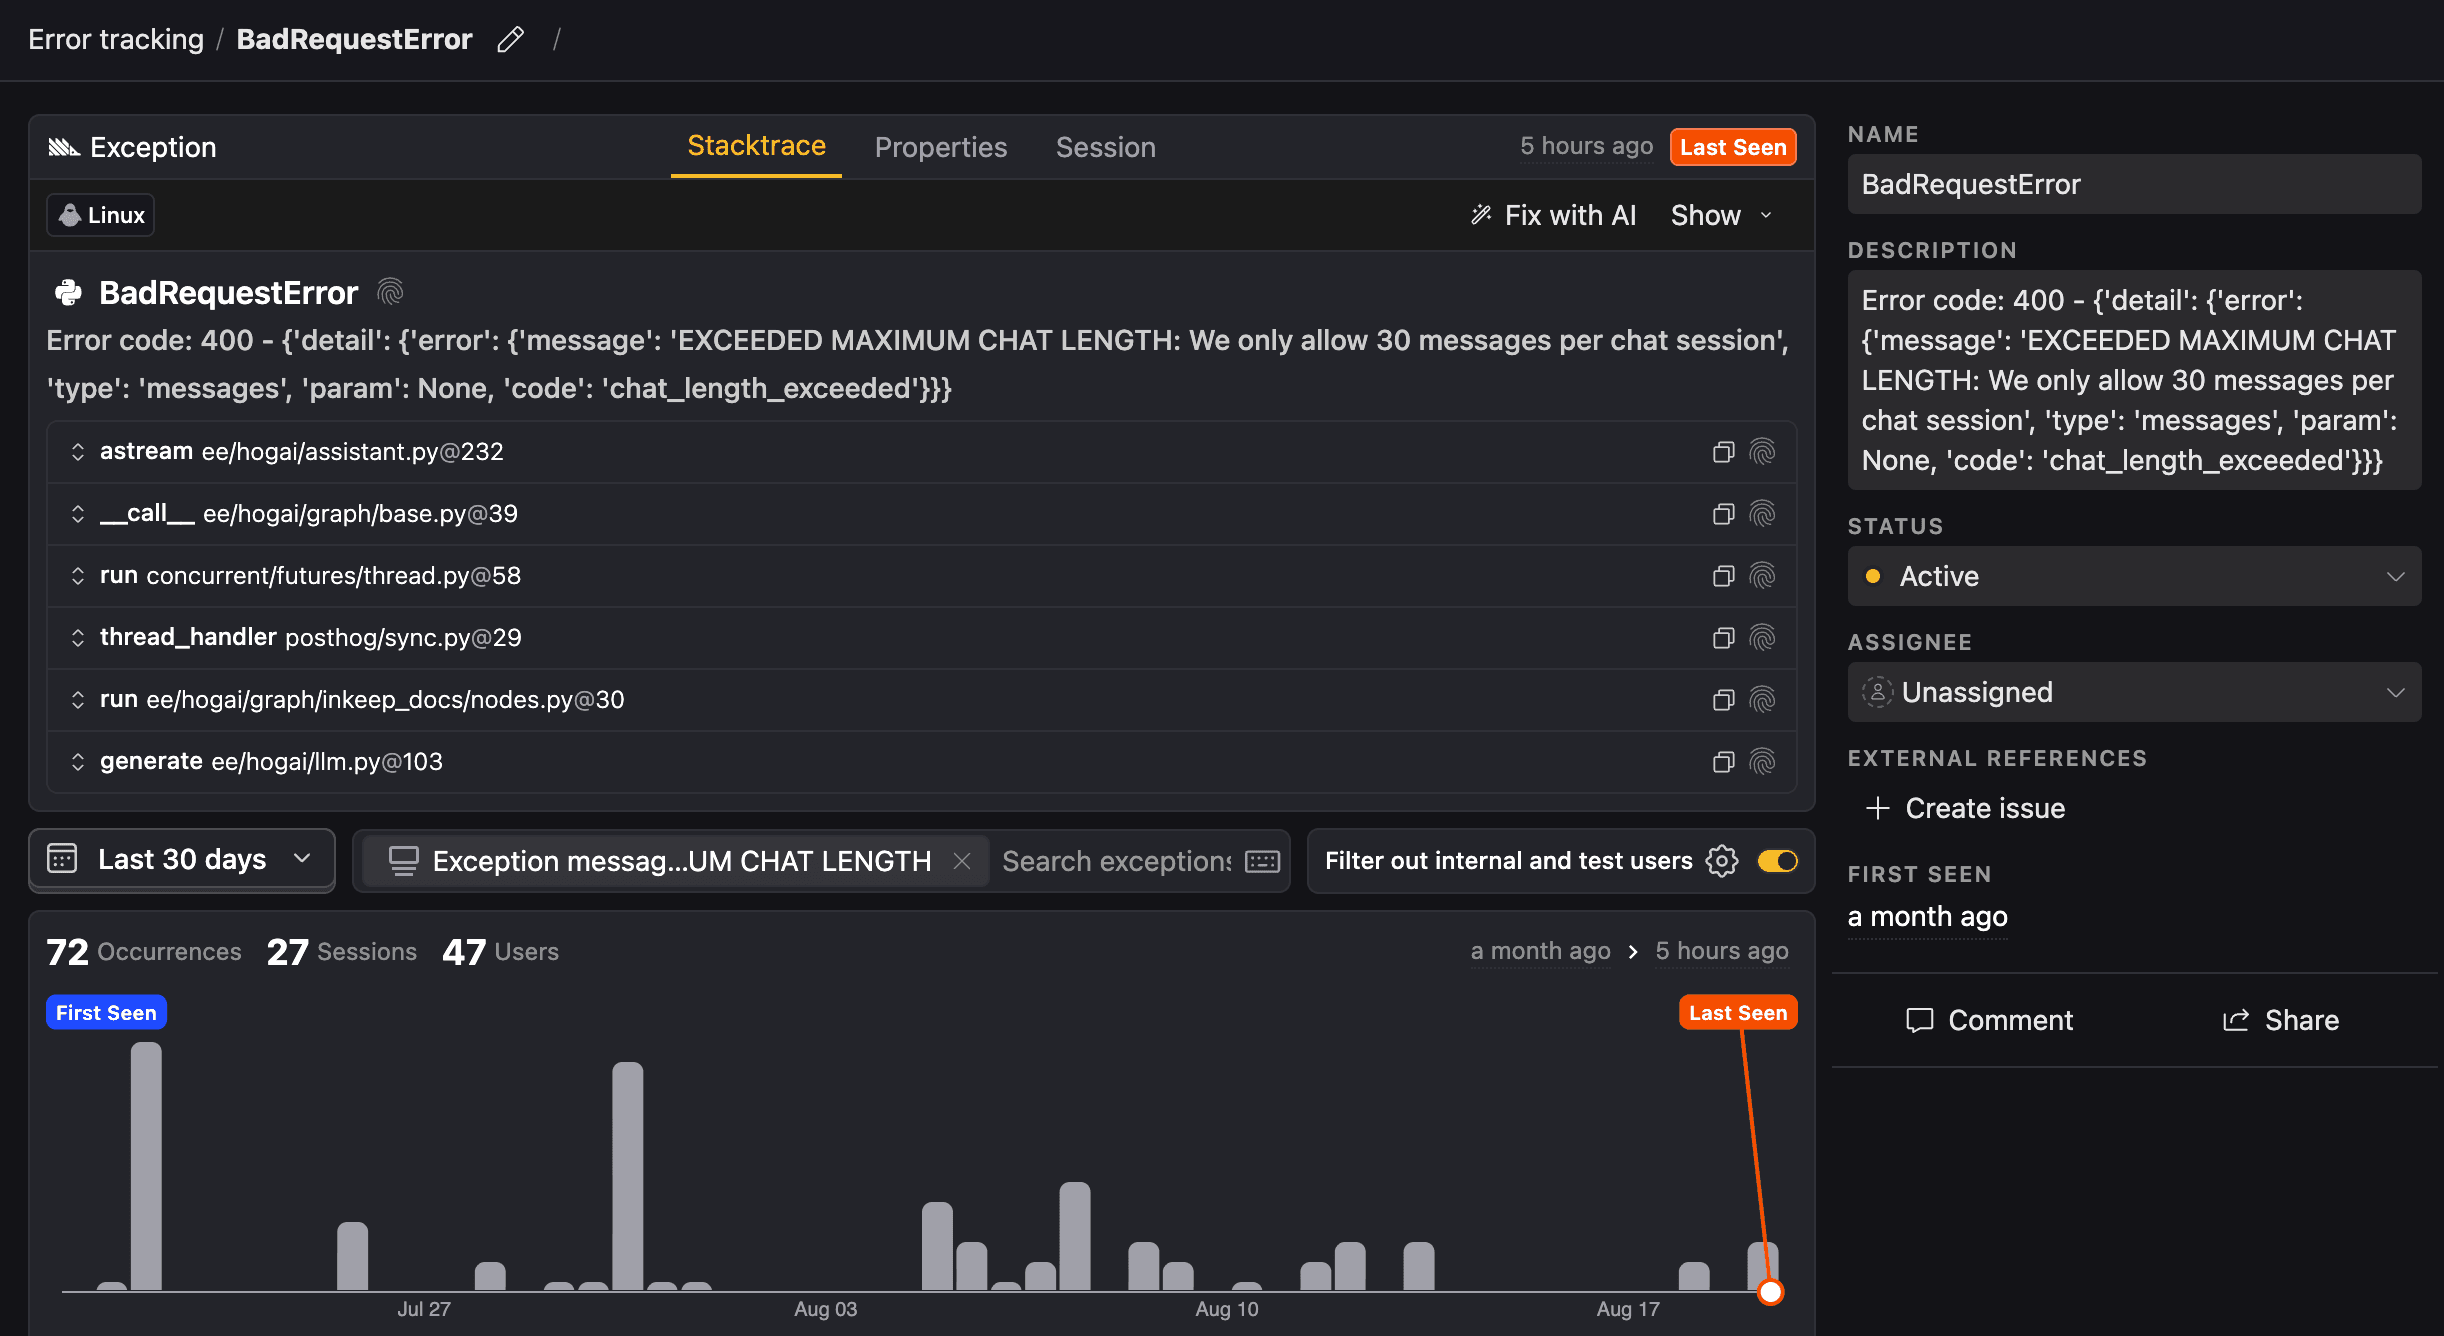
Error tracking
LLM generated errors are automatically captured in PostHog's error tracking for you to monitor, debug, and resolve.
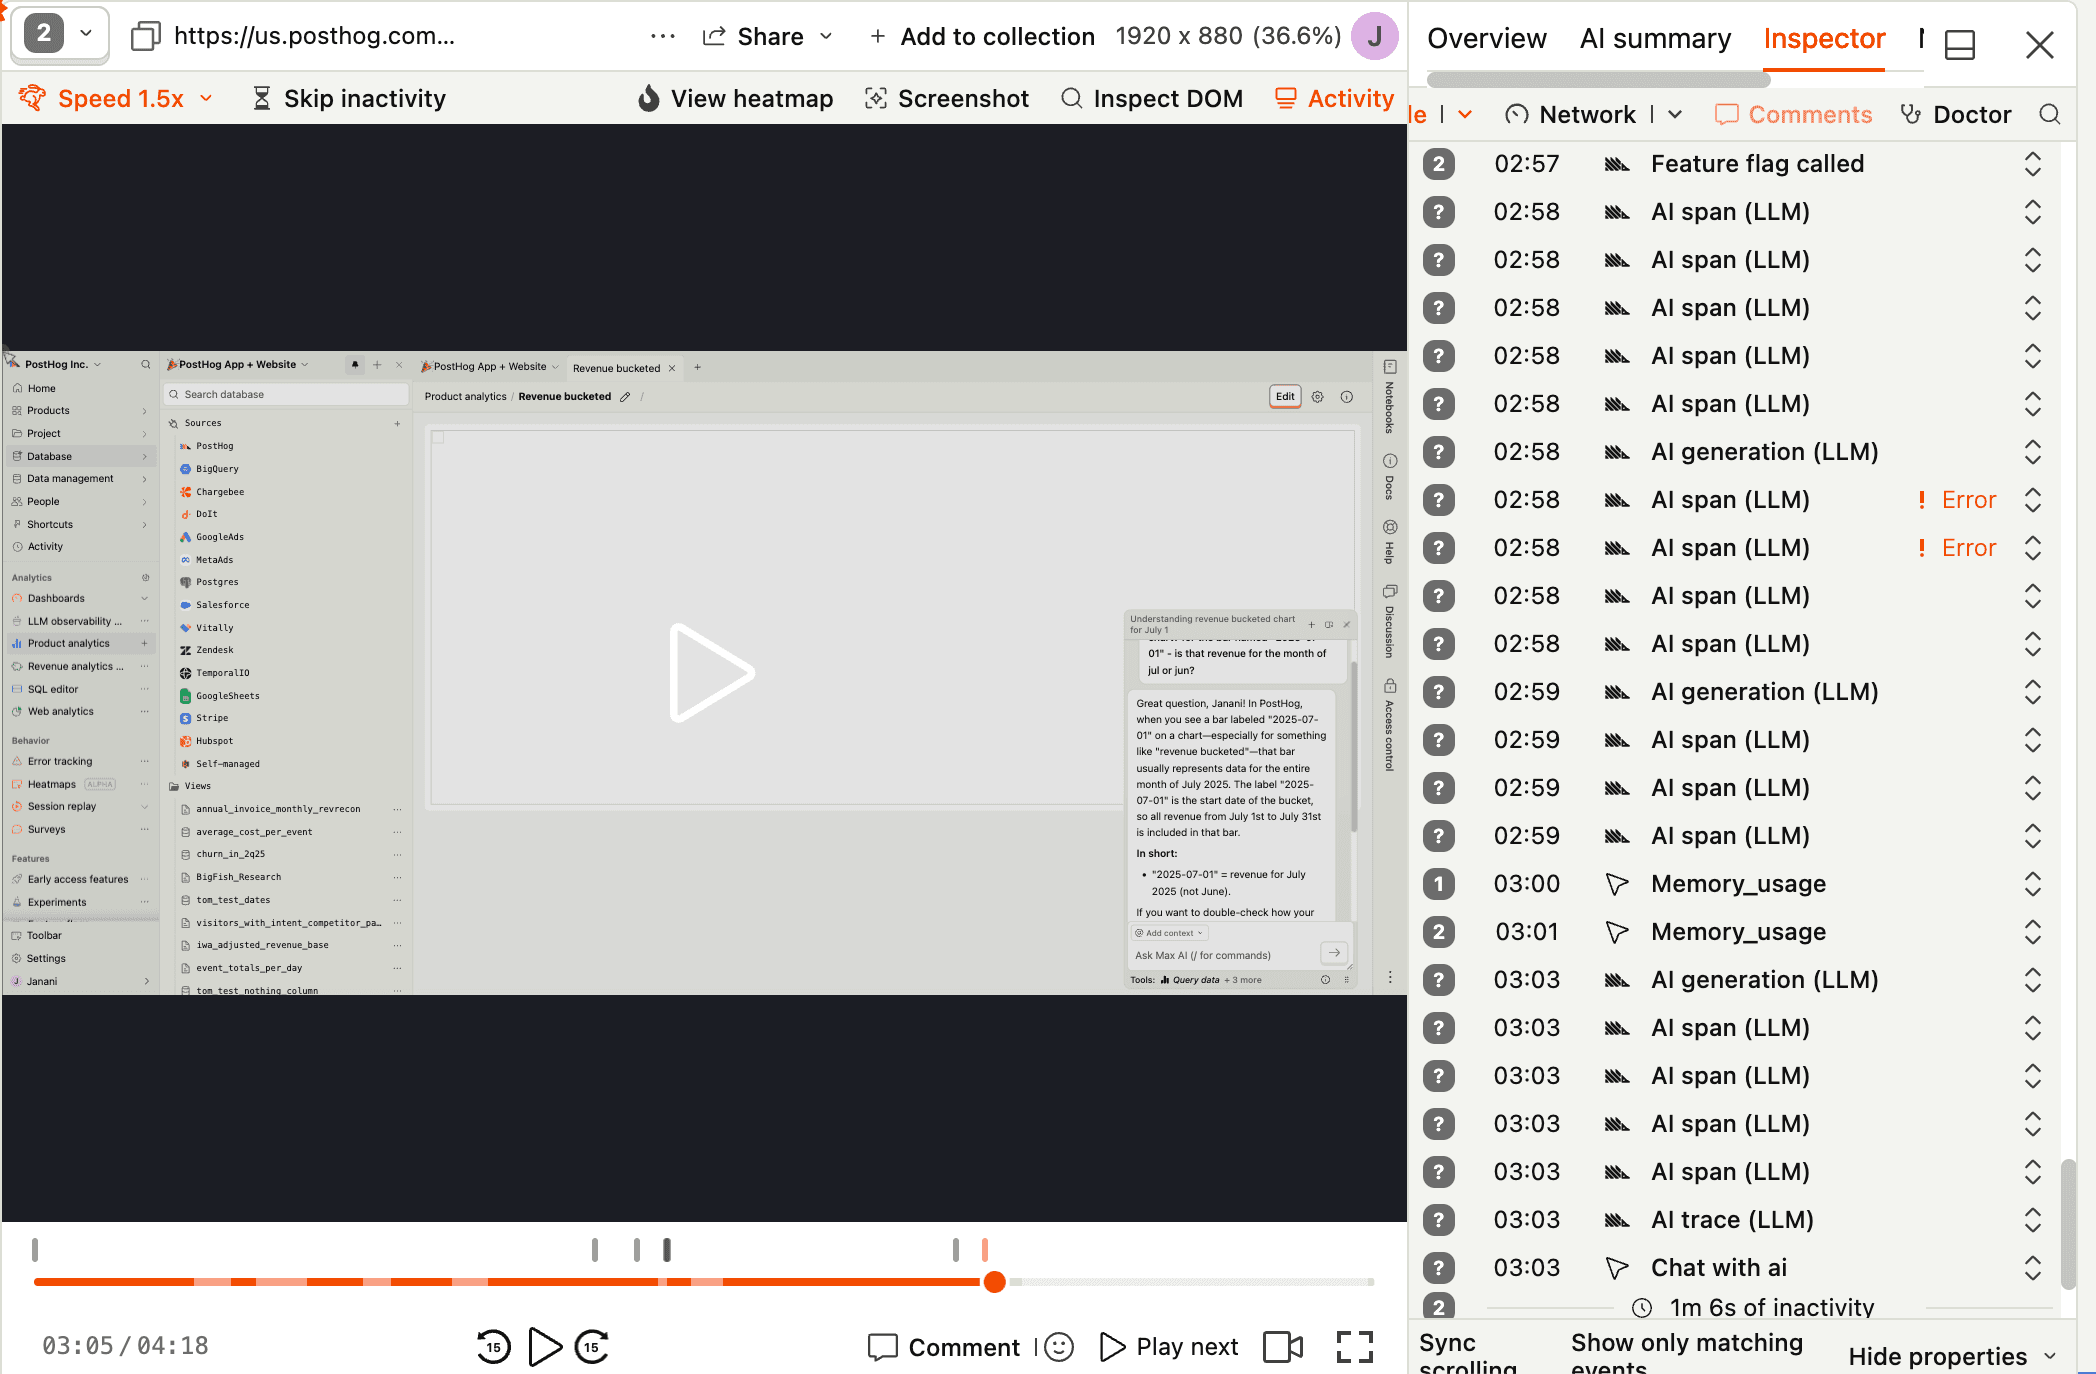
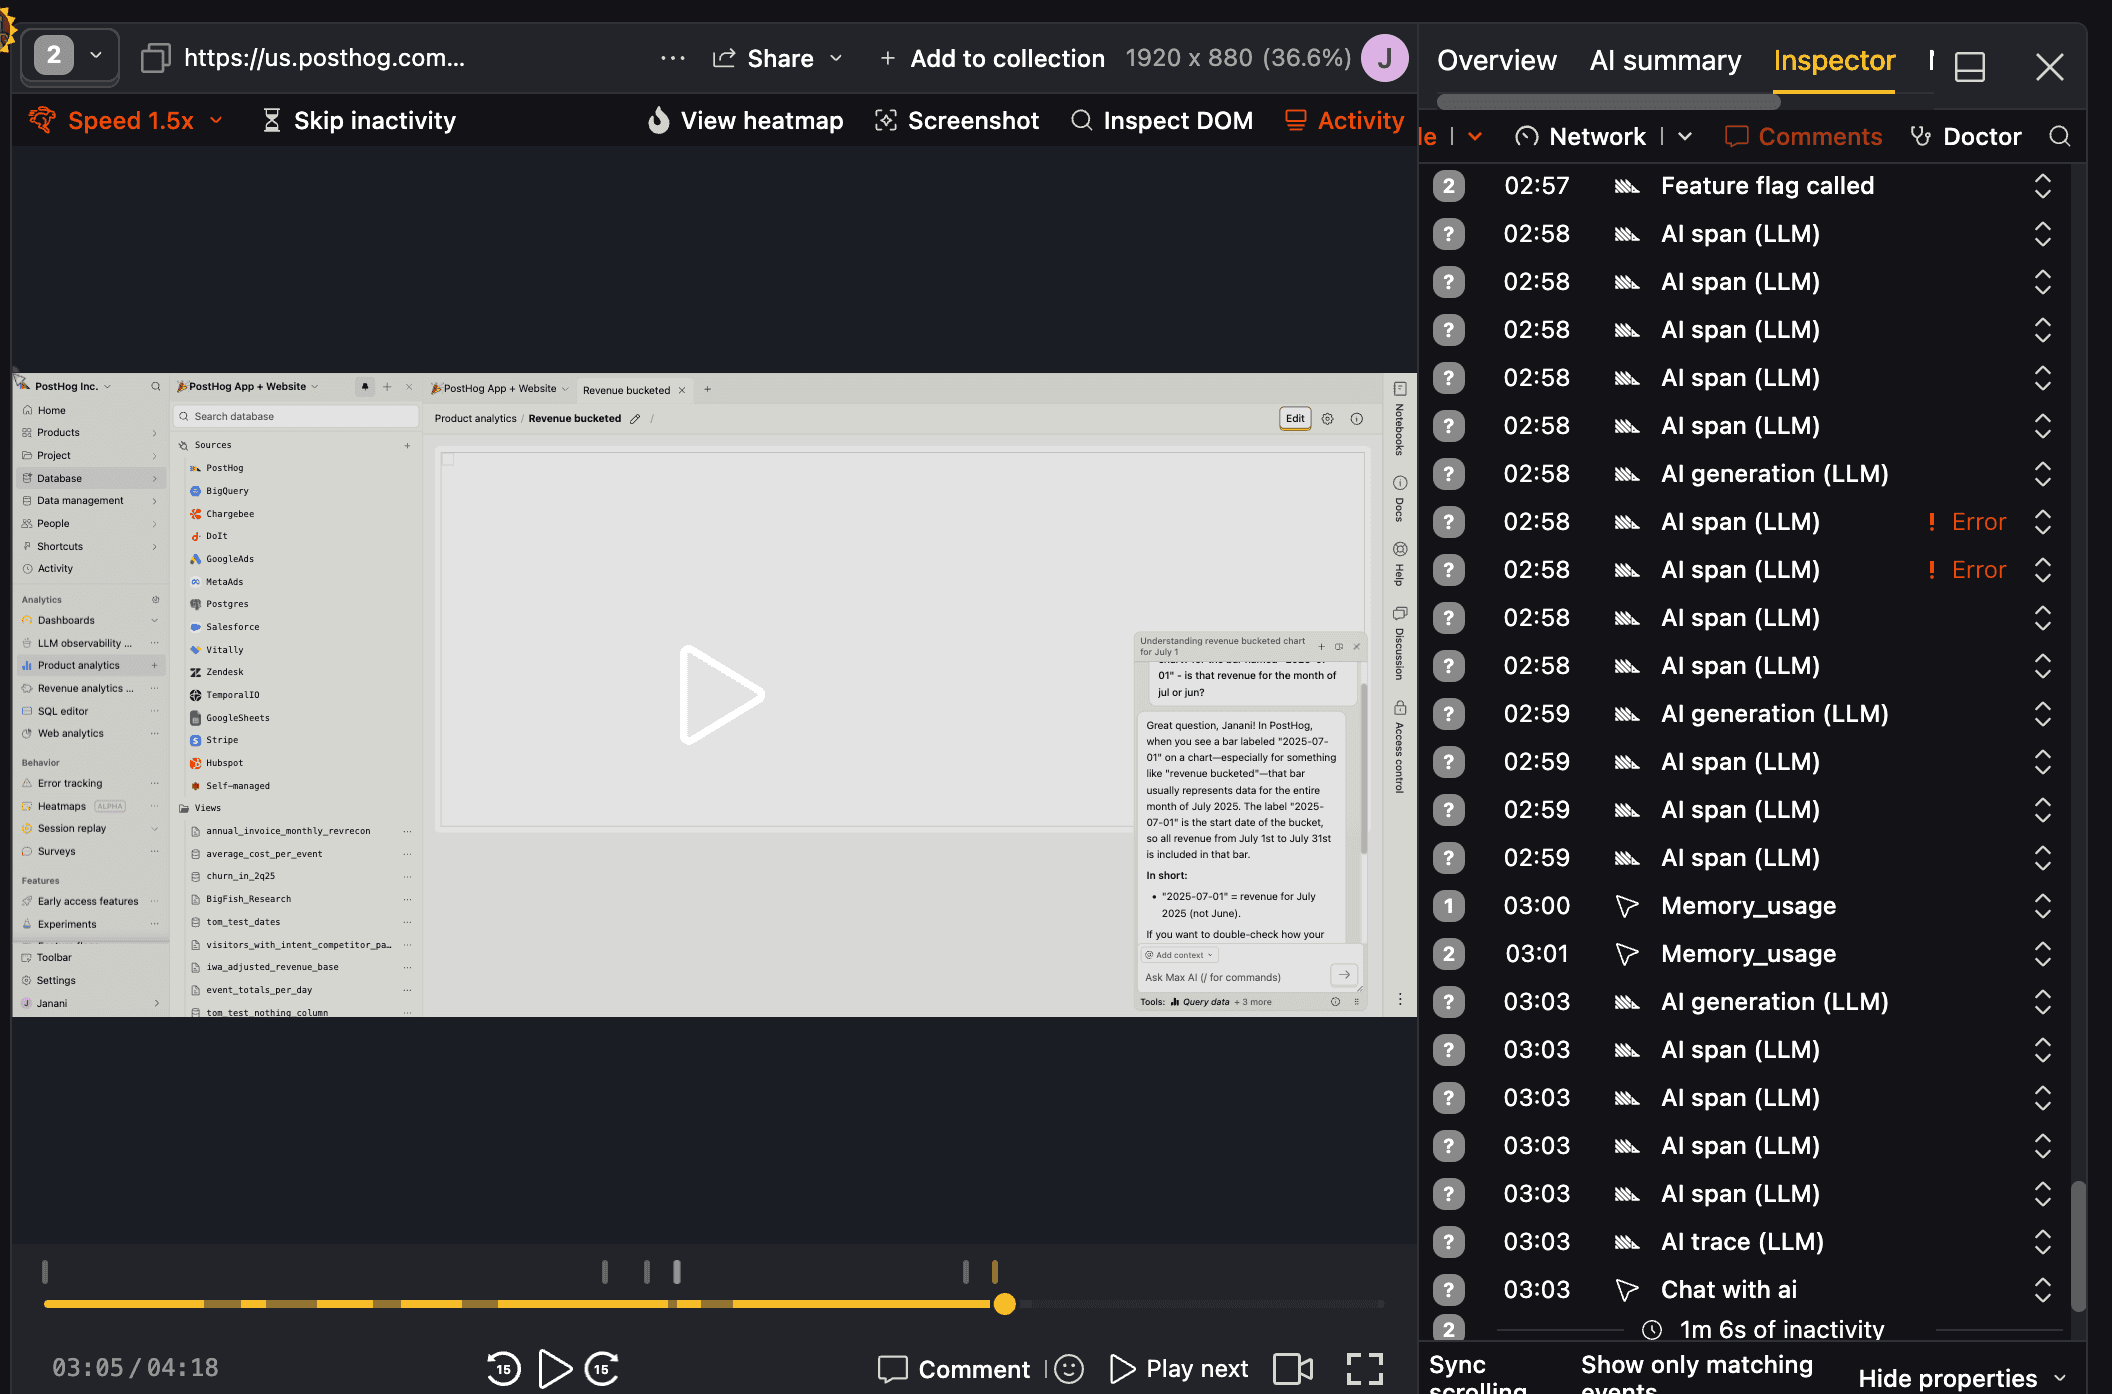
Session replay
Watch session replays to see exactly how users interact with your LLM features.
Use for free
PostHog AI Observability is designed to be cost-effective with a generous free tier and transparent usage-based pricing. Since we don't charge per seat, more than 90% of companies use PostHog for free.
TL;DR 💸
- No credit card required to start
- First 100K LLM events per month are free with 30-day retention
- Above 100k we have usage-based pricing at $0.00006/event
- Set billing limits to avoid surprise charges
- See our pricing page for more up-to-date details
That's it! You're ready to start integrating.