







The clues were there all along. Tracing is now in beta

Contents
Distributed tracing is now in beta. If you've been using PostHog Logs, you probably saw this coming.
PostHog starts with your user data and provides you with all the tools you need to build successful products, so debugging is an obvious must-have to keep your products working as expected. We have Error Tracking, Session Replay, and Logs in the PostHog debugging stack, so tracing will complement nicely to give you more of the context you need to resolve issues quickly, and more fuel for the agents doing it for you.
A trace is the full journey of a single request through your system, from the first incoming call to every service, queue, database, and third-party API it touches along the way. Each step is a span, stamped with how long it took and whether it succeeded, and they nest into a waterfall you can read top to bottom. Where a log tells you what happened at one point and an error tells you something broke, a trace shows you the whole path: what called what, in what order, and exactly where the time went.
What's in the beta
Point your existing OpenTelemetry exporter at PostHog's OTLP/HTTP endpoint, drop in a bearer token, and you're sending traces. There's no need for a new SDK or rewriting the instrumentation you already have.
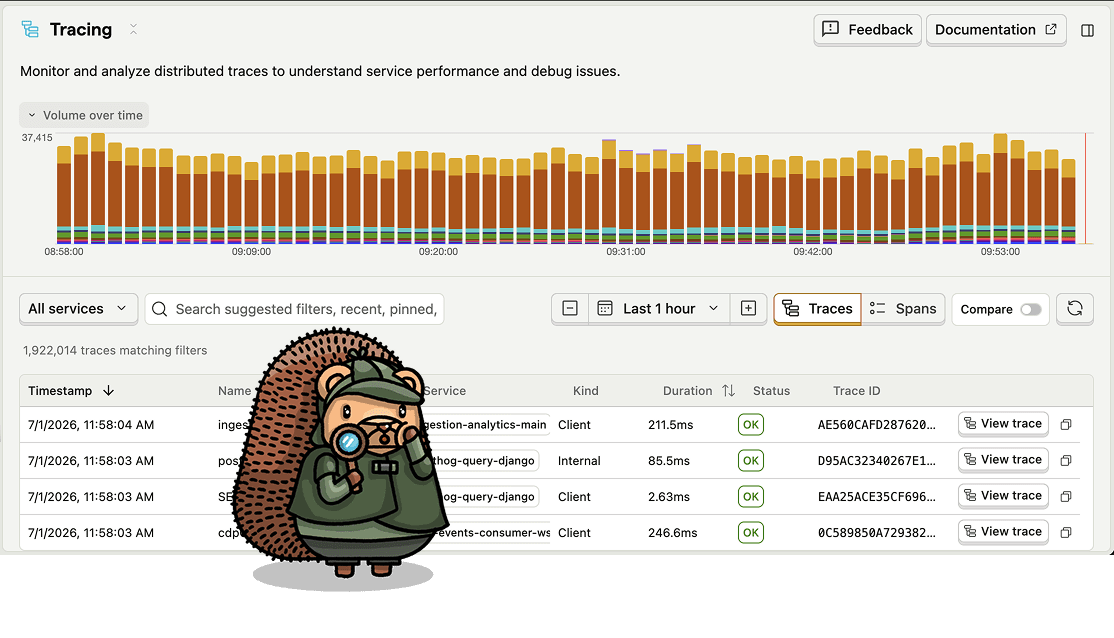
Inside PostHog, you get a volume sparkline for traffic at a glance, a filterable table of root spans (slice by service, name, kind, status, duration, trace or span ID, or any attribute on the span), and a flamegraph for any trace you click into. All of it lives on the same warehouse as your PostHog Logs, so the same query can run across both.
More fuel for your agents
Most observability tools assume a trace is something a site reliability engineer stares at on a dashboard: spans, services, latency, hosts. The user who hit the bug lives somewhere else, in your analytics, your replay, your support tool, so you end up juggling tools to work out who was actually affected.
We built observability on top of all our existing data instead. When a span lands in PostHog, it lands in the same project as your replays, your errors, your logs, and the user who triggered it.
That shared foundation is also what makes traces so useful to a self-driving product. Errors, replays, and funnels tell an agent that something's wrong. A trace tells it where and why: "checkout took 3.2s, and 2.8s of it was waiting on an N+1 query in the inventory service."
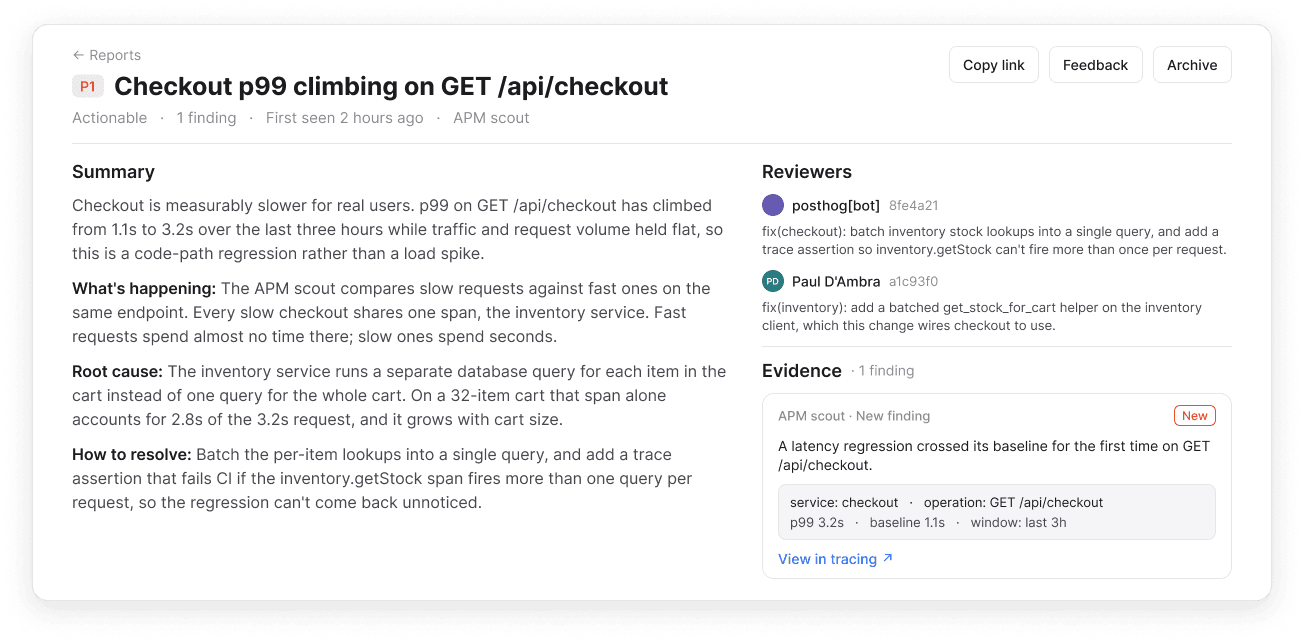
So a scout can catch the regression, an agent can trace it to the exact line, open a PR with the fix, and drop it in your Inbox. You hit merge. That's the whole job.
Debugging with PostHog
Say a user complains your checkout is slow. Because their user_id is on both your OTel spans and your PostHog events, you can pull up every span they triggered in the last hour and find the four-second wait on a downstream payment provider. From there, opening their session replay in another tab shows exactly what they were staring at while the request hung: same person, same session, all in the project you're already in.
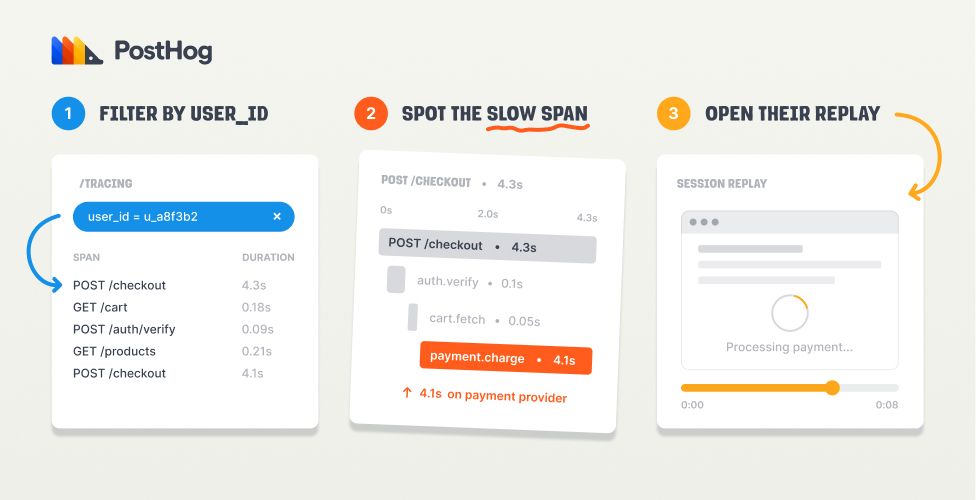
Whether you chase it down yourself or let a scout do it, it's the same context underneath. Once those links are wired, you could also use PostHog AI or our MCP to answer questions like:
Try it
Tracing is in beta now. The fastest way to get to it in is the wizard, which sets up self-driving and points your traces at PostHog for you:
Already instrumented? Point your existing OTel exporter at the endpoint and open the PostHog app to watch the spans land.
PostHog is your product's context layer. With a full suite of developer tools – AI observability, product analytics, session replay, feature flags, experiments, error tracking, logs, and more – PostHog ingests and stores all the data agents need to diagnose problems, uncover opportunities, and ship fixes. A data warehouse and CDP tie it all together, unifying that context into one source agents can read across. You can steer it all from Slack, the web app, the desktop (PostHog Desktop), or your own editor via the MCP.