







The best Grafana Loki alternatives & competitors, compared


Contents
Loki's biggest differentiator is its cost efficiency at scale, but that comes with trade-offs. It indexes only labels, so searching for a specific value means scanning the whole haystack for a needle.
Most days, that's not an issue. But during an incident, with a request ID in hand and LogQL churning through compressed chunks, you might wish you had a different tool.
Grafana knows this. In 2026, they shipped a major Loki rearchitecture and acquired Logline specifically to make finding request IDs and user IDs faster.
But if you want full-text search out of the box, fewer tools to set up and run, or logs tied to sessions and errors, there are other options.
This guide covers the best Grafana Loki alternatives available today so you can find what actually works for you.
1. PostHog
- Founded: 2020
- Similar to: Datadog, New Relic
- Typical users: Engineers and product teams
- Typical customers: Startups and mid-size B2B companies
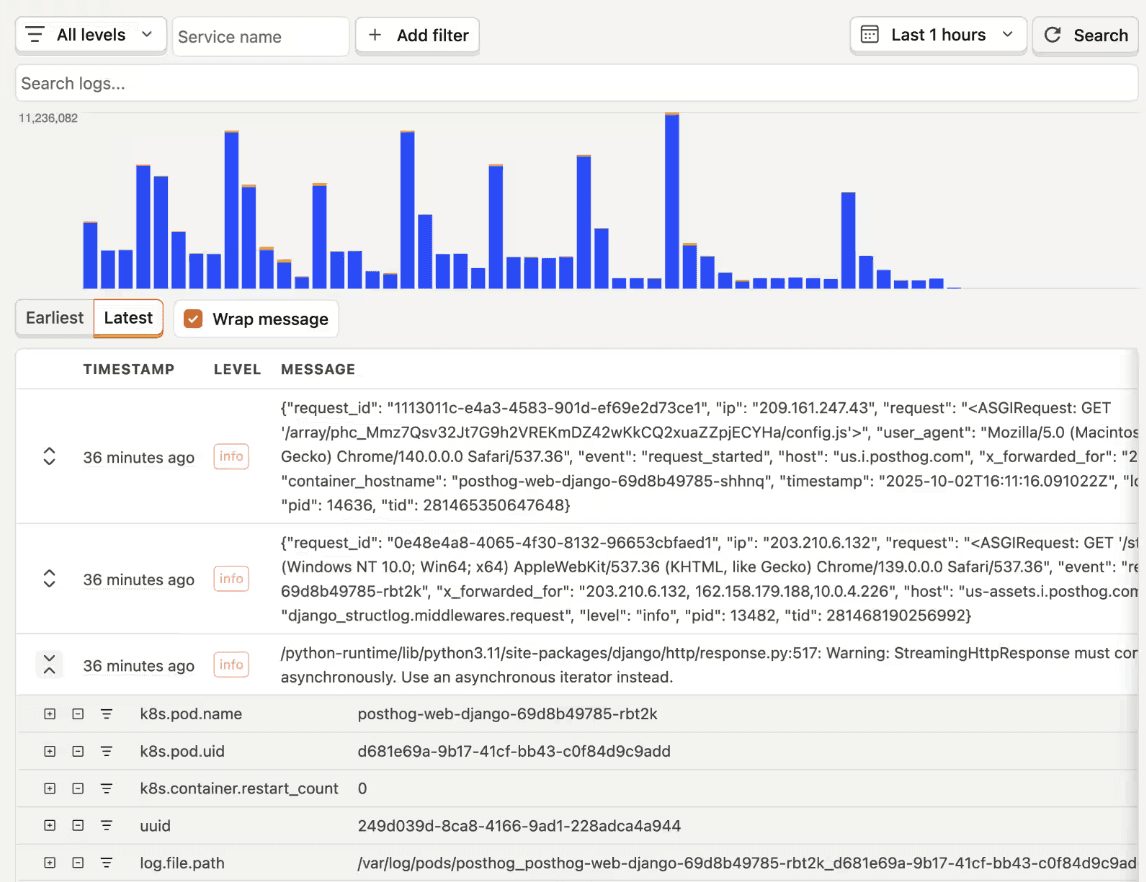
What is PostHog?
PostHog (that's us 👋) is a developer platform that makes your product self-driving. It combines Logs with Error Tracking, Session Replay, Product Analytics, Feature Flags, Experiments, AI Observability, and more in one place.
PostHog Logs is a standard OTLP receiver, so if you're already using an OpenTelemetry collector for Loki, pointing it at PostHog is a config change. From there, the experience is the opposite of Loki's: search by any log attribute (request IDs and user IDs included) with sparklines that surface spikes as you filter. Every month, you get 10 GB free with 14 days of retention.
Logs tie to user IDs and session replays, logged exceptions become trackable issues, and PostHog AI searches and summarizes logs in natural language – with MCP access so Claude Code, Codex, and Cursor can debug production from your editor.
Logs also feed the self-driving loop: PostHog watches them alongside errors and sessions, turns problems into reports, and opens PRs with the fix.
Key features
Logs: Filter and explore logs by service, severity, or any attribute without scrolling through raw text. Works with your existing OpenTelemetry setup.
Alerting and cost controls: Threshold alerts on log volume and patterns routed to Slack or webhooks, plus PII scrubbing, sampling, and level-based filtering to keep ingest (and spend) down.
Connected to users and errors: Browser and backend logs tie to user IDs and session replays. Logged
$exceptionevents become issues you can assign, resolve, and alert on, so error tracking is built in.AI observability: Keep track of AI product usage, monitor model performance, and debug LLM interactions alongside your logs.
AI investigation: Natural-language search and summarization via PostHog AI, the MCP server, and CLI let you query and use production logs from your editor.
How does PostHog compare to Grafana Loki?
Main differences between PostHog and Grafana Loki
PostHog connects logs to session replay, error tracking, product analytics, feature flags, and more in one workspace. With Grafana, you need to set up separate tools for each signal.
PostHog can act on what it finds – logs feed self-driving. Loki only shows you the logs.
Loki is queried with LogQL. PostHog lets you filter by log attributes or use SQL to dive deeper.
Loki needs Grafana for dashboards and Alertmanager for alerts. PostHog has dashboards and alerting built-in.
Main similarities between PostHog and Grafana Loki
Both are open source (PostHog under MIT, Loki under AGPLv3).
Both ingest logs natively via OpenTelemetry without requiring proprietary agents or SDKs and support alerting on log data.
Both keep costs low by design – Loki through label-only indexing and cheap object storage, PostHog through its usage of ClickHouse, ingestion controls, and broad platform of tools.
Both have hosted versions with generous free tiers.
Why do companies use PostHog?
According to reviews on G2, companies use PostHog because:
It replaces multiple tools: PostHog can replace Grafana Loki, LaunchDarkly, Mixpanel, Sentry, and many more. This simplifies workflows and keeps all debugging data in one place.
Pricing is transparent and scalable: Reviewers appreciate how PostHog's pricing scales as they grow. There's a generous free tier they can use forever, and teams eligible for PostHog for Startups also get $50k in additional free credits.
They need a complete picture of users: PostHog includes every tool necessary to understand users and improve products. This means going from a log line to the session replay, seeing which feature flag the user was on, and understanding the funnel they were in when something went wrong.
Bottom line
PostHog is the best Loki alternative for startups and scale-ups looking for logs, error tracking, AI observability, session replay, and product analytics in a single platform.


Install PostHog with one command
Paste this into your terminal and make AI do all the work.

2. Datadog
- Founded: 2010
- Similar to: New Relic, PostHog
- Typical users: DevOps engineers, SREs, platform engineers
- Typical customers: Mid-market to enterprise cloud-native companies
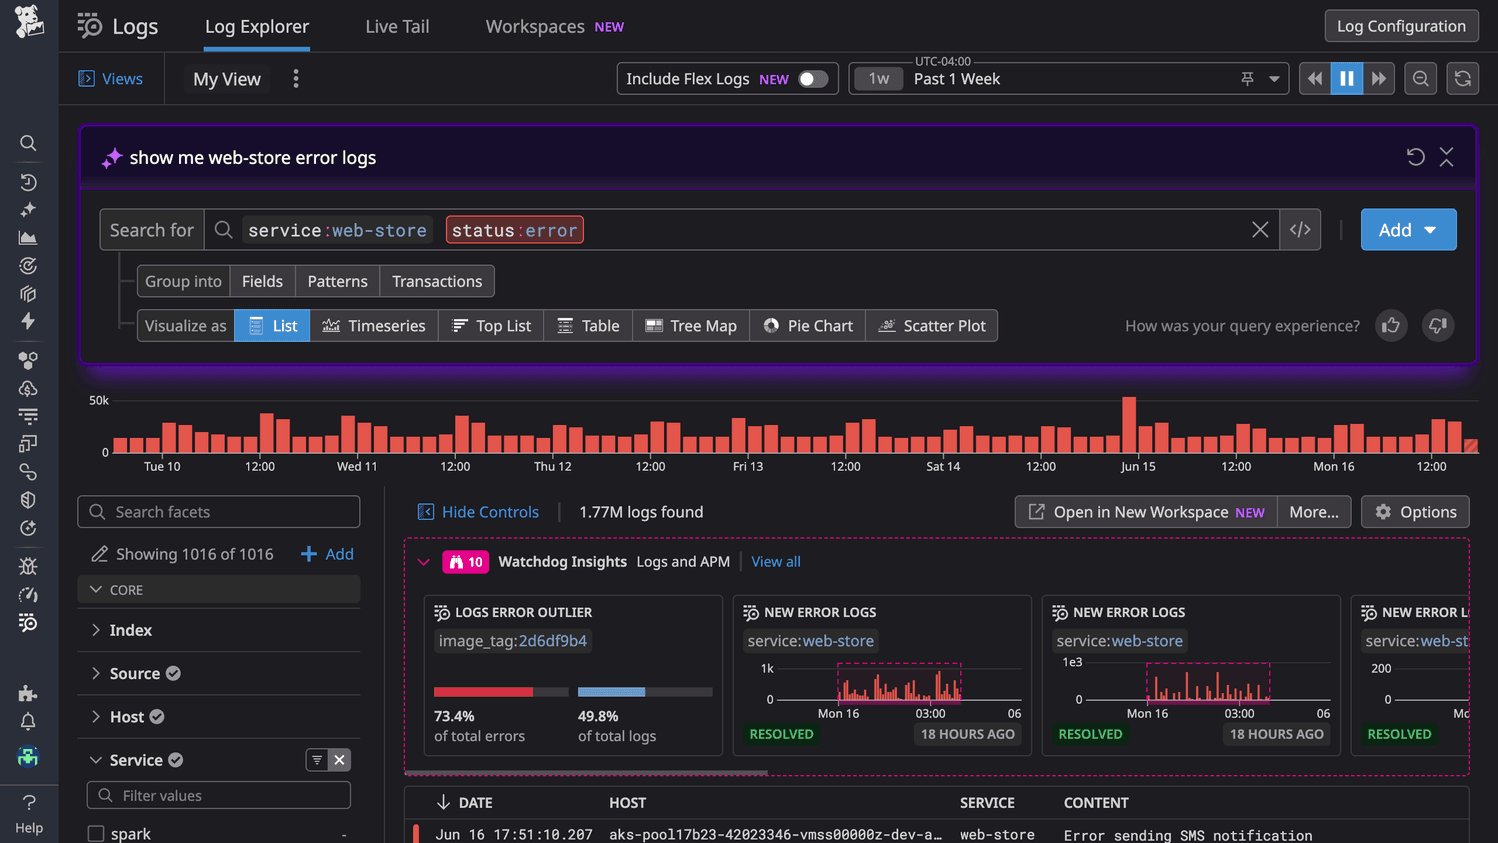
What is Datadog?
Datadog is an observability platform that puts your logs, metrics, traces, and app performance monitoring in one place. DevOps and SRE teams use it to see what's going on across their whole stack – a log, a trace, an infra metric – without having to jump between four different tools to figure out what broke.
Where Loki indexes only labels, Datadog indexes log content, so searching for a specific request ID is a lookup, not a scan. It leans on a "Logging without Limits" architecture: ingest everything, then choose what's worth indexing for search and what gets archived cheaply.
Something to keep an eye on is that Datadog charges separately for ingesting and indexing, with more meters for retention tiers and archive rehydration, and costs compound at exactly the log volumes that made Loki attractive in the first place.
Teams that leave Loki for Datadog are buying convenience and correlation, not savings.
Key features
Log management: Aggregate and search logs in real-time to identify issues and understand system performance.
APM: Monitor application performance with end-to-end distributed tracing across services.
Infrastructure monitoring: Get visibility into hosts, containers, and Kubernetes across cloud or hybrid environments.
Alerting: Set threshold and anomaly-based monitors covering logs, metrics, and traces.
1000+ integrations: Hooks into almost anything in a modern stack.
Session replay: Capture real user sessions alongside backend observability data.
How does Datadog compare to Grafana Loki?
Main differences between Datadog and Grafana Loki
Datadog indexes log content – anything you choose to index is fully searchable. Loki indexes only labels, which keeps costs low but makes ad-hoc, full-text searches slower.
Loki is just the log store, you assemble the rest from Grafana (dashboards), Mimir (metrics), Tempo (traces), and more. These are all open source with a managed option in Grafana Cloud. Datadog ships logs, metrics, traces, and APM as one product.
Loki is OTel-friendly by design and collects via Grafana Alloy. Datadog converts OpenTelemetry data into its own format, and many advanced features still require its proprietary agent.
Main similarities between Datadog and Grafana Loki
Both support live log tailing and real-time streaming.
Both alert on log patterns and thresholds – Datadog through its monitors, Loki through the Ruler and Alertmanager.
Both are built for Kubernetes environments and collect via agents (Datadog Agent or Grafana Alloy).
Both can ship logs to object storage, such as S3 or GCS, for cheaper long-term retention.
Why do companies use Datadog?
According to reviews on G2, companies use Datadog because:
Single source of truth: Reviewers say Datadog replaced tools like Grafana or Elastic. Having logs, metrics, APM, and traces in one place means they're not jumping between tabs when something breaks.
Correlation saves time: It is fast to go from a log to the related trace to the infra metric that spiked without leaving the same screen.
Alerts that don't cry wolf: Reviewers like that they can set combined alerts for logs, metrics, and anomalies, focusing the team on only important issues.
Bottom line
If you want an all-in-one, fully managed monitoring tool, Datadog is a great Grafana Loki alternative.
3. SigNoz
- Founded: 2021
- Similar to: Grafana, Better Stack
- Typical users: DevOps engineers, SREs, backend developers
- Typical customers: Startups and mid-size engineering teams building on OpenTelemetry
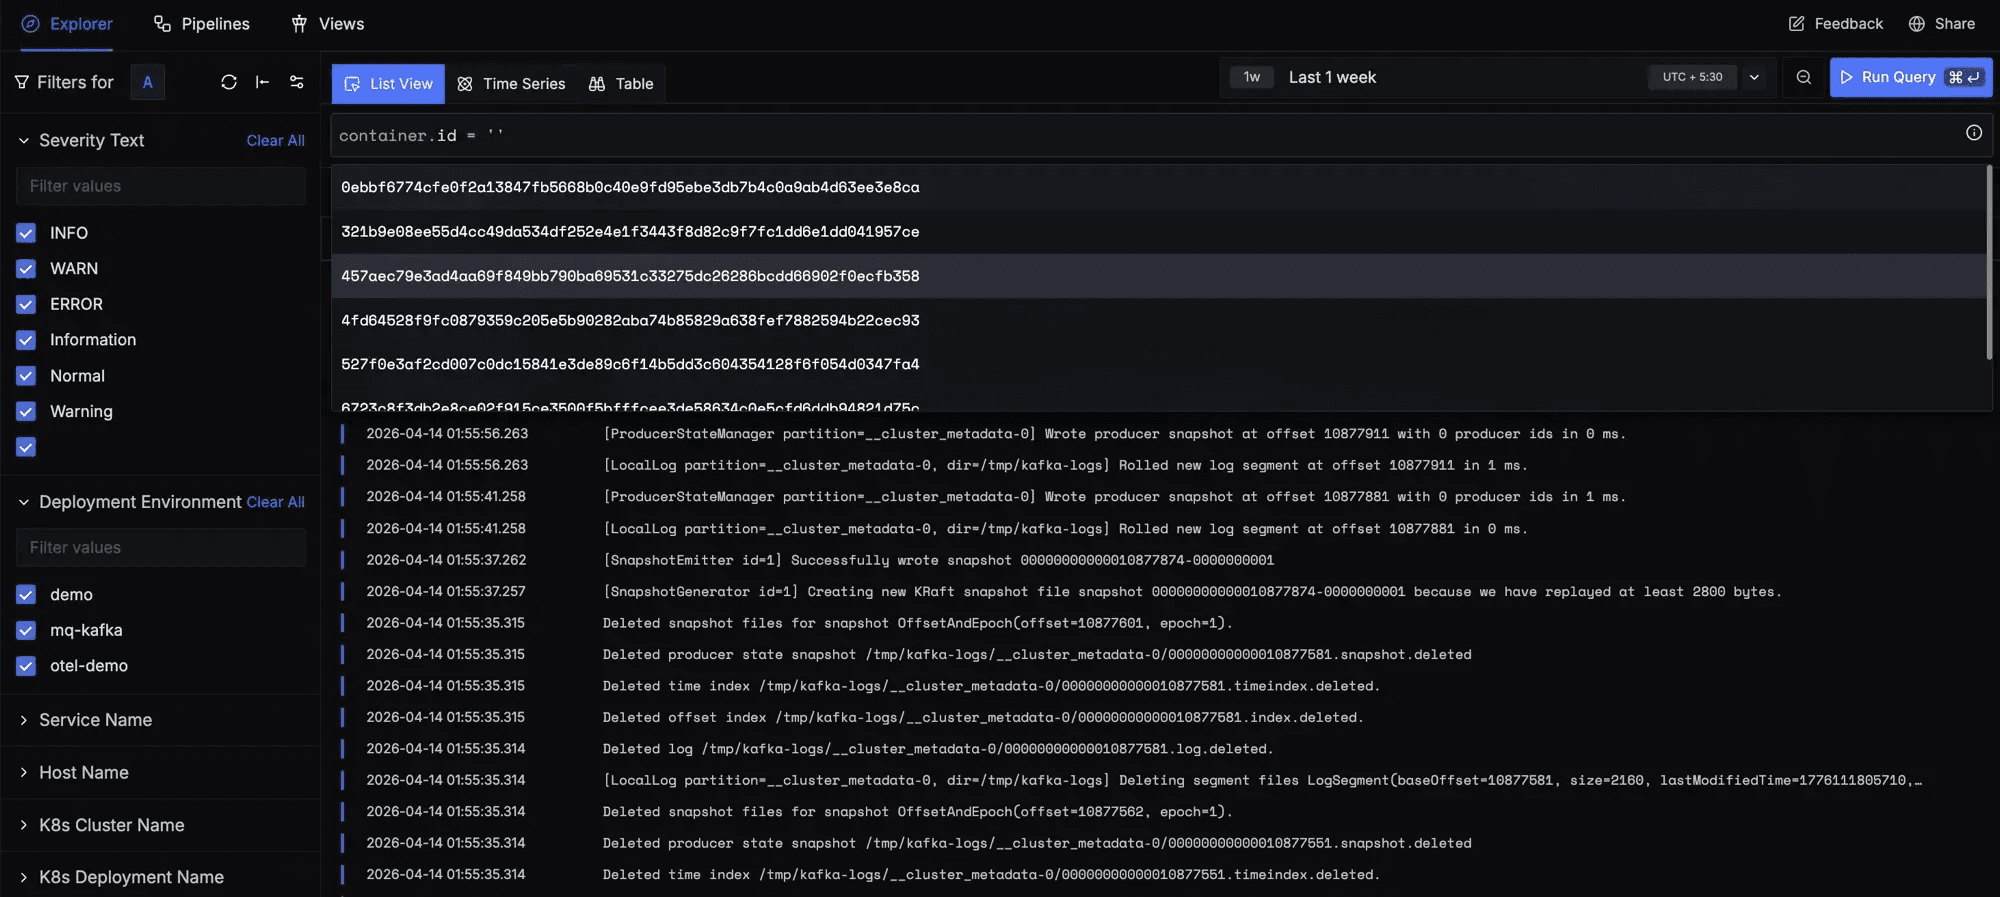
What is SigNoz?
SigNoz is an open-source observability platform built natively on OpenTelemetry. It brings logs, metrics, and traces into one product so engineering teams can monitor their applications, find what broke, and fix it without stitching together different tools.
Logs, metrics, and traces are stored in ClickHouse, a columnar database that stays fast on high-cardinality queries – so searching for a specific request ID is a normal query, not a scan across compressed chunks.
If the appeal of Loki was open source but the assembly wore you down, SigNoz is the same license philosophy with fewer moving parts. The community edition is free to run; SigNoz Cloud starts at $49/month with usage included, billed on data volume with no per-seat or per-host fees.
Key features
Log management: Search and filter logs even at high ingest volumes. ClickHouse keeps searches fast, even with lots of data.
Application performance monitoring: Trace requests across services with a waterfall view that shows where time went.
Metrics: Monitor infrastructure and application performance with dashboards and alerts.
OpenTelemetry native: Built for OpenTelemetry from the start which makes it easy to send logs, metrics, and traces without changing your existing instrumentation.
Alerting: Catch issues early with threshold-based and anomaly-detection alerts.
How does SigNoz compare to Grafana Loki?
Main differences between SigNoz and Grafana Loki
SigNoz is a full observability platform. Loki is a log store (dashboards, alerts, traces, and metrics come from the surrounding Grafana stack).
SigNoz stores full log content in ClickHouse, so any field is searchable fast. Loki indexes only labels, requiring scans for full-text searches.
SigNoz was built around OpenTelemetry's data model from the start. Loki accepts OTLP (natively since 3.0) but its underlying model is still labels and log streams.
Loki is AGPLv3; SigNoz's Community Edition is MIT licensed which is more permissive for commercial use, but this only matters if you're building a product on top of them.
Main similarities between SigNoz and Grafana Loki
Both use a log stream concept to group related log lines from the same service instance.
Both support threshold-based alerting on log data.
Both are built for Kubernetes, with Helm charts as the standard install path.
Both have managed cloud options for teams that don't want to run their own infrastructure.
Why do companies use SigNoz?
SigNoz doesn't have a G2 page, but based on Reddit discussions and community feedback, teams use it because:
Data stays in your own infrastructure: Teams with compliance or data residency requirements self-host SigNoz so telemetry never leaves their environment.
Everything correlates out of the box: You can go from a slow trace to the logs from that request in one click. Teams say this cuts down debugging time compared to using separate tools for each signal.
Clean UI that's easy to pick up: Reviewers mention the interface is straightforward even for engineers who aren't deep into observability. Getting a new team member up to speed doesn't take long.
Bottom line
SigNoz is a solid open-source alternative to the Grafana stack. Worth considering if your team is already on OpenTelemetry and wants logs, traces, and metrics in one place.
4. Better Stack
- Founded: 2021
- Similar to: SigNoz
- Typical users: Developers, SREs, small-to-mid engineering teams
- Typical customers: Startups and SMBs
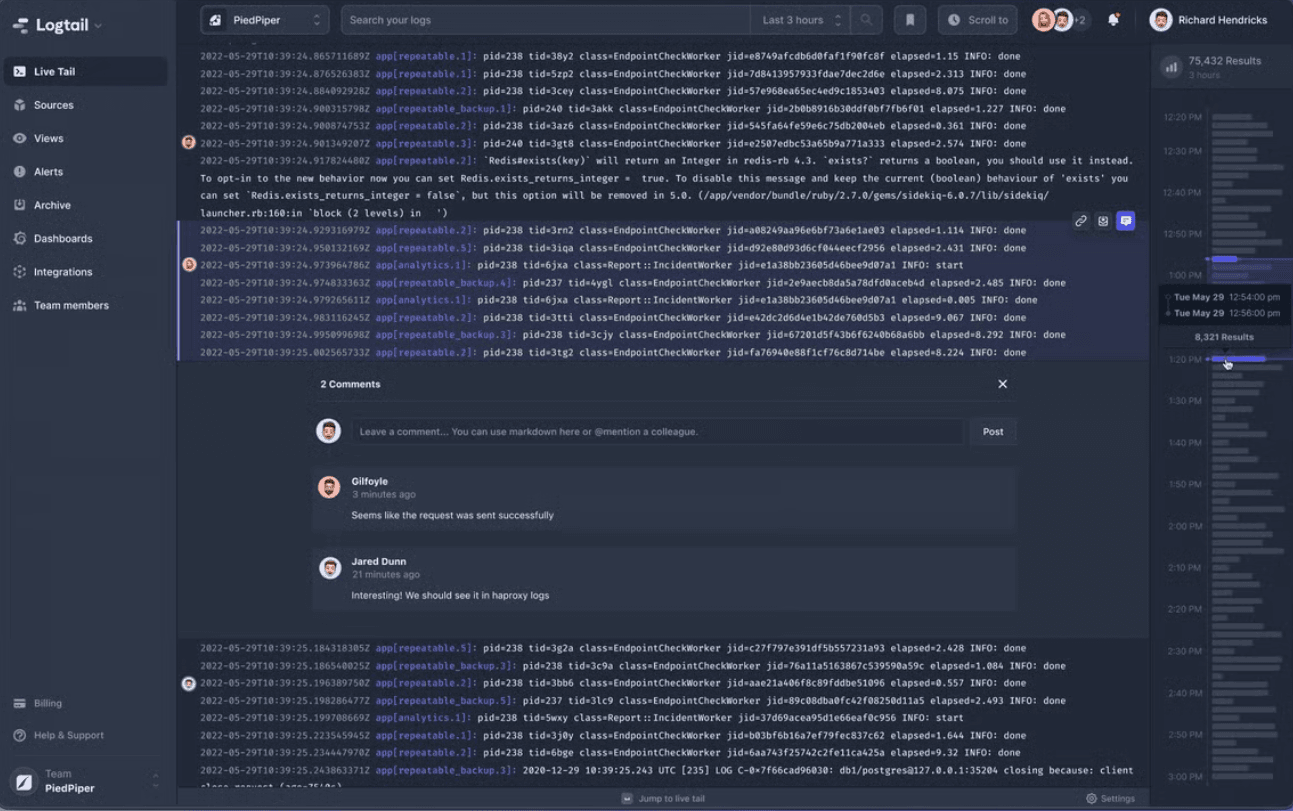
What is Better Stack?
Better Stack is a managed observability platform with logs, traces, metrics, uptime monitoring, and on-call built in. It's a go-to for SREs and small engineering teams that want a single monitoring tool.
The log side runs on ClickHouse, so queries stay fast at scale, and you write them in plain SQL. Around the logs, Better Stack bundles the operational chain Loki leaves to other tools: uptime monitors, alerting with phone and SMS escalation, incident timelines, and public status pages in one product.
There's also an AI SRE agent that investigates incidents in Slack using your logs, metrics, and traces.
Better Stack is closed source and cloud-only. The free tier includes 3 GB of logs with 3-day retention alongside monitors, a status page, and session replays, with paid plans from around $30/month.
Key features
Log management: Aggregate logs and query them with the drag-and-drop query builder or SQL and PromQL.
Uptime monitoring: Monitor services from a global network with checks happening as frequently as every 30 seconds. Screenshots and traceroutes are automatically captured on failure.
Incident management: Handle on-call schedules, status pages, and alerts without a separate tool.
Distributed tracing: Auto-instrument your services with eBPF.
AI SRE: Get an AI agent to investigate incidents using logs, traces, and metrics – works in Slack, MS Teams, and via MCP.
How does Better Stack compare to Grafana Loki?
Main differences between Better Stack and Grafana Loki
Better Stack includes tracing, uptime monitoring, and on-call out of the box. Loki offers logs only. Tracing, in the Grafana ecosystem, comes from Tempo while on-call and uptime monitoring come from Grafana Cloud (no open source option for these).
Better Stack lets you search any log field with SQL. Loki indexes only labels; full-text searches require scanning compressed chunks.
Better Stack handles high-cardinality fields well. Loki can too, but only if you keep them out of labels and use structured metadata. You'll hit slowdowns otherwise.
Better Stack is closed-source. Loki is open source under AGPLv3.
Main similarities between Better Stack and Grafana Loki
Both ingest OpenTelemetry data natively.
Both have a free way to start – Loki as open source, Better Stack with 3 GB of logs on its free plan.
Both support alerting on log data.
Both support live tailing to stream logs in real time.
Why do companies use Better Stack?
According to reviews on G2, companies use Better Stack because:
It's fast to get value from: Setup takes minutes – some users went from zero to a working log dashboard in under a day.
The UI is actually good: Dashboards are clean, good-looking out of the box, without needing to configure anything.
The free tier is generous: The free plan includes things other tools charge for, like custom domain status pages and Slack integration.
Bottom line
If you're a startup or small engineering team that wants managed log monitoring with uptime and incident management built-in, Better Stack is a great Grafana Loki alternative.
5. Elastic
- Founded: 2012
- Similar to: OpenSearch, SigNoz
- Typical users: Data engineers, security analysts, platform engineers
- Typical customers: Enterprise and mid-market teams, security-heavy orgs
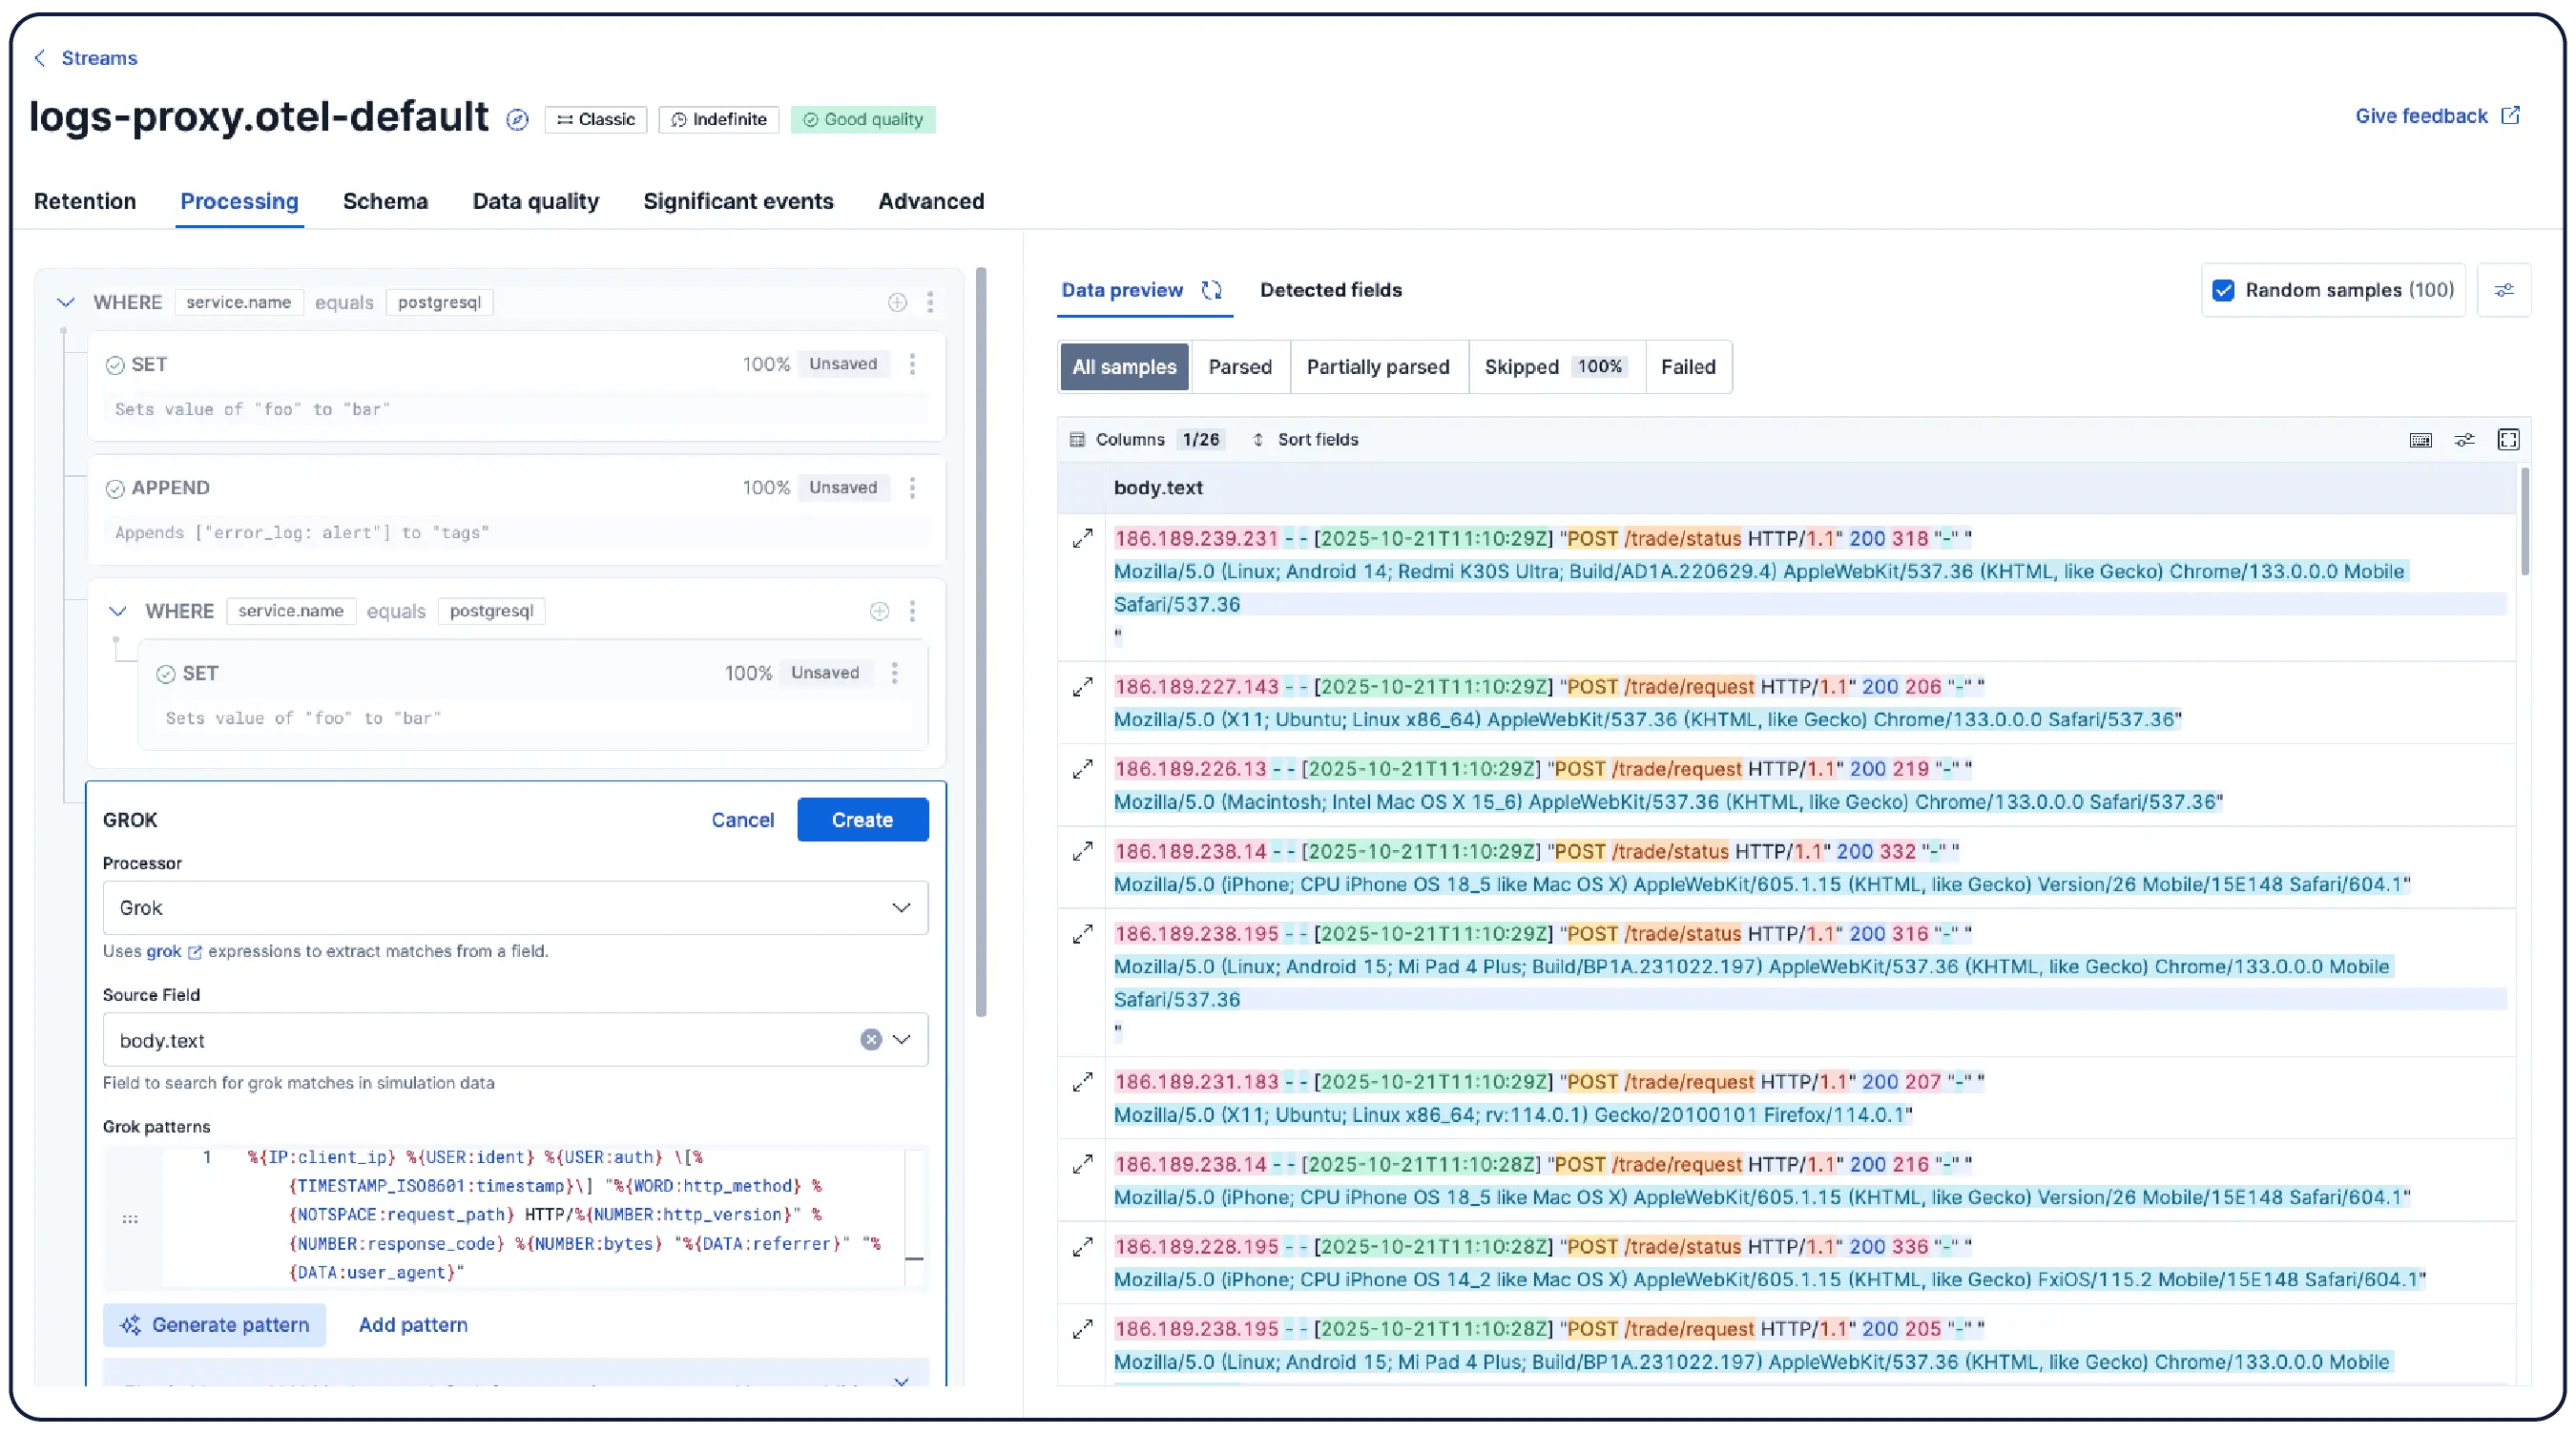
What is Elastic Stack?
Elastic Stack (ELK Stack) is a set of tools built on an open-source foundation for ingesting, searching, and visualizing log data. Elasticsearch sits at the core, Kibana handles dashboards and queries, and Logstash and Beats handle data collection.
Every log line is full-text indexed at ingest, so any search – a request ID, an error string, a fragment of a stack trace – is fast, ad-hoc, and doesn't depend on choosing the right labels up front.
This search depth is what Loki was explicitly designed as a cheaper alternative to. If slow needle-in-a-haystack queries are what brought you to this post, Elastic is the most direct solution for it.
That being said, indexing everything is expensive, in both storage and operations. Running Elasticsearch well means cluster sizing, shard management, and index lifecycle tiering to keep retention affordable. Elastic Cloud offers the managed path for teams that want the search without the cluster ops.
Key features
Full-text search: Index and search fields in your logs. Elasticsearch queries return results in milliseconds across large datasets.
Kibana dashboards: Build custom dashboards, save searches, and share query URLs with your team during incidents.
APM and distributed tracing: Trace requests across services and correlate them with logs and infrastructure metrics.
Security and SIEM: 1,000+ prebuilt detection rules covering cloud platforms, endpoints, and networks, with biweekly updates from Elastic Security Labs.
Flexible deployment: Run it yourself, on Elastic Cloud, or serverless
How does Elastic Stack compare to Grafana Loki?
Main differences between Elastic Stack and Grafana Loki
Elastic indexes every log field by default. Loki indexes only labels, which keeps costs low but makes ad-hoc, full-text searches slower.
Elastic is an entire stack of tools that includes APM, distributed tracing, and a built-in SIEM. Loki handles logs only – everything else comes from the surrounding Grafana stack.
Elastic has a steeper learning curve and requires more infrastructure to run well. Loki is simpler to operate, especially on Kubernetes.
Main similarities between Elastic Stack and Grafana Loki
Both manage retention costs with storage tiering: Elastic's hot-warm-cold index lifecycle, Loki's compaction and retention policies on object storage.
Both have managed cloud options for teams that don't want to run their own infrastructure.
Both have their own query language to learn – ES|QL for Elastic, LogQL for Loki.
Both alert on log queries evaluated on a schedule.
Both work as Grafana data sources, so if Grafana is your dashboard layer, either can sit behind it.
Why do companies use Elastic Stack?
G2 reviewers are fans of Elastic Stack because:
The search is fast: Elasticsearch handles millions of log entries and returns results in near real-time, which makes production troubleshooting quicker.
The dashboards are good: Kibana specifically is easy to build, easy to share, and useful for teams who need a central place to investigate issues.
It all works together: The integration between Elasticsearch, Kibana, Logstash, and Beats means they spend less time connecting tools and more time actually using them.
Bottom line
If you need full-text search across logs and a built-in SIEM, Elastic Stack is worth the operational overhead.
6. New Relic
- Founded: 2008
- Similar to: Datadog, PostHog
- Typical users: Full-stack developers, SREs, DevOps engineers
- Typical customers: Small teams to enterprise
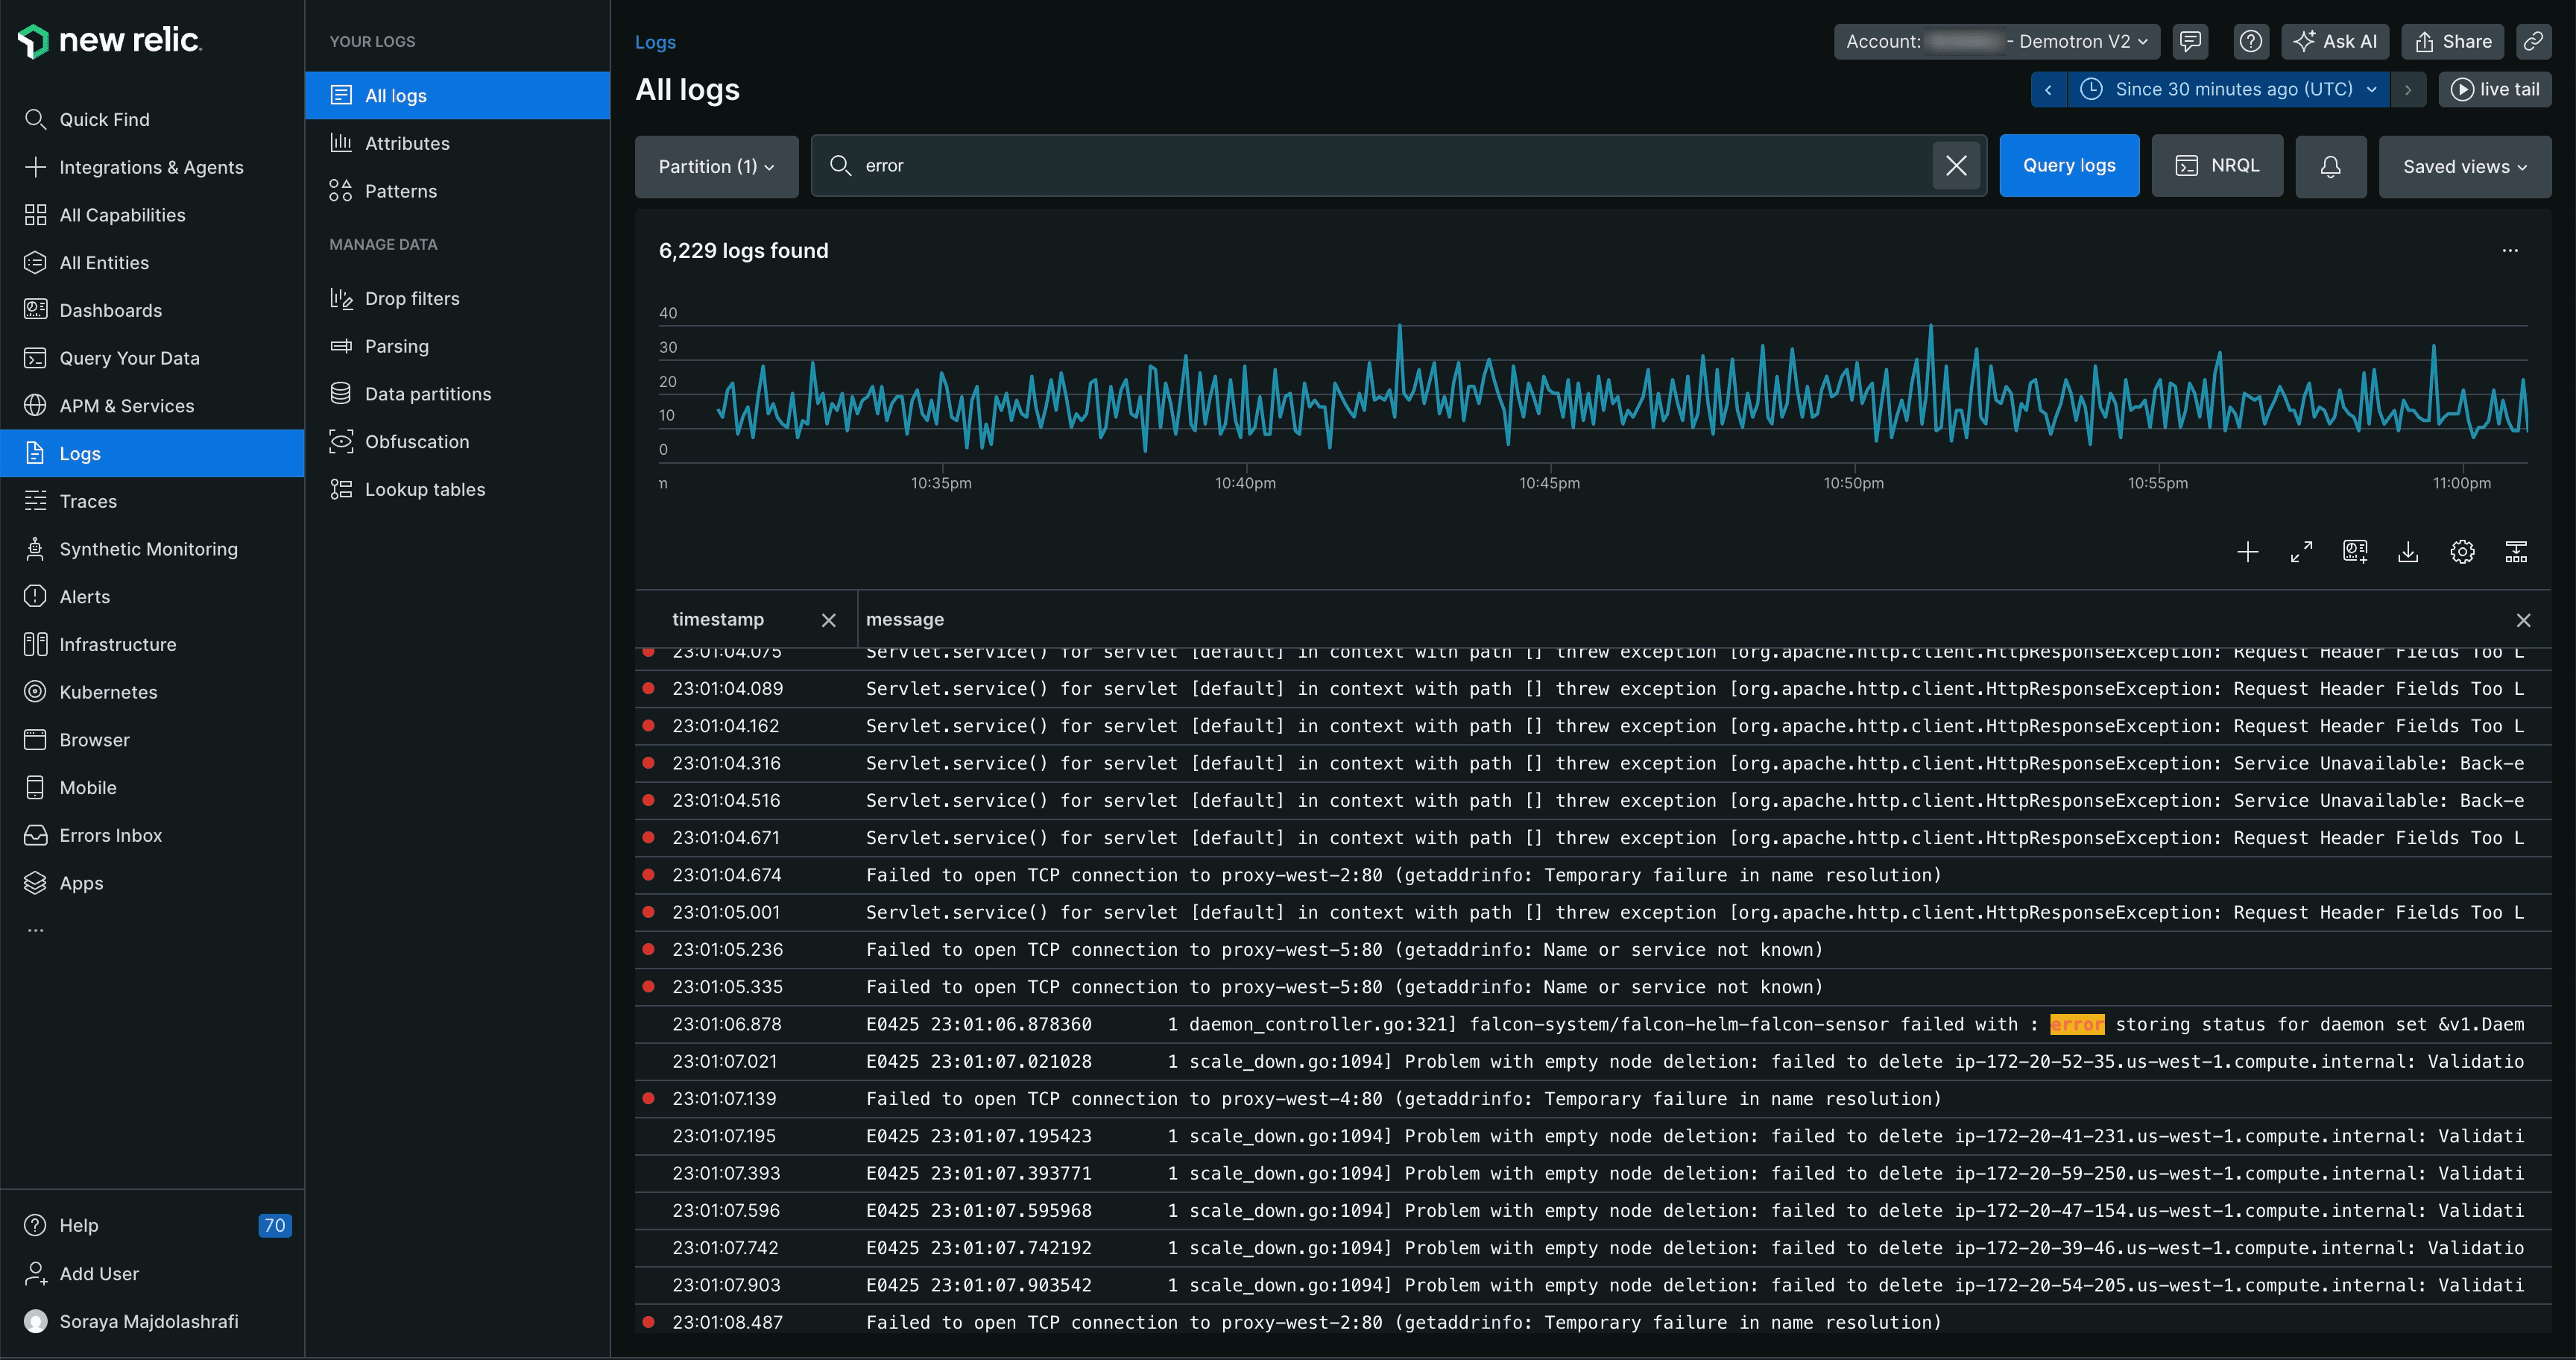
What is New Relic?
New Relic is a full-stack observability platform that puts logs, metrics, traces, and APM in one place. Teams that already use New Relic for application monitoring get log management as part of the same platform they're already in.
New Relic's free tier includes roughly 100 GB of ingest per month with 8-day retention – enough to run significant production workloads for a small team before paying anything, with no cluster to size or storage to manage.
Logs are indexed and searchable by any field, queried with NRQL, a SQL-like language, and automatically linked to the traces and APM data from the same requests.
Above the free tier, New Relic charges per GB ingested and core or full platform users. Seats are expensive enough that for mid-sized teams, headcount often becomes a bigger line item than data. Coming from Loki, where cost tracks volume and nobody pays for a seat, that's the structural change to calculate before committing.
Key features
Log management: Search and filter logs in real time. Every log is automatically tied to the APM trace and infra metric from the same request.
APM: Get a full-stack view of application health – response times, error rates, and slow transactions.
Infrastructure monitoring: See what's happening across hosts, containers, and Kubernetes clusters.
Alerting: Set monitors on logs, metrics, and traces and get notified in Slack, PagerDuty, or via webhook when something fires.
Session replay: Watch exactly what a user was doing when something broke with the related logs and traces loaded alongside it.
How does New Relic compare to Grafana Loki?
Main differences between New Relic and Grafana Loki
New Relic has a full APM product built in. Loki is a log store; there's no application performance monitoring unless you're using the rest of the Grafana stack.
New Relic uses NRQL. Loki uses LogQL, which follows the same conventions as PromQL.
New Relic charges per GB and per user above its 100 GB free tier. Loki's managed path, Grafana Cloud, charges on volume with a 50 GB free tier, 14-day retention, and no per-seat fees.
New Relic is closed-source. Loki is open source under AGPLv3.
Main similarities between New Relic and Grafana Loki
Both support alerting on log data and integrate with Kubernetes out of the box.
Both collect logs via lightweight agents and work well with cloud-native, distributed applications.
Both accept OpenTelemetry data natively.
Both can turn log queries into metrics – New Relic through events-to-metrics rules, Loki through recording rules.
Why do companies use New Relic?
According to G2, companies choose New Relic because:
One tool covers the whole stack: Reviewers say New Relic replaced separate tools for APM, logs, infrastructure, and user monitoring. Everything shows up in one dashboard, so diagnosing an incident doesn't mean switching between four tabs.
It fits almost any stack: With hundreds of integrations, reviewers rarely hit a setup it couldn't handle.
Frontend problems trace back to backend causes: Reviewers call out being able to see where a user hit an error on the frontend and follow it straight to the slow endpoint or failing transaction that caused it.
Bottom line
New Relic's 100GB/month free tier is the most generous on this list (even if retention is shorter), and it includes APM, traces, and session replay, not just logs. Worth a look if you want more than a log store.
7. OpenSearch
- Founded: 2021
- Similar to: Elastic Stack, Grafana Loki
- Typical users: DevOps engineers, data engineers
- Typical customers: AWS-centric organizations and enterprise teams
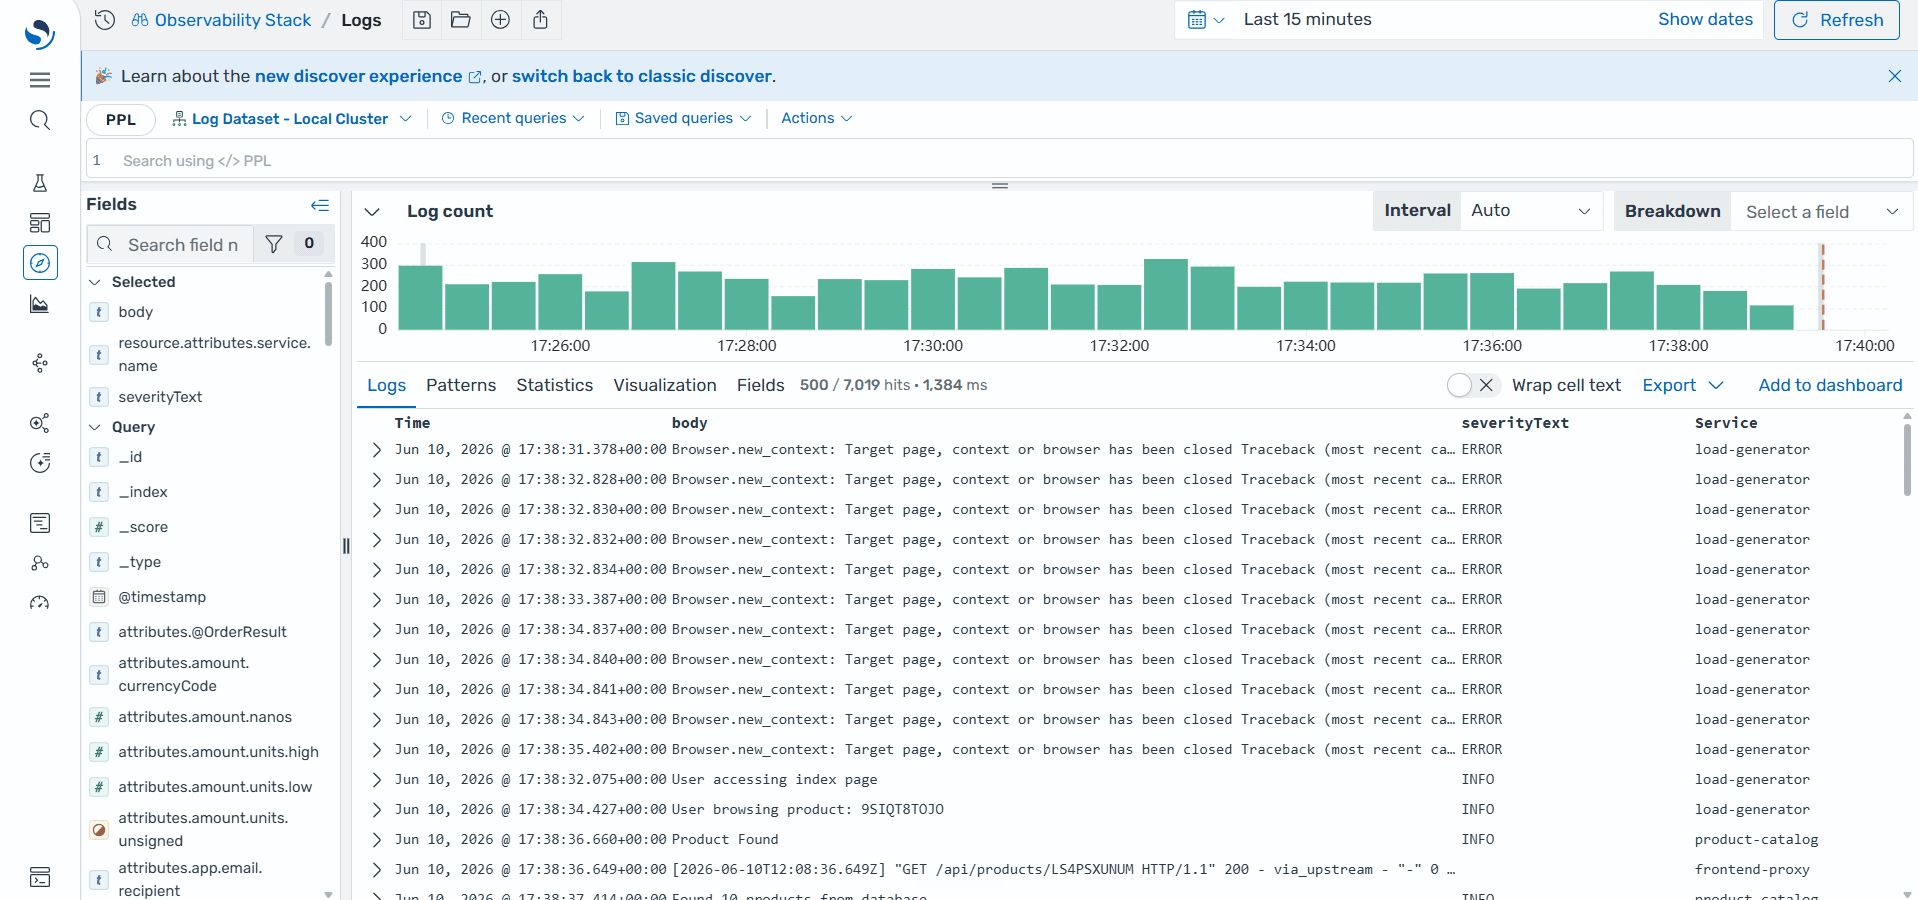
What is OpenSearch?
OpenSearch is an open-source search and analytics suite, forked from Elasticsearch in 2021 and now governed by the Linux Foundation. Engineering teams use it to run full-text log search at scale – self-hosted on their own infrastructure or managed through Amazon OpenSearch Service.
Like Elastic, every log line is full-text indexed, so searching for a request ID or an error string is fast and doesn't depend on label discipline. It also ships its own dashboards (a Kibana fork), anomaly detection, and alerting in the same suite.
What distinguishes it from Elastic is the license and the governance – Apache 2.0 with Linux Foundation stewardship, the most permissive setup of any full-text option here, with no commercial features held back.
Many teams take the managed path via Amazon OpenSearch Service – a natural fit if you're already on AWS.
Key features
Full-text search: Find what you're looking for across log fields.
OpenSearch Dashboards: Turn raw log data into charts the whole team can read. Share a saved search with one link during an incident.
Trace analytics: Follow a request across every service it touched. See where it slowed down, where it failed, and why.
Alerting: Know when something goes wrong before a user reports it. Alerts go straight to Slack, PagerDuty, or any webhook.
Security analytics: Spot threats in your logs as they happen.
How does OpenSearch compare to Grafana Loki?
Main differences between OpenSearch and Grafana Loki
OpenSearch doesn't stop at logs; security analytics, dashboards, and trace analytics ship in the same suite. Loki handles logs only and relies on the surrounding Grafana stack for dashboards, traces, and metrics.
OpenSearch needs significantly more compute and memory to run well, while Loki's whole architecture is built around being lightweight and cheaper to operate, but neither would be considered "simple."
Teams coming from Elasticsearch can move to OpenSearch with little to no query rewriting. Loki means learning LogQL.
OpenSearch doesn't have a managed free tier. Loki does through Grafana Cloud.
OpenSearch is Apache 2.0 licensed with no restrictions on commercial use. Loki is AGPLv3, which has stricter terms for teams building services on top of it.
Main similarities between OpenSearch and Grafana Loki
Both are open source and free to self-host.
Both support tiered storage so you can move older logs to cheaper storage automatically.
Both have native Kubernetes operators that make cluster deployment and management on Kubernetes straightforward.
Both automate retention – OpenSearch through Index State Management policies, Loki through its compactor and per-tenant retention settings.
Why do companies use OpenSearch?
Based on reviews of Amazon OpenSearch Service on G2, teams use OpenSearch because:
Developers and support engineers work from the same data: Reviewers say having logs, search, and dashboards in one place means fewer back-and-forth conversations between teams during incidents. Everyone looks at the same thing.
It just keeps running: Reviewers running the managed service say they've gone years without touching the underlying infrastructure.
Non-engineers can read the dashboards too: Reviewers specifically call out that OpenSearch Dashboards makes operational metrics clear enough for stakeholders outside the engineering team to follow during an incident.
Bottom line
OpenSearch is a solid pick as a Grafana Loki alternative for AWS-native teams that want open-source full-text log search without taking on the Elastic license or rebuilding from scratch.
8. VictoriaLogs by VictoriaMetrics
- Founded: 2018
- Similar to: Grafana Loki, Elastic Stack
- Typical users: SREs, DevOps engineers, platform teams
- Typical customers: Startups and mid-size engineering teams
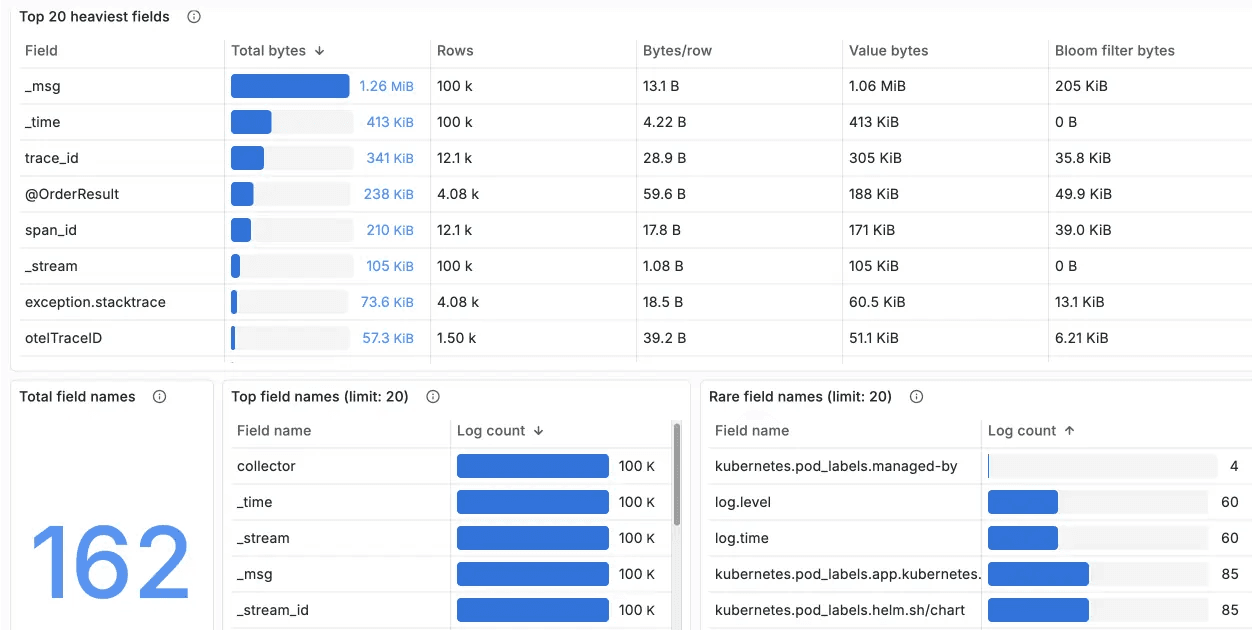
What is VictoriaLogs?
VictoriaLogs is an open-source log database from VictoriaMetrics, built to store and query logs with significantly less memory and disk usage than most alternatives. It went GA in November 2024 as a standalone product.
It shares Loki's core bet: no Elasticsearch-style full indexing, lightweight to run, cheap to store. It automatically indexes every field with bloom filters so full-text search remains fast.
Migration is unusually gentle too: VictoriaLogs accepts Loki's own push protocol, so Fluent Bit, Vector, or Grafana Alloy can ship to it without config surgery, and it plugs into Grafana as a data source so your dashboards carry over.
The tradeoffs are youth and ecosystem. VictoriaLogs is the newest tool here, its LogsQL query language is one more thing to learn, and the resource-efficiency numbers – impressive as they are – come mostly from VictoriaMetrics' own benchmarks.
There's no permanent managed free tier either: VictoriaMetrics Cloud offers a one-month trial, versus Grafana Cloud's standing 50 GB with 14-day retention.
Key features
LogsQL: Search, filter, and aggregate logs without a predefined schema.
Agent compatibility: Works with Promtail, Fluent Bit, Logstash, Filebeat, and Vector out of the box.
Low resource usage: Run the same log volumes on significantly less hardware.
MCP server: Ask questions about your logs directly from any MCP-compatible AI tool.
Alerting: Set threshold-based rules on log data and get notified in Alertmanager or any webhook.
How does VictoriaLogs compare to Grafana Loki?
Main differences between VictoriaLogs and Grafana Loki
VictoriaLogs supports fast full-text search across all log fields without building a full index through the use of bloom filters. Loki only indexes labels, so searching other fields requires a scan.
Loki has a mature, managed version in Grafana Cloud with a 50 GB per month free tier. VictoriaMetrics Cloud is newer and only offers a one-month trial.
VictoriaLogs uses LogsQL, its own query language; Loki uses LogQL. Similar names but they are different languages.
VictoriaLogs is Apache 2.0; Loki is AGPLv3, with stricter terms for building services on top.
Main similarities between VictoriaLogs and Grafana Loki
Both are open source and free to self-host.
Both work with the standard ingestion agents – Fluent Bit, Vector, Logstash, and Grafana Alloy can ship to either (VictoriaLogs even accepts Loki's own push protocol).
Both are built to be lightweight alternatives to Elasticsearch-style full indexing.
Both support alerting on log data natively.
Why do companies use VictoriaLogs?
VictoriaLogs has no G2 reviews yet, but based on community posts on Dev.to and GitHub, here's what engineers say about it:
It's fast to get running: Engineers say they were ingesting logs and running queries within minutes. Scaling up is the same binary with different flags.
The storage savings are real: Teams are consistently surprised by how little disk space VictoriaLogs needs. One engineer moved a dataset and said it took up much less space than expected.
Queries are fast, even at scale: Engineers benchmarking it on real production data consistently rate query speed at the top.
Bottom line
VictoriaLogs is worth a look if you want open-source log storage that's cheap to run and quick to set up if you're already using VictoriaMetrics for metrics.
Which Grafana Loki alternative should you choose?
Want logs connected to a full suite of developer tools – and a platform that finds bugs and opens PRs via self-driving mode? Go with PostHog.
Need to replace Loki, Tempo, Mimir, and Grafana with one open-source product? SigNoz covers them.
Looking for the most generous free tier on managed observability? New Relic gives you 100GB/month.
Managed log monitoring with uptime and on-call built in? Better Stack is purpose-built for that.
Security-heavy team that needs full-text search and a built-in SIEM? Elastic Stack is worth the overhead.
AWS-native stack wanting open-source full-text search without the Elastic license? OpenSearch is the natural fit.
Already on Loki and want to keep your agents but search any field without planning labels? VictoriaLogs is the closest.
Full-stack observability, fully managed, with APM and traces? Datadog ties it all together.
Is PostHog right for you?
We're biased, obviously, but we think PostHog is the best Grafana Loki alternative if:
You value transparency. We're open source and open core.
You want logs next to the rest of your debugging tools like error tracking, session replays, feature flags, product analytics, and more in one workspace.
You're a startup or small engineering team that wants a generous free tier and easy set up.
It's completely free to get started – no credit card required. Our setup wizard handles configuration in minutes, or check out our docs to do it yourself.
Install PostHog with one command
Paste this into your terminal and make AI do all the work.
Frequently asked questions
What is Grafana Loki used for?
Loki collects and stores logs from your applications and infrastructure. Unlike most log tools, it doesn't index the full content of every log line, which keeps it cheap to run.
Most teams pair it with Grafana for dashboards, Prometheus for metrics, and Tempo for traces.
What's the difference between Loki's label indexing and full-text search?
With Loki, you decide what to index before logs come in. Anything you didn't label isn't indexed and will require a scan to search it.
Full-text index tools like Elastic Stack and OpenSearch index every field at ingest. You can search anything, any time, without planning ahead – but full indexing is heavy. It costs more to store and run than Loki's label-only approach.
A middle camp gets you searchable-anything without the full index: PostHog, SigNoz, and Better Stack store full log content in columnar databases (ClickHouse) where filtering by any attribute is just a fast query, and VictoriaLogs uses bloom filters to keep full-text search quick.
Can PostHog replace Grafana Loki?
For most engineering and product teams, yes. PostHog puts logs next to error tracking, session replay, feature flags, product analytics, and more in one platform – so when something breaks, you already know who was affected and what they were doing.
It can also do something Loki can't: act on what it finds. Logs feed self-driving mode, where PostHog watches them alongside errors and sessions, turns problems into researched reports, and opens PRs with the fix.
What's the best managed Grafana Loki alternative?
Beyond Grafana Cloud itself, PostHog if you want logs connected to errors, replays, and analytics. SigNoz Cloud is the pick for a managed OTel-native stack, Better Stack bundles uptime and incidents, New Relic covers full-stack APM, and Datadog offers the broadest coverage at the highest cost.
Which Loki alternative has the simplest setup?
PostHog is the easiest to get started with – the setup wizard walks you through configuration in a few minutes and there's nothing to host or maintain.
If you want something self-hosted, VictoriaLogs is a single binary with no tuning needed. Better Stack is also quick to get running on the managed side.
How do the free tiers and retention of these logging tools compare?
| Tool | Free logs | Free retention |
|---|---|---|
| New Relic | 100 GB/mo | 8 days |
| Grafana Cloud | 50 GB/mo | 14 days |
| PostHog | 10 GB/mo | 14 days (30-day add-on) |
| Better Stack | 3 GB | 3 days |
| SigNoz Cloud | trial only | 15 days (trial) |
| Elastic Cloud | trial only | — |
| VictoriaMetrics Cloud | trial only | — |
| Datadog | none | — |
OpenSearch is free to self-host, but their AWS hosted service has no free tier.

Subscribe to our newsletter
build mode
Read by 75,000+ founders and builders
We'll share your email with Substack
PostHog is your product's context layer. With a full suite of developer tools – AI observability, product analytics, session replay, feature flags, experiments, error tracking, logs, and more – PostHog ingests and stores all the data agents need to diagnose problems, uncover opportunities, and ship fixes. A data warehouse and CDP tie it all together, unifying that context into one source agents can read across. You can steer it all from Slack, the web app, the desktop (PostHog Desktop), or your own editor via the MCP.